REVIEW 3 major objections 5 minor 1 cited by
Characterization of Supersonic Jet and Shock Wave with High-Resolution Quantitative Schlieren Imaging
T0 review · 3 major / 5 minor · reviewed 2026-08-12 · deepseek-v4-flash
Pith's one-line read A modified single-pass Schlieren system resolves 4.6 µm features while returning quantitative density-gradient profiles.
desk verdict A simple, genuinely new Schlieren layout with solid resolution evidence, undercut by an unstated line-of-sight inversion for the blade-shock density profiles in §4.3. read the letter →
The pith
A machine-rendered reading of the paper's core claim, the machinery that carries it, and where it could break.
The reading
What carries the argument
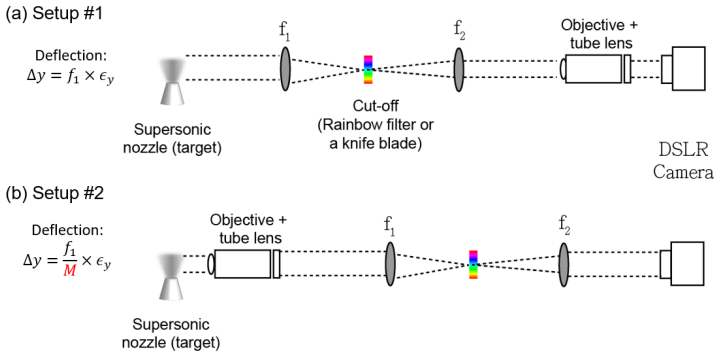
The central mechanism is the decoupled single-pass Schlieren arrangement: a collimated beam passes through the jet, a lens of focal length $f_1=300$ mm focuses the deflected rays onto a knife-blade cutoff, and a 5X objective plus tube lens images the target at high magnification. Sensitivity comes from $L_\mathrm{equiv}=f_1$, the propagation distance that turns an angular deflection into a transverse displacement at the cutoff; resolution comes from the numerical aperture of the imaging optics. This separation is what lets the authors reduce the cutoff's resolution penalty and reach roughly $4.6\,\mu\mathrm{m}$, and it is also what makes the brightness-to-deflection calibration meaningful. The quantitative chain is completed by the Gladstone-Dale relation $n-1=\kappa\rho$, which ties refractive index to gas density, and by Abel inversion for the axisymmetric jet, which removes the line-of-sight integration of Eq. (1).
What would settle it
Image the same blade-induced shock from two orthogonal viewing directions (by rotating the blade stage or camera) and compare the reconstructed density profiles; if the fitted $D$ or peak density shifts by more than the stated error bars, the line-of-sight symmetry assumption is violated and the quantitative shock-profile claims fail.
Extended reading notes
Core claim
The central claim is that the tension between sensitivity and resolution in Schlieren imaging is not fundamental: by placing the knife-blade cutoff at the focal point of the first relay lens and the magnifying objective after it, the deflection displacement $\Delta y = f_1\epsilon_y$ is set solely by the relay focal length, while resolution is set by the objective aperture. The paper reports an optical resolution of about $4.6\,\mu\mathrm{m}$ with a blade cutoff, compared to about $17.5\,\mu\mathrm{m}$ with a rainbow filter, in the same system. Quantitatively, the brightness change at the blade encodes the deflection angle through a lens-based calibration, the Gladstone-Dale relation turns deflection into density gradient, and Abel inversion converts the path-integrated signal into a radial profile for the axisymmetric jet. The reconstructed centerline density gradient agrees with a 3D Reynolds-averaged Navier-Stokes CFD simulation, including the position of the first normal shock and the second shock diamond. For the blade-induced shock, the authors fit density slices to the AnaBHEL form $\rho(x)=n_0(1+a e^{-x/D})^2$ and obtain $D\approx65.3\,\mu\mathrm{m}$, showing that the profile family needed for the flying-mirror analog is approximately present in blade-generated shocks.
Load-bearing premise
The density numbers assume the gas distribution is symmetric or uniform along the camera's line of sight; for the circular jet this is handled by Abel inversion, but for the three-dimensional blade-induced shock the paper does not state how the path-integrated deflection is unfolded into a local density profile.
Editorial extensions
If this is right
- Shock diamonds, barrel shocks, and blade-induced shock fronts in sub-millimeter jets can be captured with micrometer-level detail in a single-pass, non-intrusive optical setup.
- The same system yields calibrated density-gradient profiles, so peak density, plateau length, and shock thickness can be read directly from images rather than inferred from simulations.
- Blade-induced shocks produce density profiles close to $\rho(x)=n_0(1+a e^{-x/D})^2$, and the fitted $D$ map provides a recipe for choosing blade coverage and height in laser-plasma targets.
- Because sensitivity and resolution are independently adjustable, switching to higher-numerical-aperture imaging optics can push resolution below $4.6\,\mu\mathrm{m}$ without changing the cutoff geometry.
Reading between the lines
- If the decoupling is as general as it appears, the same relay-lens-cutoff plus imaging-objective layout should work with shorter-wavelength illumination or higher-NA relay optics, pushing quantitative Schlieren below the micron scale without losing calibration stability.
- The blade-shock density values rest on an unstated line-of-sight assumption; until a multi-angle or tomographic check is done, the reported $D$ values should be treated as order-of-magnitude, not final, and a 90-degree rotation test would reveal the bias.
- The validation against CFD is performed on the jet centerline; comparing off-axis density-gradient profiles would be a stronger test of both the Abel inversion and the turbulence model.
- With pulsed illumination, the configuration could become a single-shot diagnostic for non-repetitive or evolving shocks, since the sensitivity/resolution decoupling removes one constraint on exposure time.
Editorial analysis
A structured set of objections, weighed in public.
Referee Report
Summary. This paper presents a single-pass quantitative Schlieren imaging system that combines a blade cutoff with relay optics and a microscope objective to reach an optical resolution of about 4.6 µm. The authors calibrate the brightness-to-deflection response with a lens of known focal length, measure resolution with a USAF 1951 target, image under-expanded argon jets from a 500 µm nozzle, and validate the axial density gradient of an axisymmetric jet against ANSYS Fluent CFD after Abel inversion. They also measure shock-wave angles and density profiles for blade-induced shocks in vacuum, fit the AnaBHEL one-plus-exponential profile, and report D ≈ 65.3 µm.
Significance. The system is potentially useful: 4.6 µm resolution in a single-pass Schlieren setup, a non-circular calibration procedure using a lens of known focal length, and an independent CFD comparison for the axisymmetric case are solid technical contributions. The application-oriented extraction of density-profile parameters for laser-plasma targets gives the work practical relevance, and the use of the open-source pyAbel library aids reproducibility. The significance, however, depends on whether the blade-shock density profiles are true local profiles rather than line-of-sight-integrated projections; the missing deconvolution for Section 4.3 and the missing argon Gladstone–Dale constant are the key gaps.
major comments (3)
- [Section 4.3, Eq. (1), Figs. 12-13] The blade-induced shock profiles are presented as local density profiles, but no deconvolution of the line-of-sight integral in Eq. (1) is described. The flow is three-dimensional and non-axisymmetric, so the Abel inversion used in Section 4.2 is not applicable; the 'reconstructed density gradient map' in Fig. 12(a) and the profiles in Figs. 12(b) and 13(a) therefore have an unspecified status. The Conclusions acknowledge this averaging and defer it to future 3D tomography, so the quantitative claims for peak density, plateau length, shock thickness, and D ≈ 65.3 µm in Section 4.3 are not currently supported. Please either provide a tomographic or model-based deconvolution, or explicitly label these results as line-of-sight-integrated projections and remove or heavily qualify the local quantitative claims.
- [Sections 2.1 and 3.4] The quantitative density reconstruction uses Eq. (2) (Gladstone–Dale), but the only value quoted is κ ≈ 2.38 × 10^-4 m^3/kg for air, while the target is 5N argon. No Gladstone–Dale constant for argon is given, nor is the ambient refractive index n0 specified. Because the reported density gradients and the fitted D all scale with κ, the quantitative results are not reproducible and may carry a systematic offset. Please state the argon Gladstone–Dale constant used, including its wavelength dependence and uncertainty, and confirm the value of n0.
- [Abstract and Section 3.2] The claim that the modified setup 'decouples sensitivity from resolution, enabling independent optimization' is stronger than the evidence. Section 3.2 itself notes that the two are not completely decoupled near the diffraction limit, and the comparison of setup #1 and setup #2 shows a trade-off (setup #2 is five times less sensitive). In setup #1, the relay lens of focal length f1 simultaneously sets the sensitivity and, through its numerical aperture, limits the achievable resolution. Please qualify the decoupling claim and, if possible, show a measurement at two different sensitivity settings with unchanged resolution, or vice versa.
minor comments (5)
- [Eq. (1)] The sentence immediately after Eq. (1), 'An analogous expression applies for deflections in the y-direction,' should presumably refer to the z-direction.
- [Section 4.2 and Fig. 9] 'Data with z < 0.25µm is not shown' is likely a unit error; the nozzle radius is 250 µm, so the excluded region should be z < 0.25 mm.
- [Section 3.2] There is an unresolved cross-reference 'cf. Eq. (??)' in the sentence defining Lequiv; please fix the equation number.
- [Figure 12] Panel (a) is labeled 'reconstructed density gradient map' but the reconstruction method is not stated in the text; if the map is the calibrated integrated deflection, the label should say so.
- [References] The reference formatting is inconsistent, with journal names sometimes lowercased and abbreviations applied without a uniform style; please apply a consistent reference format.
Circularity Check
No significant circularity: calibration, resolution testing, and CFD validation are independent of the paper's own claims.
full rationale
The paper's derivation chain contains no step where a claimed prediction reduces to its own inputs by construction. The optical resolution of approximately 4.6 µm is determined with a standard USAF 1951 resolution target (Section 4.1), an external benchmark independent of the Schlieren signal model. The brightness-to-deflection calibration in Section 3.3 uses a lens of known focal length with deflection angle ϵr = r/f, so the calibration constant is fixed by geometry rather than fitted from the jet measurements. The quantitative density-gradient validation in Section 4.2 compares an Abel-inverted Schlieren profile (using the external pyAbel library) against an ANSYS Fluent CFD simulation; neither the simulation nor the Abel transform is derived from the measured data. The AnaBHEL-motivated profile fit in Section 4.3, yielding D ≈ 65.3 µm, is explicitly a fit to the measured density profile and is not fed back into any calibration constant or reconstruction parameter. The self-citations to Chen and Mourou provide the target functional form ρ(x) = n0(1 + ae−x/D)2, but the paper does not claim to derive that form from first principles; it merely uses it as a fitting model. The acknowledged line-of-sight averaging in Section 5 is a real correctness limitation for the three-dimensional blade-shock geometry, but it concerns whether the reported local profiles are unbiased, not whether any result is equivalent to its inputs. No fitted parameter is renamed as a prediction, and no load-bearing argument rests on an unverified self-citation. Therefore the appropriate circularity score is 0.
Assumptions & free parameters
free parameters (1)
- D (density decay length in AnaBHEL profile fit) =
65.3 µm at z=0.4 mm from blade tip (Fig. 13a)
assumptions (4)
- domain assumption Gladstone-Dale relation with a constant kappa converts refractive index to density (Eq. 2).
- domain assumption The jet is axisymmetric so the Abel inversion is valid.
- domain assumption The blade-induced shock density profile can be extracted from the line-of-sight integrated signal without explicit deconvolution.
- domain assumption ANSYS Fluent RANS simulation with 5 micrometer cells is an accurate benchmark.
Cite this review
Pith. "Pith review of Characterization of Supersonic Jet and Shock Wave with High-Resolution Quantitative Schlieren Imaging." pith.science (2026). https://pith.science/paper/M4MCAKDK
@misc{pith2026241114069,
  author       = {Pith},
  title        = {Pith review of: Characterization of Supersonic Jet and Shock Wave with High-Resolution Quantitative Schlieren Imaging},
  year         = {2026},
  howpublished = {\url{https://pith.science/paper/M4MCAKDK}},
  note         = {Machine review of arXiv:2411.14069}
}
read the original abstract
This paper presents an enhanced optical configuration for a single-pass quantitative Schlieren imaging system that achieves an optical resolution of approximately 4.6 micrometers. The modified setup decouples sensitivity from resolution, enabling independent optimization of these critical parameters. Using this high-resolution system, we conduct quantitative analyses of supersonic jets emitted from sub-millimeter nozzles into the atmosphere and investigate shock waves induced by knife blades interacting with these jets in a vacuum environment. The fine resolution allows for detailed visualization of shock wave structures and accurate measurement of density gradients. We demonstrate the system's effectiveness by examining the density gradient profile along the shock diamonds and mapping density profiles across shock waves. These density profiles are analyzed for their relevance in laser-plasma applications, including laser wakefield acceleration and the Analog Black Hole Evaporation via Laser (AnaBHEL) experiment. Our findings indicate that this system can help determine key parameters such as peak density, plateau length, and shock wave thickness-essential for optimizing electron acceleration and achieving specific plasma density profiles. This high-resolution quantitative Schlieren imaging technique thus serves as a valuable tool for exploring complex fluid dynamics and supporting advancements in laser-plasma physics research.
Figures


Figures from the paper (8 more)


Forward citations
Cited by 1 Pith paper
-
Plasma wakefield: from accelerators to black holes
A Chandrasekhar-prize review of plasma wakefield acceleration that embeds a new magnetized-plasma positron scheme and proposes AnaBHEL, an experiment to detect analog Hawking radiation from accelerating plasma mirrors.
Reference graph
Works this paper leans on
-
[1]
Adelmann, A., Hermann, B., Ischebeck, R., Kaluza, M. C., Locans, U., Sauerwein, N. and Tarkeshian, R. (2018). Applied Sciences 8(3):
work page 2018
- [267]
-
[443]
Bulanov, S., Naumova, N., Pegoraro, F. and Sakai, J. (1998). Particle injection into the wave accelera- tion phase due to nonlinear wake wave breaking, Physical Review E 58(5): R5257. Chen, P., Dawson, J. M., Huff, R. W. and Katsouleas, T. (1985). Physical review letters 54(7):
work page 1998
-
[693]
Chen, P. and Mourou, G. (2017). Accelerating plasma mirrors to investigate the black hole in- formation loss paradox, Physical review letters 118(4): 045001. Chen, P. and Mourou, G. (2020). Trajectory of a fly- ing plasma mirror traversing a target with den- sity gradient, Physics of Plasmas 27(12). Chen, P., Mourou, G., Besancon, M., Fukuda, Y., Glicenst...
work page 2017
-
[1003]
P., K¨ ohler, A., Wolterink, T., Jochmann, A., Zarini, O., Bastiaens, H., Boller, K., Irman, A
Couperus, J. P., K¨ ohler, A., Wolterink, T., Jochmann, A., Zarini, O., Bastiaens, H., Boller, K., Irman, A. and Schramm, U. (2016). NIM-A 830: 504–509. Dribinski, V., Ossadtchi, A., Mandelshtam, V. A. and Reisler, H. (2002). Reconstruction of Abel- transformable images: The Gaussian basis-set expansion Abel transform method, Review of Scientific Instrume...
work page 2016
-
[1812]
Mariani, R., Lim, H. D., Zang, B., Vevek, U. S., New, T. H. and Cui, Y. D. (2020). Journal of Visual- ization 23(3): 383–393. Mariani, R., Zang, B., Lim, H., Vevek, U., New, T. and Cui, Y. (2019). Flow Measurement and In- strumentation 66: 218–228. Schmid, K., Buck, A., Sears, C. M., Mikhailova, J. M., Tautz, R., Herrmann, D., Geissler, M., Krausz, . f. F...
work page 2020
Reviewed August 12, 2026 · model on record in the stance chip above.
Discussion (0). Continue with ORCID to comment.