REVIEW 3 major objections 5 minor 33 references
Determining the absolute chemical abundance of nitrogen and sulfur in the quasar outflow of 3C298
T0 review · 3 major / 5 minor · reviewed 2026-08-12 · deepseek-v4-flash
Pith's one-line read Nitrogen and sulfur in the 3C298 quasar outflow are roughly solar, with the spread set by the assumed ionizing spectrum.
desk verdict A competent new abundance measurement for the 3C298 outflow, but the 'solar within 60%' headline oversells what the paper's own three-SED spread actually shows. read the letter →
The pith
A machine-rendered reading of the paper's core claim, the machinery that carries it, and where it could break.
The reading
What carries the argument
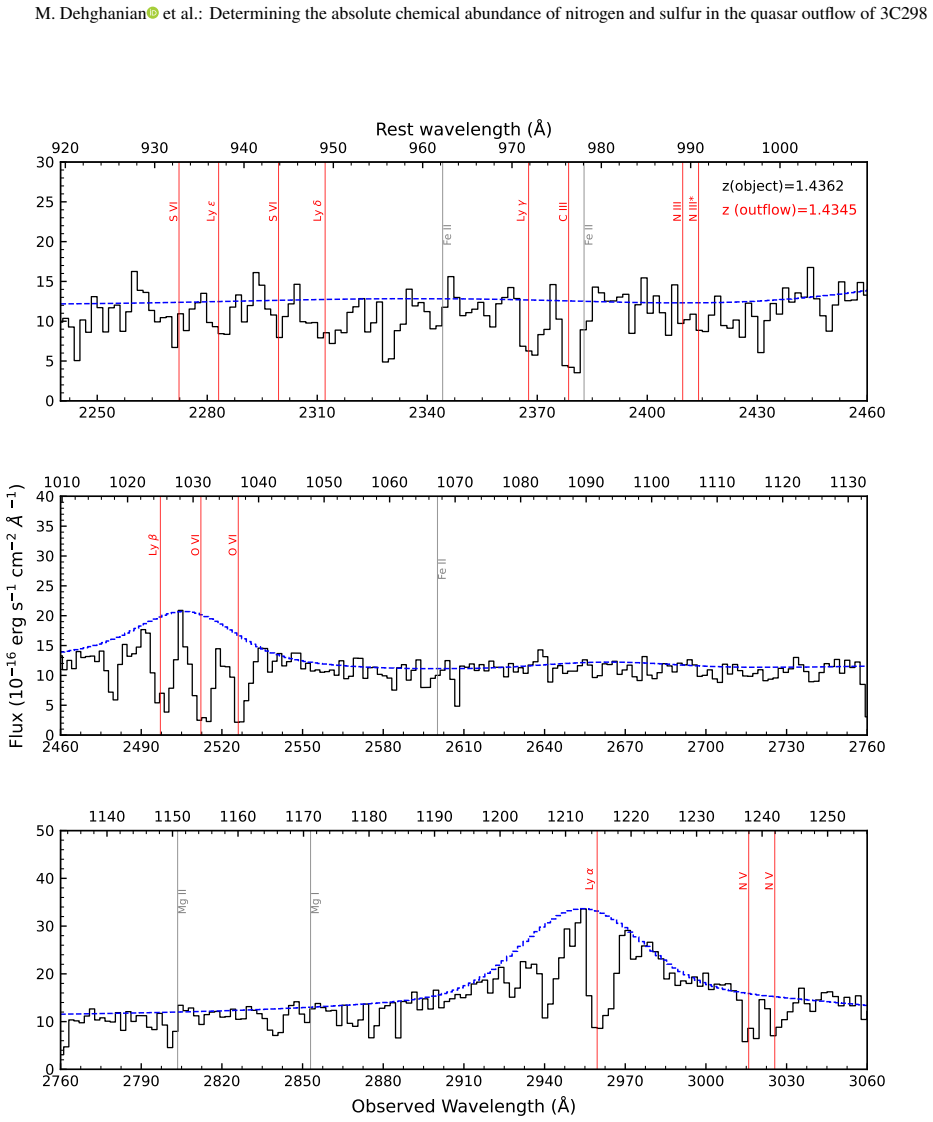
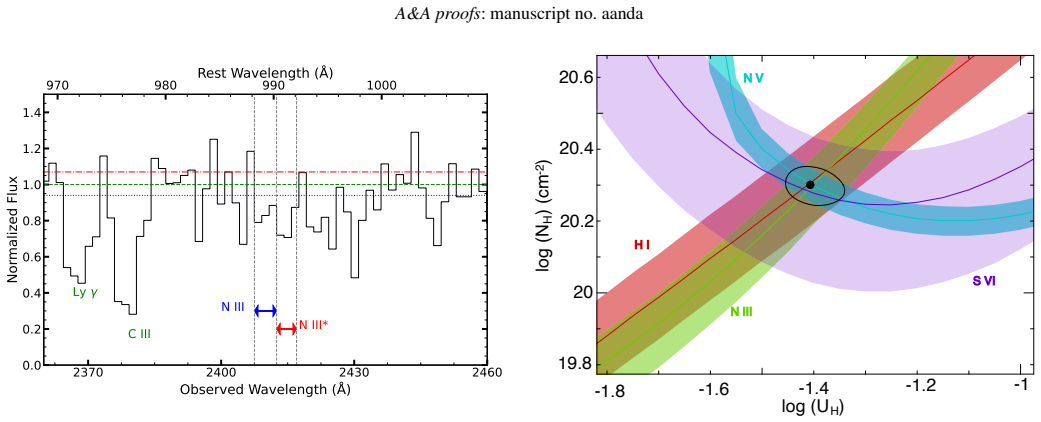
The argument runs on matching ionic column densities measured from unsaturated absorption troughs (N III, N III*, N V, S VI, and Ly-epsilon) against grids of photoionization models computed for three spectral energy distributions, the MF87, UV-soft, and HE0238 spectra; nitrogen and sulfur abundances are the free parameters that bring the predicted H I, N III, N V, and S VI columns into agreement. The electron density comes from a second, independent piece of machinery: the ratio of the excited to ground state of N III, computed with an atomic database at the photoionization-model temperature, which turns the column-density ratio into n_e and, through the ionization parameter, into a distance.
What would settle it
Take a spectrum, or SED reconstruction, of 3C298 that densely samples the extreme-ultraviolet ionizing continuum and rerun the same photoionization fits; if the resulting nitrogen and sulfur abundances fall outside 0.4 to 3 times solar, the bracketing assumption fails. A second check would measure an independent density diagnostic or a higher signal-to-noise N III*/N III ratio to confirm the log n_e >= 3.3 $cm^{-3}$ limit and the 2.8 kpc distance.
Extended reading notes
Core claim
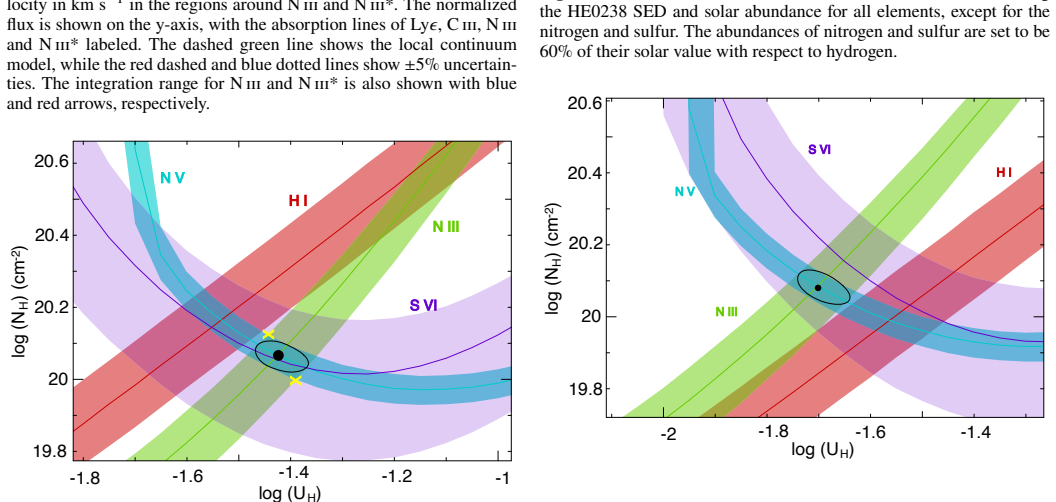
On the paper's own terms, the discovery is that the absolute nitrogen and sulfur abundances of the 3C298 outflow are consistent with solar values, with the full plausible range set by the choice of ionizing spectrum rather than by the absorption data themselves. With the HE0238 spectrum the abundances are about 0.6 times solar ([N/H] = -0.22); with the MF87 spectrum they are super-solar ([N/H] = +0.22 and [S/H] = +0.33); with the UV-soft spectrum they are essentially solar ([N/H] = +0.06 and [S/H] = +0.03). The measured N III*/N III column-density ratio gives an electron density of log n_e = 4.2 $cm^{-3}$ nominally, with a secure lower limit of log n_e >= 3.3 $cm^{-3}$, locating the outflow at about 1.05 kpc and at most 2.8 kpc from the AGN.
Load-bearing premise
The load-bearing premise is that the true ionizing spectrum of 3C298 is bracketed by the three adopted spectra; if the real extreme-ultraviolet continuum falls outside that range, the derived nitrogen and sulfur abundances could lie outside the reported 0.4 to 3 solar span.
Editorial extensions
If this is right
- If the abundances are indeed within 60 percent of solar, the 3C298 outflow is not a strongly metal-enriched wind, in contrast to several previously studied outflows with super-solar nitrogen and carbon abundances.
- The SED choice changes the derived abundances by a factor of several, so abundance results for quasar outflows should quote a systematic range across plausible ionizing spectra, not a single value.
- The electron density lower limit and maximum distance of 2.8 kpc place the outflow inside the host galaxy rather than in the circumgalactic medium, informing where outflow feedback deposits metals and energy.
- Because lower abundances imply lower total hydrogen column density for the same ionic columns, and kinetic luminosity scales with hydrogen column, a solar or sub-solar abundance reduces the estimated kinetic energy of this outflow.
- Across the three SEDs, nitrogen and sulfur track each other, so the outflow appears to have no strong nitrogen-to-sulfur enhancement relative to the Sun.
Reading between the lines
- Beyond the paper: if SED uncertainty is a factor-of-several effect here, abundance measurements of other quasar outflows that assume a single SED likely carry a hidden systematic of similar size.
- Beyond the paper: the sub-solar solution obtained with the most empirically grounded EUV spectrum, combined with the radio-loud nature of 3C298, is consistent with the emerging pattern that radio-loud AGN environments are less enriched than radio-quiet ones; a larger narrow-absorption-line sample split by radio loudness could test this directly.
- Beyond the paper: the N III*/N III ratio could be sharpened with higher signal-to-noise data or corroborated with other excited-state diagnostics such as Si II* or C II*, turning the density lower limit into a measurement and shrinking the allowed distance range.
- Beyond the paper: the implication that lower abundance lowers kinetic luminosity means that feedback energetics for 3C298 would be weaker under the HE0238 spectrum than under MF87; comparing energetics across SEDs would quantify how much feedback conclusions depend on metallicity assumptions.
Editorial analysis
A structured set of objections, weighed in public.
Referee Report
Summary. This paper analyzes archival HST/FOS spectroscopy of the narrow absorption line (NAL) outflow in quasar 3C298 (z=1.4362). The authors measure ionic column densities for Ly epsilon, N iii, N iii*, N v, and S vi using the apparent optical depth and partial covering methods, including systematic continuum uncertainties. They then run Cloudy photoionization models with three different SEDs (HE0238, MF87, UV-soft) to derive the absolute nitrogen and sulfur abundances relative to hydrogen, obtaining values that range from about 0.4 to 3 times solar depending on the adopted SED. Using Chianti, they derive an electron density log(n_e) >= 3.3 cm^-3 from the N iii*/N iii ratio, and combine it with the ionization parameter to place the outflow at a distance of about 1.0-2.8 kpc. The paper concludes that the outflow has solar metallicity within a 60% uncertainty, with the spread driven by SED choice.
Significance. If the result holds, the paper would provide a rare absolute abundance measurement of nitrogen and sulfur in a quasar NAL outflow and would offer a clear demonstration of how SED choice affects abundance determinations. The column density measurements are standard and include reasonable systematic error treatments, and the use of three SEDs to explore systematic uncertainty is a positive feature. However, the headline claim of 'solar metallicity within a 60% uncertainty' is not supported by the paper's own abundance ranges, and the assumption that the three adopted SEDs bracket the true ionizing continuum is not validated. The underlying measurement and the 0.4-3 times solar range are useful, but the central precision claim needs substantial reframing or additional analysis.
major comments (3)
- [Abstract and Section 4, item 4] The abstract and conclusions state 'solar metallicity within a 60 percent uncertainty range,' but this is inconsistent with the abundance results presented in Section 3.2 and Table 3. The three SEDs give point estimates of [N/H] = -0.22, +0.06, +0.22 and [S/H] = -0.22, +0.03, +0.33, which in linear units span roughly 0.6-1.7 times solar for nitrogen and 0.6-2.2 times solar for sulfur; the paper's own abstract cites a combined spread of 0.4-3 times solar. A spread that covers a factor of about 7 in linear abundance cannot be honestly summarized as a 60% uncertainty. The conclusion should be reframed to state that the abundances are consistent with solar within a factor of roughly 3, with SED choice dominating the uncertainty.
- [Section 3.2, Figure 4] The central abundance result assumes that the three adopted SEDs (MF87, UV-soft, HE0238) bracket the true ionizing SED of 3C298. This is not established. The 3C298-specific SED from Punsly et al. (2022) is excluded because it has limited data points in the ionizing region, but the only quantitative comparison given is a 0.1 dex difference at log nu ~ 15.7 Hz. That single point does not constrain the EUV spectral shape that sets the ionization balance and therefore the derived abundances. Since the abundance shifts by about a factor of three across the three adopted templates, I request a Cloudy run with the Punsly SED (or a small set of harder/softer EUV slopes) to show that the derived N and S abundances remain within the quoted 0.4-3 solar range; otherwise the range should be presented as a lower bound on the systematic uncertainty rather than a bracketed estimate.
- [Section 3.2.1 (HE0238 SED)] The sulfur abundance for the HE0238 SED is not derived from an independent fit to the S VI contour. The text states that 'since the contour of S VI nearly coincides with the crossing point of the N III and N V lines, we can estimate that its abundances have to be adjusted by the same value' as nitrogen. This is a load-bearing simplification for the [S/H] result. The same assumption is implicitly used in the MF87 and UV-soft analyses, where the S abundance is obtained by multiplying the nitrogen scaling by a 'S relative to N' factor (Sections 3.2.2 and 3.2.3). I ask the authors to quantify the uncertainty from the non-coincidence of the S VI contour with the N III/N V crossing, or to perform a joint fit that varies N and S abundances independently and report the resulting confidence intervals.
minor comments (5)
- [Section 3.2.2 and Figure 4] The heading in Section 3.2.2 reads 'M87 SED' while the text and Figure 4 use 'MF87' (Mathews & Ferland 1987). Please make this consistent.
- [Abstract and Section 3.2.3] The abstract uses 'UVsoft' while the body uses 'UV-soft.' Please standardize the notation.
- [Figure 10 caption] The caption contains the phrase 'the The 174.4 cm^-1 transition'; this is a typo and should read 'The 174.4 cm^-1 transition.'
- [Appendix B] In the error propagation for the N iii*/N iii ratio, the listed lower uncertainty for log N iii* is -0.16, but the calculation uses -0.17, and the quadrature for the lower uncertainty includes 0.18 which is not listed in the table. Please reconcile the numerical values used in the formula with the table entries.
- [Section 3.3, Equation (5)] The distance estimate depends on Q_H calculated by scaling the UV-soft SED to the continuum flux at 2650 A. Given the SED sensitivity discussed in Section 3.2, it would be useful to state how Q_H and the derived distance would change if a different SED were used for the scaling.
Circularity Check
No significant circularity: the N and S abundances are fitted to independent observed H I and heavy-ion column densities, not predicted from the fit; the three-SED spread is an input assumption, and the density/distance estimates use independent atomic data.
full rationale
The derivation chain is self-contained. Measured ionic column densities (Table 1) are compared with Cloudy grids for three published SEDs (Section 3.2). For each SED, the N and S abundances are adjusted until the model reproduces the observed H I (via Ly-epsilon), N III, N V, and S VI column densities; the abundance values are therefore fitted outputs, not predictions, and they are constrained by an independent observable (H I) rather than by definition. The paper does not rename an input as a prediction, nor does it invoke a self-citation as a uniqueness theorem. Citations to previous work by Arav and co-authors (Arav et al. 2013 for the HE0238 and UV-soft SEDs; Byun, Walker, and Dehghanian et al. for methodology) are routine methodology citations; the methods are standard Cloudy and Chianti calculations, and the relevant equations are reproduced in the text. The electron number density from the N III*/N III ratio uses the independent Chianti atomic database, and the distance estimate follows from the standard definition of U_H and an independently scaled Q_H. One non-circular caveat: the abstract's '60% uncertainty' claim is not well supported by the paper's own 0.4-3 times solar spread across SEDs, but that is an internal-consistency/correctness concern, not a circularity. No circular step can be identified by quoting the text.
Assumptions & free parameters
free parameters (2)
- Nitrogen abundance scaling relative to solar =
0.60 (HE0238), 1.66 (MF87), 1.15 (UV-soft)
- Sulfur abundance scaling relative to solar =
0.60 (HE0238), 2.16 (MF87), 1.07 (UV-soft)
assumptions (5)
- domain assumption Cloudy photoionization code and Chianti atomic data accurately model the outflow plasma.
- domain assumption All elements other than nitrogen and sulfur have solar abundances.
- domain assumption The outflow fully covers the background source for the singlets used in the AOD method (Ly epsilon, N III, N III*, S VI red trough).
- ad hoc to paper The three adopted SEDs (MF87, UV-soft, HE0238) bracket the true ionizing SED of 3C298.
- domain assumption The electron density to hydrogen density relation ne = 1.2 nH and the Cloudy-predicted temperature T=16,000 K apply to the outflow.
Cite this review
Pith. "Pith review of Determining the absolute chemical abundance of nitrogen and sulfur in the quasar outflow of 3C298." pith.science (2026). https://pith.science/paper/EJVMSBNN
@misc{pith2026241114231,
  author       = {Pith},
  title        = {Pith review of: Determining the absolute chemical abundance of nitrogen and sulfur in the quasar outflow of 3C298},
  year         = {2026},
  howpublished = {\url{https://pith.science/paper/EJVMSBNN}},
  note         = {Machine review of arXiv:2411.14231}
}
read the original abstract
Context. Quasar outflows are key players in the feedback processes that influence the evolution of galaxies and the intergalactic medium. The chemical abundance of these outflows provides crucial insights into their origin and impact. Aims. To determine the absolute abundances of nitrogen and sulfur and the physical conditions of the outflow seen in quasar 3C298. Methods. We analyze archival spectral data from the Hubble Space Telescope (HST) for 3C298. We measure Ionic column densities from the absorption troughs and compare the results to photoionization predictions made by the Cloudy code for three different spectral energy distributions (SED), including MF87, UVsoft, and HE0238 SEDs. We also calculate the ionic column densities of excited and ground states of N iii to estimate the electron number density and location of the outflow using the Chianti atomic database. Results. The MF87, UVsoft, and HE0238 SEDs yield nitrogen and sulfur abundances at super-solar, solar, and sub-solar values, respectively, with a spread of 0.4 to 3 times solar. Additionally, we determined an electron number density of log(ne) greater than 3.3 cm-3, with the outflow possibly extending up to a maximum distance of 2.8 kpc. Conclusions. Our results indicate solar metallicity within a 60 percent uncertainty range, driven by variations in the chosen SED and photoionization models. This study underscores the importance of SEDs impact on determining chemical abundances in quasars outflows. These findings highlight the necessity of considering a wider range of possible abundances, spanning from sub solar to super solar values.
Figures


Figures from the paper (4 more)


Reference graph
Works this paper leans on
-
[13]
doi:10.48550/arXiv.astro-ph/9705048 Borguet B. C. J., Edmonds D., Arav N., Dunn J., Kriss G. A., 2012a, ApJ, 751,
-
[22]
doi:10.3847/1538-4365/ab05cf deDiego,J.A.,Binette,L.,Ogle,P.,etal.2007,A&A,467,L7.doi:10.1051/0004- 6361:20077081 de Kool M., Korista K. T., Arav N., 2002, ApJ, 580,
-
[27]
doi:10.1086/307073 Arav N., Becker R. H., Laurent-Muehleisen S. A., Gregg M. D., White R. L., Brotherton M. S., de Kool M., 1999b, ApJ, 524,
-
[52]
doi:10.3390/galaxies11020052 Reback J., McKinney W., jbrockmendel, Van den Bossche J., Augspurger T., Cloud P., Hawkins S., et al., 2021, zndo Savage B. D., Sembach K. R., 1991, ApJ, 379,
-
[54]
doi:10.1086/343107 Dunn,J.P.,Bautista,M.,Arav,N.,etal.2010,ApJ,709,611.doi:10.1088/0004- 637X/709/2/611 Fields, D. L., Mathur, S., Pogge, R. W., et al. 2005, ApJ, 634,
doi:10.1086/343107 2010
-
[62]
A., Murray N., Armus L., Boehle A., Cosens M., Larkin J
doi:10.1086/386542 Vayner A., Wright S. A., Murray N., Armus L., Boehle A., Cosens M., Larkin J. E., et al., 2021, ApJ, 919,
doi:10.1086/386542 2021
-
[69]
doi:10.1088/0004-637X/758/1/69 Byun D., Arav N., Walker A., 2022a, MNRAS, 516,
-
[90]
doi:10.1109/MCSE.2007.55 Itoh D., Misawa T., Horiuchi T., Aoki K., 2020, MNRAS, 499,
Show all 33 references
-
[100]
B., 2022b, MNRAS, 517,
doi:10.1093/mnras/stac2194 Byun D., Arav N., Hall P. B., 2022b, MNRAS, 517,
-
[105]
C., Guo F., 2018, ApJ, 857,
doi:10.3847/1538- 4357/ab164e Yuan F., Yoon D., Li Y.-P., Gan Z.-M., Ho L. C., Guo F., 2018, ApJ, 857,
2018 doi
-
[107]
doi:10.1088/0004-637X/751/2/107 Borguet, B. C. J., Edmonds, D., Arav, N., et al. 2012b, ApJ, 758,
-
[116]
2024, arXiv:2407.02115
doi:10.1086/379159 Villar-Martin, M., López Cobá, C., Cazzoli, S., et al. 2024, arXiv:2407.02115. doi:10.48550/arXiv.2407.02115 Virtanen P., Gommers R., Oliphant T. E., Haberland M., Reddy T., Cournapeau D.,BurovskiE.,etal.,2020,NatMe,17,261.doi:10.1038/s41592-019-0686-2 Walke...
-
[121]
doi:10.3847/1538-4357/aab8f8 Article number, page 9 of 11 A&A proofs: manuscript no. aanda Appendix A: Error determination in the abundances calculations: The black dot in Figure 6 suggests that in order to have a photoionization solution, Hi column density has to belog(𝑁Expec...
-
[122]
doi:10.3847/1538-4357/ac0f56 Vestergaard M., 2003, ApJ, 599,
2003 doi
-
[140]
A., Korista K
doi:10.1086/318244 Arav N., Kaastra J., Kriss G. A., Korista K. T., Gabel J., Proga D., 2005, ApJ, 620,
2005 doi
-
[143]
2023, Galaxies, 11,
doi:10.3847/1538-4357/aaec75 Punsly,B.,Groeneveld,C.,Hill,G.J.,etal.2022,AJ,163,194.doi:10.3847/1538- 3881/ac5a4e Marziani, P., Panda, S., Deconto Machado, A., et al. 2023, Galaxies, 11,
2022 doi
-
[149]
P., Del Zanna G., Young P
doi:10.1051/aas:1997368 Dere K. P., Del Zanna G., Young P. R., Landi E., Sutherland R. S., 2019, ApJS, 241,
2019 doi
-
[178]
R., Arav, N., & Kim, T.-S
doi:10.1086/345096 Gabel, J. R., Arav, N., & Kim, T.-S. 2006, ApJ, 646,
2006 doi
-
[179]
M., van Hoof, P
doi:10.1007/s10509-010-0288-z Gunasekera, C. M., van Hoof, P. A. M., Chatzikos, M., et al. 2023, Research Notes of the American Astronomical Society, 7,
2023 doi
- [245]
-
[246]
1996, HST Proposal, 6589 Hamann, F
doi:10.3847/2515- 5172/ad0e75 Hamann, F. 1996, HST Proposal, 6589 Hamann, F. 1998, ApJ, 500,
1996 doi
-
[456]
E., Ferland G
doi:10.1086/165843 Osterbrock D. E., Ferland G. J., 2006, agna.book Planck Collaboration, Aghanim, N., Akrami, Y., et al. 2020, A&A, 641, A6. doi:10.1051/0004-6361/201833910 Punsly, B., Marziani, P., Bennert, V. N., et al. 2018, ApJ, 869,
2006 doi
-
[566]
S., Becker R
doi:10.1086/307841 Arav N., Brotherton M. S., Becker R. H., Gregg M. D., White R. L., Price T., Hack W., 2001, ApJ, 546,
2001 doi
-
[665]
R., Korista, K
doi:10.1086/425560 Arav, N., Gabel, J. R., Korista, K. T., et al. 2007, ApJ, 658,
2007 doi
-
[742]
J., et al
doi:10.1086/505070 Grevesse, N., Asplund, M., Sauval, A. J., et al. 2010, Ap&SS, 328,
2010 doi
-
[798]
R., Millman K
doi:10.1086/305776 Harris C. R., Millman K. J., van der Walt S. J., Gommers R., Virtanen P., CournapeauD.,WieserE.,etal.,2020,Natur,585,357.doi:10.1038/s41586- 020-2649-2 He Z., Liu G., Wang T., et al. 2022, Science Advances, 8, eabk3291 Hunter J. D., 2007, CSE, 9,
2020 doi
-
[829]
doi:10.1086/511666 AravN.,BorguetB.,ChamberlainC.,EdmondsD.,DanforthC.,2013,MNRAS, 436,
2013 doi
-
[928]
2024, A&A, 689, A321
doi:10.1086/497121 Floris, A., Marziani, P., Panda, S., et al. 2024, A&A, 689, A321. doi:10.1051/0004-6361/202450458 GabelJ.R.,CrenshawD.M.,KraemerS.B.,BrandtW.N.,GeorgeI.M.,Hamann F. W., Kaiser M. E., et al., 2003, ApJ, 583,
2024 doi
- [1048]
-
[3094]
doi:10.1093/mnras/staa2793 Mathews, W. G. & Ferland, G. J. 1987, ApJ, 323,
1987 doi
-
[3286]
A., et al
doi:10.1093/mnras/stt1812 Arav, N., Xu, X., Kriss, G. A., et al. 2020, A&A, 633, A61. doi:10.1051/0004- 6361/201935342 AstropyCollaboration,RobitailleT.P.,TollerudE.J.,GreenfieldP.,Droettboom M., Bray E., Aldcroft T., et al., 2013, A&A, 558, A33. doi:10.1051/0004- 6361/2013220...
2020 doi
-
[3778]
doi:10.1093/mnras/stac2349 Xu X., Arav N., Miller T., Benn C., 2019, ApJ, 876,
2019 doi
-
[7825]
P., Landi E., Mason H
doi:10.1093/mnras/stad3695 Dere K. P., Landi E., Mason H. E., Monsignori Fossi B. C., Young P. R., 1997, A&AS, 125,
1997 doi
Reviewed August 12, 2026 · model on record in the stance chip above.
Discussion (0). Continue with ORCID to comment.