REVIEW 5 major objections 4 minor 71 references
A study of the star clusters' population in the giant molecular cloud G174+2.5
T0 review · 5 major / 4 minor · reviewed 2026-08-12 · deepseek-v4-flash
Pith's one-line read The fate of four young star clusters in G174+2.5 hinges on whether the whole parent cloud counts as part of the system: it is, and all four are bound.
desk verdict Solid region-specific cluster census with new UKIDSS/Gaia results, but the all-cloud boundness claim is dominated by gas self-gravity, not cluster properties. read the letter →
The pith
A machine-rendered reading of the paper's core claim, the machinery that carries it, and where it could break.
The reading
What carries the argument
The load-bearing mechanism is a two-component total-energy calculation: each cluster and its gas are treated as homogeneous gravitating spheres with coincident centers, and the total energy is $E = T_1 + \Omega_1 + T_2 + \Omega_2 - \Omega_{12}$, with the interaction potential $\Omega_{12}$. The gas masses entering this equation come from $^{12}$CO and $^{13}$CO maps converted to column density through LTE, using an isotopic ratio $R = 80$ and a fixed $[\mathrm{CO}]/[\mathrm{H}_2]$ abundance of $8 \cdot 10^{-5}$. Supporting machinery includes KDE surface-density maps to find clusters, UPMASK for membership probabilities, the Q-method for individual reddening, and Kroupa IMF extrapolation for cluster masses.
What would settle it
Recompute the gas mass in the same 18-arcmin region using dust continuum emission or another CO-independent tracer; if it comes out substantially below 21,560 solar masses, the negative total energies for clusters 10 and 11 would flip positive, and the paper's 'all bound' claim would fail.
Extended reading notes
Core claim
The paper's central claim is that the four studied clusters in G174+2.5 — S235 North-West, S235 A-B-C, S235 Central, and S235 East1+East2 — should be viewed as 'stars + gas' systems. The total energy of each system is negative when the whole 18-arcmin cloud, about 21,560 solar masses of molecular gas, is included, meaning all four are gravitationally bound; with only local gas, the energies of S235 North-West and S235 A-B-C become positive, meaning they would not be bound. The cluster star subsystems alone have positive total energies in every case. The paper interprets this as the gas providing the gravitational glue that currently holds the proto-clusters together.
Load-bearing premise
The binding conclusion rests on assuming that CO emission, a fixed CO-to-H2 ratio, and an 18-arcmin hand-selected region give the true gas mass gravitationally attached to the clusters.
Editorial extensions
If this is right
- If the whole-cloud gas mass is real, the four clusters are currently gravitationally bound and may retain more stars than the local-gas estimate would predict when the gas is removed.
- The star formation efficiencies of 0.04–0.17 fall inside the Milky Way range, with the lowest values in the two clusters likely formed by the expanding HII region.
- Previous identifications from 2MASS change with deeper UKIDSS data: S235 East1 and East2 appear as one object, and BDSB 71–73 are sub-clusters of S235 A-B-C that may later merge.
- The positive energies of the stellar subsystems alone imply that once the gas disperses, the clusters will lose a significant number of stars or dissolve entirely.
Reading between the lines
- Editorial inference: the same two-region test could be applied to other embedded clusters, since the 'bound versus unbound' answer in the literature may depend on the arbitrary choice of gas aperture.
- Editorial inference: a dust-based gas mass over the same area would test the fixed CO-to-H2 and isotope-ratio assumptions, because those scalings dominate the derived gas mass.
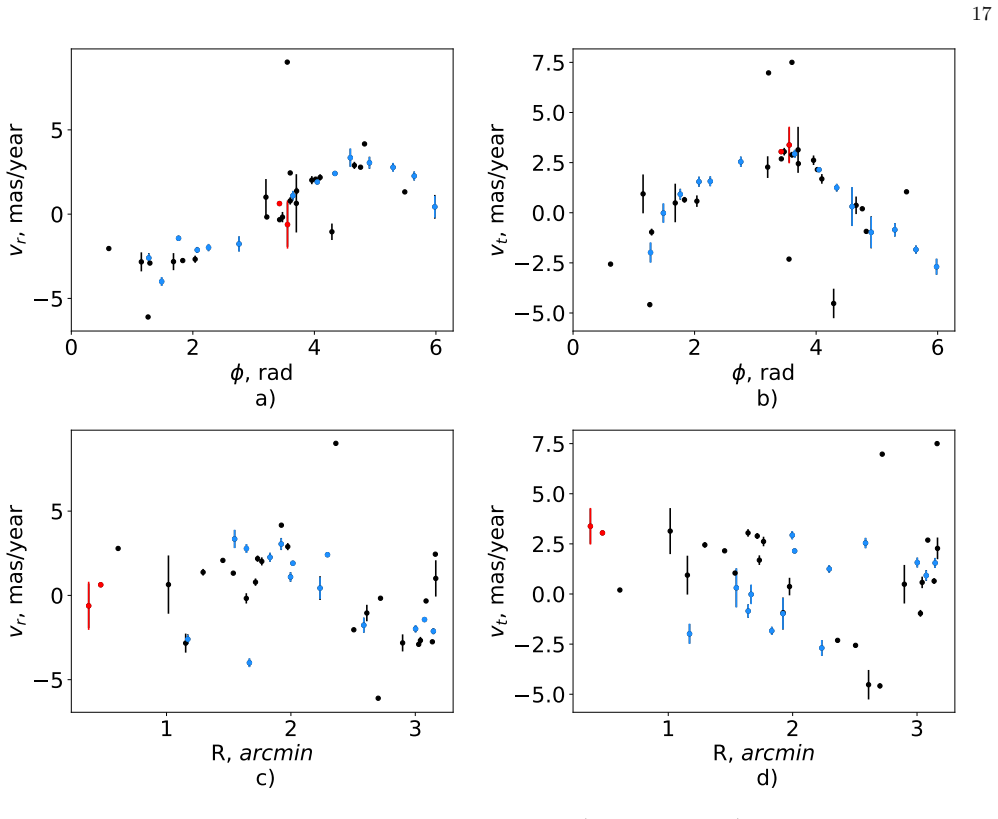
- Editorial inference: because the Gaia proper-motion dispersions are much larger than the gas dispersions, the clusters may be out of virial equilibrium; radial-velocity measurements would show whether the stars are actually expanding or falling.
Editorial analysis
A structured set of objections, weighed in public.
Referee Report
Summary. The paper presents a census of star clusters and cluster candidates in the giant molecular cloud G174+2.5 using UKIDSS Galactic Plane Survey photometry and Gaia DR3 astrometry. It identifies 14 stellar overdensities, six of which are proposed as previously unknown embedded cluster candidates, and carries out a detailed analysis of four clusters (S235 North-West, S235 A-B-C, S235 Central, S235 East1+East2). For these four clusters the authors derive reddening maps, membership probabilities with UPMASK, distances from isochrone fitting and Gaia parallaxes, proper motions, photometric and dynamical masses, gas masses from CO observations, star formation efficiencies, and estimates of the total energy of the stellar-plus-gas system. The central dynamical conclusion is that the clusters are gravitationally bound when the mass of the entire molecular cloud is included, while only two of them appear bound when only local gas is considered.
Significance. If the results hold, the paper provides a useful, deeper UKIDSS-based census of a relatively nearby star-forming complex and adds six new cluster candidates. The combination of extinction-corrected density maps, membership probabilities, Gaia proper motions, and externally anchored distance checks (Pleiades/Praesepe for the Q-method, Gaia parallaxes, and the maser parallax) is a methodological strength, and the authors are unusually transparent about several limitations. However, the headline boundness claim is not established on the evidence presented: the all-cloud total energies are dominated by the adopted gas sphere's self-gravity rather than by the interaction between the clusters and the gas. The dynamic mass estimates are also overestimated by orders of magnitude and are used in the energy budget, so the quantitative energy values in Table 5 must be treated with caution.
major comments (5)
- [Section 8, Eq. (17), Table 5] The abstract's claim that all four clusters are bound when the entire cloud is considered is not supported as a statement about the stellar clusters, because the negative E_allcloud values are dominated by the gas self-energy term -3GM2^2/(5R2) in Omega2. With M2 = 21560 M_sun and R2 = 9.7 pc (18 arcmin at 1.86 kpc), this term is approximately -1.2e5 in the units of Table 5, comparable to every E_allcloud entry (-5.5e4 to -1.07e5); if the cluster membership radius is used instead of 18 arcmin, the term is even more negative. Clusters 10 and 11 have positive E with local gas (+2.1e4 and +4.7e4) and become negative only after this same self-gravitating gas sphere is added to each system, so the sign change is nearly automatic for any object embedded in the adopted cloud model and does not measure the cluster's own binding.
- [Section 8, final paragraph] The paper acknowledges the spherical-symmetry and center-coincidence approximations but does not identify that the gas self-energy term in Eq. (17) dominates the computed total energy and makes the sign of E_allcloud largely independent of the cluster's own mass, radius, and kinematics. The authors should report the gas self-energy and the interaction term Omega12 separately, and should rephrase the conclusion to say that the stars-plus-gas system is bound under the adopted cloud model, not that the stellar clusters are bound.
- [Section 6.2, Eq. (3), Table 4] The dynamical masses are overestimated by factors of roughly one to three orders of magnitude relative to the photometric masses (e.g., 186000 M_sun versus 209 M_sun for cluster 10), and the authors note this in the text. Since the same velocity dispersions are then used in Eq. (14) for the kinetic energy T1 in Section 8, the quantitative total energies in Table 5 are systematically uncertain even though an overestimated T1 is conservative for the boundness sign; the paper should propagate this systematic uncertainty into the energy values or use an explicitly labeled upper limit.
- [Section 7, Eq. (12), Table 5] The gas masses, including the all-cloud mass of 21560 M_sun, are derived with a fixed [CO]/[H2] abundance ratio of 8e-5, a fixed isotope ratio R = 80, and a hand-selected 18-arcmin integration radius; this radius defines what the paper calls the 'entire cloud' and is load-bearing for E_allcloud. The authors should test the sensitivity of the boundness conclusion to the integration radius and to the conversion factors, and should show how E_allcloud changes if the gas mass is integrated over, say, twice or half the adopted radius.
- [Section 4.2, Table 2] The photometric distances are obtained by fitting isochrones to broad pre-main-sequence sequences by eye, and the quoted uncertainties are derived by shifting the sequences by color-index errors; this gives an incomplete description of the fitting uncertainty. Because the gas mass in Eq. (12) scales as the square of the adopted distance, the systematic distance error propagates directly into the gas mass and the total energy, and it should be quantified alongside the statistical errors.
minor comments (4)
- [Throughout] There are several typographical issues, such as 'North-W est' in Section 3 and 'T able' in the table captions; a careful proofreading pass is needed.
- [Section 6.2, Eq. (4)] The assumption that the radial-velocity dispersion equals the dispersion in one tangential direction, multiplied by 1.5, should be justified or relaxed, since it directly affects the dynamical masses and the kinetic energy term.
- [Section 7, SFE discussion] The star formation efficiencies quoted in Table 5 include only statistical errors; the systematic uncertainty from ionized gas not traced by CO and from the CO conversion factor is likely larger than the statistical errors and should be reflected in the reported SFE values.
- [Section 8] The word 'boundness' should be replaced with 'binding' or 'bound state' in several places, including the abstract and conclusions.
Circularity Check
Minor definitional dependency in all-cloud boundness; otherwise self-contained and externally anchored.
-
self definitional
[Abstract; Section 8, Eqs. 15-17 and Table 5]
"The gravitational bound strongly depends on the region for which we estimate the gas mass. If we consider the mass of the entire cloud, all these four clusters turn out to be bound. ... (here we consider a `cluster' as the system `stars + gas'). ... Ω2 = −3GM2^2/(5R2) − 3GM1M2/(2R2)(1 − R1^2/(5R2^2))."
The headline all-cloud boundness follows by construction from the adopted definition 'cluster = stars + gas', not from cluster properties. For M2=21560 Msun and R2≈9.7 pc, the gas self-gravity term −3GM2^2/(5R2) in Eq. 16 contributes about −1.2e5 in Table 5 units, comparable to or more negative than every E_allcloud value (−5.5e4 to −1.07e5). Clusters 10 and 11 are unbound with local gas only (+21100, +47300) and become bound solely after adding the same self-gravitating cloud mass to each system, making E<0 nearly automatic for any embedded object. The paper discloses this: it states the stars+gas definition, reports the local-gas alternative, and flags the spherical/coincident-center approximations.
full rationale
No significant circular derivation was found in the cluster parameters, distances, masses, kinematics, or SFE. Distances are anchored by Gaia DR3 parallaxes and agree with the Burns et al. (2015) maser parallax. The Q-method reddening sequence is built from Pleiades/Praesepe photometry with an external extinction law; its smaller CMD scatter is partly a self-consistency effect of dereddening onto the fitted sequence, but it is not a target prediction and the distances are independently checked. Gas masses come from LTE CO analysis with fixed abundance and isotope ratios and external references, not fitted to the boundness conclusion. The velocity-dispersion correction follows Kulesh et al. (2024), a co-authored self-citation, but the equations are reproduced in the text and the corrected dispersions enter only the small kinetic terms; the all-cloud energy is dominated by the gas self-energy. The paper explicitly acknowledges the spherical-symmetry and center-coincidence limitations and the dependence of the boundness result on the chosen gas region. The only noteworthy issue is the definitional character of the entire-cloud boundness claim described in the step above; because it is transparent and accompanied by the local-gas case, it warrants a low score rather than a charge of forced circularity.
Assumptions & free parameters
free parameters (4)
- Q-method zero-reddening sequence coefficients =
A2: 0.1573, 0.2338, 0.0157; A3: 0.0337, -0.4941, 0.3561
- Kroupa IMF normalization per cluster =
not quoted, per cluster in Section 6.1
- KDE kernel half-widths for velocity distributions =
manual, varied by coordinate
- Gas integration radius for whole cloud =
18 arcmin
assumptions (5)
- domain assumption The cluster and gas components can be treated as homogeneous, spherically symmetric spheres with coincident centers for energy calculations.
- domain assumption The radial velocity distribution equals the distribution in one tangential direction, allowing 3D dispersion from proper motions via Eq. 4.
- domain assumption Observed and error distributions are Gaussian, so the true dispersion is the quadrature difference of observed and error dispersions.
- domain assumption The CO-to-H2 abundance ratio is 8e-5 and the 12C/13C isotope ratio is R=80.
- domain assumption The Pleiades and Praesepe zero-reddening sequence in the Q-method is representative of the intrinsic colors of the young cluster stars in G174+2.5, including pre-main-sequence stars and YSOs.
Cite this review
Pith. "Pith review of A study of the star clusters' population in the giant molecular cloud G174+2.5." pith.science (2026). https://pith.science/paper/6EQ2VUL2
@misc{pith2026241114235,
  author       = {Pith},
  title        = {Pith review of: A study of the star clusters' population in the giant molecular cloud G174+2.5},
  year         = {2026},
  howpublished = {\url{https://pith.science/paper/6EQ2VUL2}},
  note         = {Machine review of arXiv:2411.14235}
}
read the original abstract
We study the structure, interstellar absorption, color-magnitude diagrams, kinematics, and dynamical state of embedded star clusters in the star-forming region associated with the giant molecular cloud G174+2.5. Our investigation is based on photometric data from the UKIDSS Galactic Plane Survey catalog and astrometric data from the Gaia DR3 catalogs. First, we recover all the known embedded clusters and candidate clusters in the region using surface density maps. Then, for the detected clusters, we determine their general parameters: the center positions, radii, number of stars, and reddening. To evaluate the reddening, we use both the NICEST algorithm and the Q-method. Both methods produce consistent extinction maps in the regions of the four studied clusters. However, the Q-method yields a much smaller color scatter in the CMD. For four clusters in particular (S235~North-West, S235~A-B-C, S235~Central, and S235~East1+East2), we were able to compute individual membership probabilities, the cluster distances, the cluster masses, and their average proper motions. By building on these results, we have studied the clusters' kinematics and dynamics. Moreover, we estimate the mass of the gas component and the star formation efficiency (SFE) in the regions of these four clusters. Finally, we provide an estimate of the total energy of the stellar and gas components in the area of these four clusters to determine whether the clusters are bound (here we consider a `cluster' as the system `stars + gas'). The gravitational bound strongly depends on the region for which we estimate the gas mass. If we consider the mass of the entire cloud, all these four clusters turn out to be bound.
Figures


Figures from the paper (13 more)




Reference graph
Works this paper leans on
- [1]
-
[2]
Allen, L. E., Hora, J. L., Megeath, S. T., et al. 2005, in Massive Star Birth: A Crossroads of Astrophysics, ed. R. Cesaroni, M. Felli, E. Churchwell, & M. Walmsley, Vol. 227, 352–357, doi: 10.1017/S1743921305004734 Andr´ e, P., Di Francesco, J., Ward-Thompson, D., et al. 2014, in Protostars and Planets VI, ed. H. Beuther, R. S
-
[3]
Klessen, C. P. Dullemond, & T. Henning, 27, doi: 10.2458/azu uapress 9780816531240-ch002
-
[4]
2011, A&A, 529, L6, doi: 10.1051/0004-6361/201116596 29
Arzoumanian, D., Andr´ e, P., Didelon, P., et al. 2011, A&A, 529, L6, doi: 10.1051/0004-6361/201116596 29
-
[5]
2002, A&A, 387, 931, doi: 10.1051/0004-6361:20020319
Beuther, H., Schilke, P., Gueth, F., et al. 2002, A&A, 387, 931, doi: 10.1051/0004-6361:20020319
-
[6]
Bica, E., Dutra, C. M., & Barbuy, B. 2003a, A&A, 397, 177, doi: 10.1051/0004-6361:20021479
-
[7]
Bica, E., Dutra, C. M., Soares, J., & Barbuy, B. 2003b, A&A, 404, 223, doi: 10.1051/0004-6361:20030486
-
[8]
Bieging, J. H., Patel, S., Peters, W. L., et al. 2016, ApJS, 226, 13, doi: 10.3847/0067-0049/226/1/13
Show all 71 references
-
[9]
A., Sobolev, A
Boley, P. A., Sobolev, A. M., Krushinsky, V. V., et al. 2009, MNRAS, 399, 778, doi: 10.1111/j.1365-2966.2009.15308.x
2009
-
[10]
2012, MNRAS, 427, 127, doi: 10.1111/j.1365-2966.2012.21948.x
Bressan, A., Marigo, P., Girardi, L., et al. 2012, MNRAS, 427, 127, doi: 10.1111/j.1365-2966.2012.21948.x
2012
-
[11]
2004, in Astronomical Society of the Pacific Conference Series, Vol
Brunt, C. 2004, in Astronomical Society of the Pacific Conference Series, Vol. 317, Milky Way Surveys: The Structure and Evolution of our Galaxy, ed. D. Clemens, R. Shah, & T. Brainerd, 79
2004
-
[12]
A., Imai, H., Handa, T., et al
Burns, R. A., Imai, H., Handa, T., et al. 2015, MNRAS, 453, 3163, doi: 10.1093/mnras/stv1836
2015 doi
-
[13]
A., Handa, T., Omodaka, T., et al
Burns, R. A., Handa, T., Omodaka, T., et al. 2019, PASJ, 71, 91, doi: 10.1093/pasj/psz074
2019 doi
-
[14]
2016, MNRAS, 455, 3126, doi: 10.1093/mnras/stv2517
Camargo, D., Bica, E., & Bonatto, C. 2016, MNRAS, 455, 3126, doi: 10.1093/mnras/stv2517
2016 doi
-
[16]
Campello, R. J. G. B., Moulavi, D., & Sander, J. 2013, in Advances in Knowledge Discovery and Data Mining, ed. J. Pei, V. S. Tseng, L. Cao, H. Motoda, & G. Xu (Berlin, Heidelberg: Springer Berlin Heidelberg), 160–172
2013
-
[17]
A., Clayton, G
Cardelli, J. A., Clayton, G. C., & Mathis, J. S. 1989, ApJ, 345, 245, doi: 10.1086/167900
1989 doi
-
[18]
A., Mathis, J
Cardelli, J. A., Mathis, J. S., Ebbets, D. C., & Savage, B. D. 1993, ApJL, 402, L17, doi: 10.1086/186689
1993 doi
-
[19]
2020, Boletin de la Asociacion Argentina de Astronomia La Plata Argentina, 61C, 11
Carraro, G. 2020, Boletin de la Asociacion Argentina de Astronomia La Plata Argentina, 61C, 11
2020
-
[20]
2007, A&A, 467, 777, doi: 10.1051/0004-6361:20066514 Chavarr ´ ıa, L., Allen, L., Brunt, C., et al
Casali, M., Adamson, A., Alves de Oliveira, C., et al. 2007, A&A, 467, 777, doi: 10.1051/0004-6361:20066514 Chavarr ´ ıa, L., Allen, L., Brunt, C., et al. 2014, MNRAS, 439, 3719, doi: 10.1093/mnras/stu224
2007 doi
-
[21]
2024, MNRAS, 527, 4297, doi: 10.1093/mnras/stad3459
Chen, E., Gao, Y., Zhang, S., et al. 2024, MNRAS, 527, 4297, doi: 10.1093/mnras/stad3459
2024 doi
-
[22]
Danilov, V. M. 1984, in Metody Astron.-Geod. Issled. (Sverdlovsk: UrSU), 94–117
1984
-
[23]
Danilov, V. M. 2024, Astrophysical Bulletin, 79, 71, doi: 10.1134/S1990341323600321
2024 doi
-
[24]
M., & Seleznev, A
Danilov, V. M., & Seleznev, A. F. 2020, Astrophysical Bulletin, 75, 407, doi: 10.1134/S1990341320040045
2020 doi
-
[25]
K., & Anandarao, B
Dewangan, L. K., & Anandarao, B. G. 2011, MNRAS, 414, 1526, doi: 10.1111/j.1365-2966.2011.18487.x
2011
-
[26]
K., Ojha, D
Dewangan, L. K., Ojha, D. K., Luna, A., et al. 2016, ApJ, 819, 66, doi: 10.3847/0004-637X/819/1/66
2016 doi
-
[27]
J., I., & Blair, G
Evans, N. J., I., & Blair, G. N. 1981, ApJ, 246, 394, doi: 10.1086/158937
1981 doi
-
[28]
Foster, T., & Brunt, C. M. 2015, AJ, 150, 147, doi: 10.1088/0004-6256/150/5/147
2015 doi
-
[29]
Froebrich, D., Scholz, A., & Raftery, C. L. 2007, MNRAS, 374, 399, doi: 10.1111/j.1365-2966.2006.11148.x Gaia Collaboration, Prusti, T., de Bruijne, J. H. J., et al. 2016, A&A, 595, A1, doi: 10.1051/0004-6361/201629272 Gaia Collaboration, Vallenari, A., Brown, A. G. A., et al....
2007
-
[30]
M., Georgelin, Y
Georgelin, Y. M., Georgelin, Y. P., & Roux, S. 1973, A&A, 25, 337
1973
-
[31]
G., Bally, J., Yan, C.-H., & Williams, J
Ginsburg, A. G., Bally, J., Yan, C.-H., & Williams, J. P. 2009, ApJ, 707, 310, doi: 10.1088/0004-637X/707/1/310
2009 doi
-
[33]
C., Warren, S
Hewett, P. C., Warren, S. J., Leggett, S. K., & Hodgkin, S. T. 2006, MNRAS, 367, 454, doi: 10.1111/j.1365-2966.2005.09969.x
2006
-
[35]
P., & Felli, M
Israel, F. P., & Felli, M. 1978, A&A, 63, 325
1978
- [36]
-
[37]
2012, AJ, 143, 75, doi: 10.1088/0004-6256/143/3/75
Kang, J.-h., Koo, B.-C., & Salter, C. 2012, AJ, 143, 75, doi: 10.1088/0004-6256/143/3/75
2012 doi
-
[38]
S., Salii, S
Kirsanova, M. S., Salii, S. V., Sobolev, A. M., et al. 2017, Open Astronomy, 26, 99, doi: 10.1515/astro-2017-0020
2017 doi
-
[40]
S., Wiebe, D
Kirsanova, M. S., Wiebe, D. S., Sobolev, A. M., Henkel, C., & Tsivilev, A. P. 2014, MNRAS, 437, 1593, doi: 10.1093/mnras/stt1991 K¨ onyves, V., Andr´ e, P., Men’shchikov, A., et al. 2015, A&A, 584, A91, doi: 10.1051/0004-6361/201525861
2014 doi
-
[41]
E., Glushkova, E
Koposov, S. E., Glushkova, E. V., & Zolotukhin, I. Y. 2008, A&A, 486, 771, doi: 10.1051/0004-6361:20078630
2008 doi
-
[42]
2014, A&A, 561, A57, doi: 10.1051/0004-6361/201321143
Krone-Martins, A., & Moitinho, A. 2014, A&A, 561, A57, doi: 10.1051/0004-6361/201321143
2014 doi
-
[43]
2001, MNRAS, 322, 231, doi: 10.1046/j.1365-8711.2001.04022.x
Kroupa, P. 2001, MNRAS, 322, 231, doi: 10.1046/j.1365-8711.2001.04022.x
2001
-
[44]
V., Samirkhanova, A
Kulesh, M. V., Samirkhanova, A. E., Carraro, G., et al. 2024, AJ, 167, 212, doi: 10.3847/1538-3881/ad32cc
2024 doi
-
[45]
Kumar, M. S. N., Keto, E., & Clerkin, E. 2006, A&A, 449, 1033, doi: 10.1051/0004-6361:20053104
2006 doi
-
[46]
J., & Lada, E
Lada, C. J., & Lada, E. A. 2003, ARA&A, 41, 57, doi: 10.1146/annurev.astro.41.011802.094844
2003 arXiv
-
[47]
Lada, E. A. 1992, ApJL, 393, L25, doi: 10.1086/186442 30
1992 doi
-
[48]
A., Kirsanova, M
Ladeyschikov, D. A., Kirsanova, M. S., Sobolev, A. M., et al. 2021, MNRAS, 506, 4447, doi: 10.1093/mnras/stab1821
2021 doi
-
[49]
Sobolev, A. M. 2016, Astrophysical Bulletin, 71, 208, doi: 10.1134/S1990341316020085
2016 doi
-
[50]
J., Almaini, O., et al
Lawrence, A., Warren, S. J., Almaini, O., et al. 2007, MNRAS, 379, 1599, doi: 10.1111/j.1365-2966.2007.12040.x
2007
-
[51]
L., & Silvotti, R
Lodieu, N., P´ erez-Garrido, A., Smart, R. L., & Silvotti, R. 2019, A&A, 628, A66, doi: 10.1051/0004-6361/201935533
2019 doi
-
[52]
2009, A&A, 493, 735, doi: 10.1051/0004-6361:200810519
Lombardi, M. 2009, A&A, 493, 735, doi: 10.1051/0004-6361:200810519
2009 doi
-
[53]
W., Hoare, M
Lucas, P. W., Hoare, M. G., Longmore, A., et al. 2008, MNRAS, 391, 136, doi: 10.1111/j.1365-2966.2008.13924.x
2008
- [54]
-
[55]
T., Gutermuth, R., Muzerolle, J., et al
Megeath, S. T., Gutermuth, R., Muzerolle, J., et al. 2016, AJ, 151, 5, doi: 10.3847/0004-6256/151/1/5 Men’shchikov, A. 2013, A&A, 560, A63, doi: 10.1051/0004-6361/201321885 M¨ uller, H. S. P., Thorwirth, S., Roth, D. A., &
2016 doi
-
[56]
2001, A&A, 370, L49, doi: 10.1051/0004-6361:20010367 O’Donnell, J
Winnewisser, G. 2001, A&A, 370, L49, doi: 10.1051/0004-6361:20010367 O’Donnell, J. E. 1994, ApJ, 422, 158, doi: 10.1086/173713
2001 doi
-
[57]
2011, Journal of Machine Learning Research, 12, 2825
Pedregosa, F., Varoquaux, G., Gramfort, A., et al. 2011, Journal of Machine Learning Research, 12, 2825
2011
-
[58]
2000, A&A, 361, 660
Porras, A., Cruz-Gonz´ alez, I., & Salas, L. 2000, A&A, 361, 660
2000
-
[59]
Ryu, J., & Lee, M. G. 2018, ApJ, 856, 152, doi: 10.3847/1538-4357/aab1ff
2018 doi
- [60]
-
[61]
D., & Sembach, K
Savage, B. D., & Sembach, K. R. 1996, ARA&A, 34, 279, doi: 10.1146/annurev.astro.34.1.279
1996 doi
-
[62]
Schisano, E., Rygl, K. L. J., Molinari, S., et al. 2014, ApJ, 791, 27, doi: 10.1088/0004-637X/791/1/27
2014 doi
-
[63]
Seleznev, A. F. 2016, MNRAS, 456, 3757, doi: 10.1093/mnras/stv2874
2016 doi
-
[64]
2017, MNRAS, 467, 2517, doi: 10.1093/mnras/stx177
Monaco, L., & Baume, G. 2017, MNRAS, 467, 2517, doi: 10.1093/mnras/stx177
2017 doi
-
[65]
2018, ApJ, 855, 45, doi: 10.3847/1538-4357/aaaccd
Shimoikura, T., Dobashi, K., Nakamura, F., Matsumoto, T., & Hirota, T. 2018, ApJ, 855, 45, doi: 10.3847/1538-4357/aaaccd
2018 doi
-
[66]
Silverman, B. W. 1986, Density estimation for statistics and data analysis
1986
-
[67]
Heyer, M. H. 2001, ApJ, 551, 747, doi: 10.1086/320230
2001 doi
-
[68]
F., Cutri, R
Skrutskie, M. F., Cutri, R. M., Stiening, R., et al. 2006, AJ, 131, 1163, doi: 10.1086/498708
2006 doi
-
[69]
Sobolev, A. M. 2017, in Astronomical Society of the Pacific Conference Series, Vol. 510, Stars: From Collapse to Collapse, ed. Y. Y. Balega, D. O. Kudryavtsev, I. I. Romanyuk, & I. A. Yakunin, 20
2017
-
[70]
J., Lauroesch, J
Sofia, U. J., Lauroesch, J. T., Meyer, D. M., & Cartledge, S. I. B. 2004, ApJ, 605, 272, doi: 10.1086/382592
2004 doi
-
[71]
2012, A&A, 542, A3, doi: 10.1051/0004-6361/201118531
Solin, O., Ukkonen, E., & Haikala, L. 2012, A&A, 542, A3, doi: 10.1051/0004-6361/201118531
2012 doi
-
[72]
2018, Astrophysics and Space Science
Stahler, S., ed. 2018, Astrophysics and Space Science
2018
-
[73]
424, The Birth of Star Clusters, doi: 10.1007/978-3-319-22801-3
Library, Vol. 424, The Birth of Star Clusters, doi: 10.1007/978-3-319-22801-3
-
[74]
Taylor, M. B. 2005, in Astronomical Society of the Pacific Conference Series, Vol. 347, Astronomical Data Analysis Software and Systems XIV, ed. P. Shopbell, M. Britton, & R. Ebert, 29
2005
-
[75]
W., Roellig, T
Werner, M. W., Roellig, T. L., Low, F. J., et al. 2004, ApJS, 154, 1, doi: 10.1086/422992
2004 doi
Reviewed August 12, 2026 · model on record in the stance chip above.
Discussion (0). Continue with ORCID to comment.