REVIEW 3 major objections 5 minor 1 cited by
LoRePIE: $\ell_0$ Regularised Extended Ptychographical Iterative Engine for Low-dose and Fast Electron Ptychography
T0 review · 3 major / 5 minor · reviewed 2026-08-12 · deepseek-v4-flash
Pith's one-line read The paper claims that adding an $\ell_0$ sparse-filter step to ePIE lets electron ptychography reconstruct Rotavirus particles with good quality at 56% overlap and useful images down to 30%.
desk verdict A clean, well-ablated l0-regularized ePIE variant that extends overlap robustness on one real dataset, but its quantitative validation rests on a self-generated reference and needs a synthetic ground-truth test. read the letter →
The pith
A machine-rendered reading of the paper's core claim, the machinery that carries it, and where it could break.
The reading
What carries the argument
The load-bearing device is the regularisation operator $D(u) = D_{\mathrm{amp}}(|u|) \odot \exp(i\,D_{\mathrm{phs}}(\angle u))$, applied to each updated object crop. $D_{\mathrm{amp}}$ and $D_{\mathrm{phs}}$ are $\ell_0$ denoisers: each transforms its input into an orthogonal basis (here the discrete cosine transform), applies a hard-thresholding operator $H_K$ that keeps only the $K$ largest-magnitude coefficients, and transforms back. This step is presented as the exact solution to a constrained minimisation problem asking for the amplitude and phase closest to the ePIE update subject to having at most $K_{\mathrm{amp}}$ and $K_{\mathrm{phs}}$ nonzero coefficients in the chosen basis, which is what enforces sparsity.
What would settle it
Simulate a 4-D STEM dataset from a synthetic object with known phase and amplitude, subsample probe positions to 56%, 42%, and 30% overlap, run LoRePIE and ePIE from identical initialisations, and measure SSIM and NRMSE against the true synthetic object; if LoRePIE's advantage does not survive comparison to ground truth, the central claim is not established.
Extended reading notes
Core claim
The central claim is that enforcing sparse representations of the reconstructed object's amplitude and phase inside each ePIE iteration makes ptychographic phase retrieval tolerant of much lower probe overlap than ePIE can tolerate. In the paper's experiments, LoRePIE consistently beats ePIE in SSIM, NRMSE, and PSNR at every down-sampling factor tested: ePIE fails for down-sampling factors above two (70% overlap), while LoRePIE gives a high-quality phase image at factor three (56% overlap) and qualitative images at factors four and five (42% and 30% overlap). The regulariser is applied to the object update as a denoising step, so the algorithm keeps the same iterative structure as ePIE with an extra thresholding operation per iteration.
Load-bearing premise
The reference that all quality scores are computed against is itself a reconstruction, obtained by running ePIE and Difference Map on the full 85%-overlap dataset, rather than a known true object, so the reported gains could partly reflect matching that reference's artifacts.
Editorial extensions
If this is right
- At 56% overlap, the simulated fluence is 2.5 e-/Ų versus 22.8 e-/Ų for the full 85%-overlap scan, so reaching this regime would cut electron dose roughly nine-fold while retaining quantitative phase quality.
- At 30% overlap (0.9 e-/Ų), LoRePIE phase images are still good enough for counting particles and measuring their sizes, enabling very low-dose screening of beam-sensitive specimens.
- Because the regulariser acts on the object update, the same construction transfers to near-field or Fresnel-regime ptychography, as the paper notes.
- The phase and amplitude regularisation parameters can be tuned separately, so a phase-only object can be recovered while enforcing a nearly constant amplitude.
Reading between the lines
- Beyond the paper, the decisive assumption is that the specimen is sparse in the chosen transform domain; smooth, quasi-periodic biological objects such as Rotavirus fit this, but crystalline or highly structured materials would likely need a different sparsifying basis.
- Since the reference used for scoring is itself a reconstruction, an independent test on a synthetic phantom with known ground truth would separate genuine denoising gains from matching the reference's artifacts.
- The three-step thresholding structure invites direct extension to wavelet bases, $\ell_1$ penalties, or plug-and-play priors, with the separate treatment of amplitude and phase providing a natural tuning knob for different object classes.
Editorial analysis
A structured set of objections, weighed in public.
Referee Report
Summary. The manuscript proposes LoRePIE, a variant of the extended ptychographical iterative engine (ePIE) that applies ℓ0 hard-thresholding denoising to the object amplitude and phase in a transform domain (DCT) at each iteration. The algorithm and its proximal interpretation (Eq. 8) are presented, and the authors evaluate it on a published experimental 4-D STEM dataset of Rotavirus particles, creating synthetic lower-overlap datasets by uniformly subsampling probe positions. The paper reports that LoRePIE consistently outperforms ePIE in NRMSE/SSIM/PSNR across overlap ratios from 85% down to 30%, and claims good visual quality at 56% overlap and useful qualitative information at 42% and 30% overlap.
Significance. If the performance claims hold, the paper would make a useful contribution to low-dose electron ptychography by extending the operable overlap range of a widely used algorithm through a simple, computationally cheap regularisation step. The derivation of the ℓ0 denoising step as the solution to a constrained proximal problem is clean, and the ablation studies in Section VII are unusually thorough, mapping sensitivity to Kphs, Kamp, αo, αp, and iteration count. The authors are also candid about the main limitation—the absence of ground truth—and explicitly call for synthetic dataset validation. The paper does not provide code or reproducible data, which limits immediate verification.
major comments (3)
- [Section IV, 'Reference data'] The quantitative evaluation underpinning the central claim is computed against a reference object that is itself a reconstruction (100 ePIE + 100 DM iterations on the same full dataset), not an independent ground truth, and the authors show in Fig. 2 that this reference contains periodic grid artifacts at the scan step (1/0.32 nm−1 = 3.125 nm). Because the reference is highly compressible in the DCT domain (Fig. 5: keeping 1% of DCT coefficients yields ~3.5% relative error), LoRePIE's DCT hard-thresholding is structurally favoured by NRMSE/SSIM comparisons against this reference, regardless of true object fidelity. The authors acknowledge this in Section IV: 'Visual inspection indicates that LoRePIE gives a slightly higher quality ... compared to the reference data, suggesting a need to further investigate the LoRePIE's performance using synthetic 4-D STEM datasets.' This means that the abstract's claim of 'high quality reconstruction' at 56% overlap and the numerical margins in Section VII-B are not yet validated against the true object. Please add a synthetic phantom experiment with known ground truth (and simulated noise) or an independently validated reference, and report the key metrics against that ground truth.
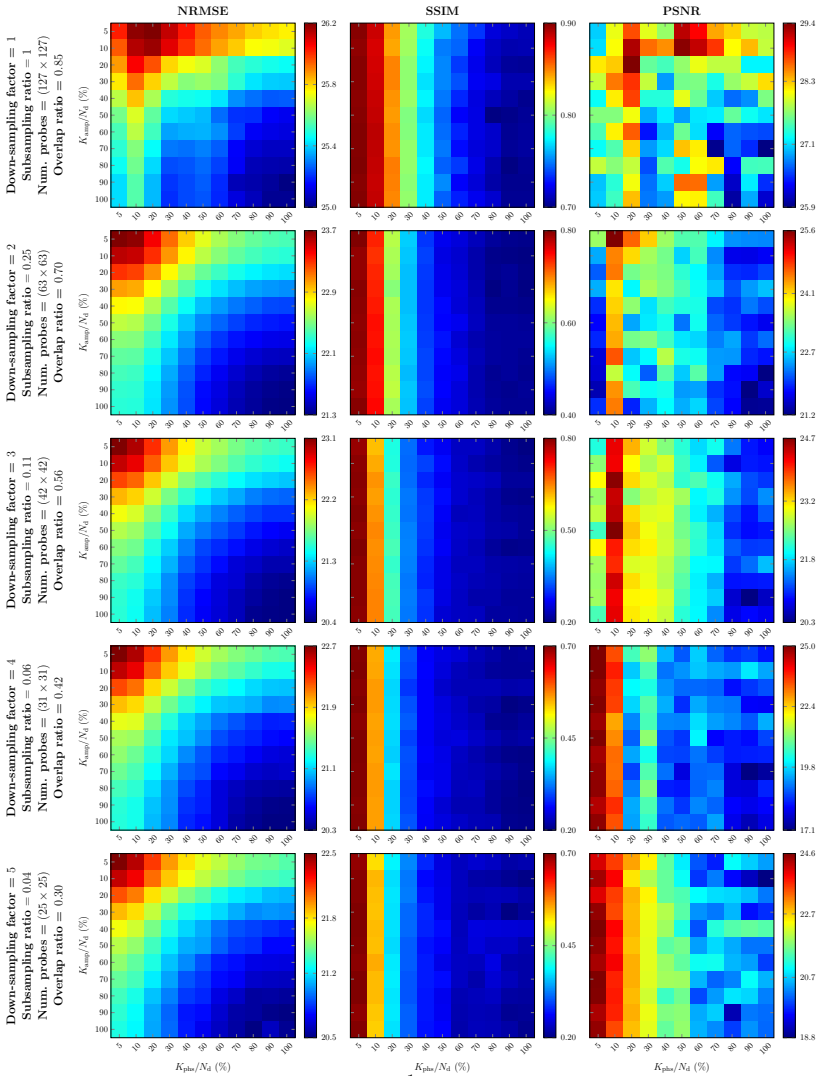
- [Section VII-B] The regularisation parameters Kphs and Kamp and the update step sizes αo and αp are selected by maximizing NRMSE/SSIM against the same reference used for evaluation (Section VII-B and Fig. 15). This constitutes tuning on the evaluation metric, so the reported improvements over ePIE (approximately 2.4 dB NRMSE, 0.4 SSIM, and 2.5 dB PSNR) are in-sample and will be optimistic for new datasets. The broad parameter range over which LoRePIE outperforms ePIE in Fig. 6 supports the qualitative direction of the result, but the absolute margins should be explicitly labelled as reference-relative, and a validation procedure (e.g., a separate phantom or a train/test split on the parameter selection) is needed to establish generalization.
- [Section IV, 'Simulated down-sampled data'] The synthetic low-overlap datasets are produced by uniformly subsampling probe positions from a single 85%-overlap experimental dataset. This is a reasonable first test, but it does not reproduce the conditions of a genuine low-overlap acquisition, where scan step changes may affect the probe, sample drift, or detector noise statistics, and the ptychographic oversampling ratio drops (from 19.0 to 3.8 in the table of Fig. 3). The conclusion that 'the fluence delivered to the sample could be reduced by scanning larger areas' relies on the assumption that the probe and object remain identical after subsampling. Please discuss this limitation explicitly and, ideally, validate on a dataset acquired with a larger scan step or on simulated data with a realistic forward model.
minor comments (5)
- [Section VII-B] The list of subsampling ratios is given as {1, 1/4, 1/9, 1/16, 1/25, 1/36} for down-sampling factors in {1,...,5}; the last entry corresponds to a sixth factor and should be removed.
- [Eq. (10)] In the NRMSE definition, the numerator is written as ∥u − γv∥2 without a square. As written the expression is dimensionally inconsistent with the subsequent derivation; it should be ∥u − γv∥2^2 (or the formula adjusted accordingly).
- [Abstract and Conclusion] The phrase 'high quality reconstruction' is stronger than the evidence presented; consider wording such as 'higher quality than ePIE on this dataset' or add a qualifier pending the phantom validation.
- [Fig. 3 caption] The labels 'LoRePIE (x4)' and 'ePIE (x4)' are ambiguous; please clarify whether they refer to the down-sampling factor or to four times magnified insets.
- [Algorithm 1, Line 7] The notation '√yl ⊙ ei∠ϕe_l' would be clearer if the element-wise operations on modulus and phase were written explicitly, as they are in the text.
Circularity Check
Algorithm derivation is self-contained, but the headline quantitative claims are partially fitted: hyperparameters are tuned against a self-generated ePIE/DM reference and the same reference is used for scoring, so the reported margins are not independent predictions.
-
fitted input called prediction
[Section IV, 'Reference data' and 'Ablation studies'; Section VII-B]
"To evaluate the performance of LoRePIE against ePIE and to avoid bias during comparison of the reconstructions generated, the reference object and probe data were obtained from 100 iterations of the ePIE algorithm followed by 100 iterations of the Difference Map (DM) algorithm... The hyperparameters were fine tuned as described in the Supplementary Material, Secs. S2, S3, and S4... setting Kamp = Kphs = 0.05Nd yields the highest NRMSE values... we use the update step size values that yields the highest Structural Similarity Index Measure (SSIM) values in Fig. S12."
The quantitative evidence for the central claim (e.g., SSIM=0.49 at 56% overlap, and the 2.4 dB/0.4/2.5 dB improvements in Sec. VII-B) is scored against a reference object that is itself a reconstruction of the same experimental dataset by 100 ePIE + 100 DM iterations, not an independent ground truth. The Kphs, Kamp, αo, and αp hyperparameters were selected to maximize exactly the NRMSE/SSIM metrics computed against that same reference. The reported numbers are therefore by construction the best-fitting agreement with a self-generated target rather than blind predictions about the true object. This is partial rather than total circularity, since the qualitative LoRePIE-over-ePIE ordering is robust across the full regularization grid in Fig.
full rationale
The algorithmic derivation of LoRePIE is self-contained: the hard-thresholding denoiser in Algorithm 1 is defined by Eqs. (5)-(7) and verified as the solution of the stated sparse-approximation problem (8); it does not assume the target result. No load-bearing uniqueness theorem or ansatz is imported from the authors' own prior work; the self-citations ([30], [37], [38]) are auxiliary. The main circularity concern is evaluative: the reference used for all SSIM/NRMSE/PSNR comparisons is generated by 100 ePIE + 100 DM iterations on the same full dataset, contains grid artifacts at the scan step spacing, and is also the target used for hyperparameter tuning. Thus the specific quantitative margins in Sec. IV and VII-B are partly fitted to a self-generated target, and the 'good visual quality at 56% overlap' claim is not anchored to an independent ground truth. However, the qualitative finding that LoRePIE outperforms ePIE holds over the entire tested range of K values (Fig. 6), not just at the tuned point, and the paper explicitly acknowledges that synthetic datasets are needed ('suggesting a need to further investigate the LoRePIE's performance using synthetic 4-D STEM datasets'). This limits the circularity to partial; the score is accordingly 3 rather than 6 or higher.
Assumptions & free parameters
free parameters (5)
- Kphs =
0.05 * Nd
- Kamp =
0.05 * Nd
- alpha_o and alpha_p per downsampling factor =
Values marked by stars in Fig. S15
- Number of iterations =
50
- Sparsity basis =
DCT
assumptions (5)
- domain assumption Multiplicative probe-object interaction psi_l = p * (Pi_l o)
- domain assumption Far-field diffraction modeled as DFT of the exit wave (Eqs. 2-3)
- ad hoc to paper The Rotavirus object phase and amplitude are K-sparse in the DCT domain
- ad hoc to paper Artificial probe downsampling preserves the acquisition physics of a true low-overlap scan
- standard math For an orthogonal transform, hard thresholding solves the sparse approximation problem in Eq. (8)
Cite this review
Pith. "Pith review of LoRePIE: $\ell_0$ Regularised Extended Ptychographical Iterative Engine for Low-dose and Fast Electron Ptychography." pith.science (2026). https://pith.science/paper/BU4UHKZY
@misc{pith2026241114915,
  author       = {Pith},
  title        = {Pith review of: LoRePIE: $\ell_0$ Regularised Extended Ptychographical Iterative Engine for Low-dose and Fast Electron Ptychography},
  year         = {2026},
  howpublished = {\url{https://pith.science/paper/BU4UHKZY}},
  note         = {Machine review of arXiv:2411.14915}
}
read the original abstract
The extended Ptychographical Iterative Engine (ePIE) is a widely used phase retrieval algorithm for Electron Ptychography from 4-dimensional (4-D) Scanning Transmission Electron Microscopy (4-D STEM) measurements acquired with a focused or defocused electron probe. However, ePIE relies on redundancy in the data and hence requires adjacent illuminated areas to overlap. In this paper, we propose a regularised variant of ePIE that is more robust to low overlap ratios. We examine the performance of the proposed algorithm on an experimental 4-D STEM data of double layered Rotavirus particles acquired in a full scan with 85% overlap. By artificial down-sampling of the probe positions, we have created synthetic 4-D STEM datasets with different overlap ratios and use these to show that a high quality reconstruction of Rotavirus particles can be obtained from data with an overlap as low as 56%.
Figures


Figures from the paper (12 more)




Forward citations
Cited by 1 Pith paper
-
On Overlap Ratio in Defocused Electron Ptychography
A 40% overlap ratio between adjacent probe positions is sufficient for stable, high-quality reconstructions in defocused electron ptychography under a phase object approximation.
Reference graph
Works this paper leans on
-
[1]
Towards sub- ˚a electron beams,
O. Krivanek, N. Dellby, and A. Lupini, “Towards sub- ˚a electron beams,” Ultramicroscopy, vol. 78, no. 1-4, pp. 1–11, 1999
work page 1999
-
[2]
Sub- ˚angstrom resolution using aberration corrected electron optics,
P. E. Batson, N. Dellby, and O. L. Krivanek, “Sub- ˚angstrom resolution using aberration corrected electron optics,” Nature, vol. 418, no. 6898, pp. 617–620, 2002
work page 2002
-
[3]
Image contrast and localized signal selection techniques,
A. Howie, “Image contrast and localized signal selection techniques,” Journal of Microscopy , vol. 117, pp. 11–23, 2 1979
work page 1979
-
[4]
Z-contrast STEM for materials science,
S. J. Pennycook, “Z-contrast STEM for materials science,” Ultramicroscopy, vol. 30, pp. 58–69, 12 1989. 12
work page 1989
-
[5]
The impact of STEM aberration correction on materials science,
——, “The impact of STEM aberration correction on materials science,” Ultramicroscopy, vol. 180, pp. 22–33, 2017
work page 2017
-
[6]
Electron ptychography achieves atomic-resolution limits set by lattice vibrations,
Z. Chen, Y . Jiang, Y .-T. Shao, M. E. Holtz, M. Odstr ˇcil, M. Guizar-Sicairos, I. Hanke, S. Ganschow, D. G. Schlom, and D. A. Muller, “Electron ptychography achieves atomic-resolution limits set by lattice vibrations,” Science, vol. 372, no. 6544, pp. 826–831, 2021
work page 2021
-
[7]
Development and application of stem for the biological sciences,
A. A. Sousa and R. D. Leapman, “Development and application of stem for the biological sciences,” Ultramicroscopy, vol. 123, pp. 38–49, 2012
work page 2012
-
[8]
Low-dose phase retrieval of biological specimens using cryo-electron ptychography,
L. Zhou, J. Song, J. S. Kim, X. Pei, C. Huang, M. Boyce, L. Mendonc ¸a, D. Clare, A. Siebert, E. Allen, Christopher S. Liberti, D. Stuart, X. Pan, P. D. Nellist, P. Zhang, A. I. Kirkland, and P. Wang, “Low-dose phase retrieval of biological specimens using cryo-electron ptychography,” Nature Communications, vol. 11, p. 2773, 2020
work page 2020
Show all 59 references
-
[9]
Imaging and spectroscopy of defects in semiconductors using aberration-corrected stem,
K. Van Benthem and S. J. Pennycook, “Imaging and spectroscopy of defects in semiconductors using aberration-corrected stem,” Applied Physics A , vol. 96, pp. 161–169, 2009
2009
-
[10]
Measuring spatially-resolved potential drops at semiconductor hetero-interfaces using 4d-stem,
V . S. Chejarla, S. Ahmed, J. Belz, J. Scheunert, A. Beyer, and K. V olz, “Measuring spatially-resolved potential drops at semiconductor hetero-interfaces using 4d-stem,” Small Methods, vol. 7, no. 9, p. 2300453, 2023
2023
-
[11]
Radiation damage in the tem and sem,
R. Egerton, P. Li, and M. Malac, “Radiation damage in the tem and sem,” Micron, vol. 35, no. 6, pp. 399–409, 2004
2004
-
[12]
Reducing electron beam damage through alternative STEM scanning strategies, part i: Experimental findings,
A. Velazco, A. B ´ech´e, D. Jannis, and J. Verbeeck, “Reducing electron beam damage through alternative STEM scanning strategies, part i: Experimental findings,” Ultramicroscopy, vol. 232, p. 113398, 2022
2022
-
[13]
Compressive scanning transmission electron microscopy,
D. Nicholls, A. Robinson, J. Wells, A. Moshtaghpour, M. Bahri, A. Kirkland, and N. Browning, “Compressive scanning transmission electron microscopy,” in proceedings of 2022 IEEE International Conference on Acoustics, Speech and Signal Processing (ICASSP) . IEEE, 2022, pp. 1586–1590
2022
-
[14]
Direct detectors and their applications in electron microscopy for materials science,
B. D. A. Levin, “Direct detectors and their applications in electron microscopy for materials science,” Journal of Physics: Materials , vol. 4, no. 4, p. 042005, 2021. [Online]. Available: https://dx.doi.org/10.1088/2515-7639/ac0ff9
2021 doi
-
[15]
Detectors—The ongoing revolution in scanning transmission electron microscopy and why this important to material characterization,
I. MacLaren, T. A. Macgregor, C. S. Allen, and A. I. Kirkland, “Detectors—The ongoing revolution in scanning transmission electron microscopy and why this important to material characterization,” APL Materials, vol. 8, no. 11, p. 110901, 2020. [Online]. Available: https://doi....
2020 doi
-
[16]
Four-dimensional scanning transmission electron microscopy (4d-stem): From scanning nanod- iffraction to ptychography and beyond,
C. Ophus, “Four-dimensional scanning transmission electron microscopy (4d-stem): From scanning nanod- iffraction to ptychography and beyond,” Microscopy and Microanalysis, vol. 25, no. 3, p. 563–582, 2019
2019
-
[17]
Atomic resolution defocused electron ptychography at low dose with a fast, direct electron detector,
J. Song, C. S. Allen, S. Gao, C. Huang, H. Sawada, X. Pan, J. Warner, P. Wang, and A. I. Kirkland, “Atomic resolution defocused electron ptychography at low dose with a fast, direct electron detector,” Scientific reports, vol. 9, no. 1, p. 3919, 2019
2019
-
[18]
P. W. Hawkes and J. C. Spence, Springer handbook of microscopy . Springer Nature, 2019. 13
2019
-
[19]
Measurement of atomic electric fields and charge densities from average momentum transfers using scanning transmission electron microscopy,
K. M ¨uller-Caspary, F. F. Krause, T. Grieb, S. L ¨offler, M. Schowalter, A. B ´ech´e, V . Galioit, D. Marquardt, J. Zweck, P. Schattschneider, J. Verbeeck, and A. Rosenauer, “Measurement of atomic electric fields and charge densities from average momentum transfers using scan...
2017
-
[20]
The theory of super-resolution electron microscopy via wigner- distribution deconvolution,
J. M. Rodenburg and R. H. T. Bates, “The theory of super-resolution electron microscopy via wigner- distribution deconvolution,” Philosophical Transactions of the Royal Society of London. Series A: Physical and Engineering Sciences , vol. 339, pp. 521–553, 1992
1992
-
[21]
Experimental tests on double-resolution coherent imaging via stem,
J. M. Rodenburg, B. C. McCallum, and P. D. Nellist, “Experimental tests on double-resolution coherent imaging via stem,” Ultramicroscopy, vol. 48, pp. 304–314, 1993
1993
-
[22]
An improved ptychographical phase retrieval algorithm for diffractive imaging,
A. M. Maiden and J. M. Rodenburg, “An improved ptychographical phase retrieval algorithm for diffractive imaging,” Ultramicroscopy, vol. 109, no. 10, pp. 1256–1262, 2009
2009
-
[23]
W ASP: weighted average of sequential projections for ptychographic phase retrieval,
A. M. Maiden, W. Mei, and P. Li, “W ASP: weighted average of sequential projections for ptychographic phase retrieval,” Optics Express, vol. 32, no. 12, pp. 21 327–21 344, 2024
2024
-
[24]
Probe retrieval in ptychographic coherent diffractive imaging,
P. Thibault, M. Dierolf, O. Bunk, A. Menzel, and F. Pfeiffer, “Probe retrieval in ptychographic coherent diffractive imaging,” Ultramicroscopy, vol. 109, no. 4, pp. 338–343, 2009
2009
-
[25]
Event driven 4d stem acquisition with a timepix3 detector: Microsecond dwell time and faster scans for high precision and low dose applications,
D. Jannis, C. Hofer, C. Gao, X. Xie, A. B ´ech´e, T. Pennycook, and J. Verbeeck, “Event driven 4d stem acquisition with a timepix3 detector: Microsecond dwell time and faster scans for high precision and low dose applications,” Ultramicroscopy, vol. 233, p. 113423, 2022
2022
-
[26]
Real-time four-dimensional scanning transmission electron microscopy through sparse sampling,
A. Robinson, J. Wells, A. Moshtaghpour, D. Nicholls, C. Huang, A. Velazco-Torrejon, G. Nicotra, A. Kirkland, and N. Browning, “Real-time four-dimensional scanning transmission electron microscopy through sparse sampling,” Chinese Physics B , vol. 33, no. 11, p. 116804, 2024
2024
-
[27]
A phase retrieval algorithm for shifting illumination,
J. M. Rodenburg and H. M. Faulkner, “A phase retrieval algorithm for shifting illumination,” Applied physics letters, vol. 85, no. 20, pp. 4795–4797, 2004
2004
-
[28]
Maximum-likelihood refinement for coherent diffractive imaging,
P. Thibault and M. Guizar-Sicairos, “Maximum-likelihood refinement for coherent diffractive imaging,” New Journal of Physics , vol. 14, no. 6, p. 063004, 2012
2012
-
[29]
Influence of the overlap parameter on the convergence of the ptychographical iterative engine,
O. Bunk, M. Dierolf, S. Kynde, I. Johnson, O. Marti, and F. Pfeiffer, “Influence of the overlap parameter on the convergence of the ptychographical iterative engine,” Ultramicroscopy, vol. 108, no. 5, pp. 481–487, 2008
2008
-
[30]
On overlap ratio in defocused electron ptychography,
A. Moshtaghpour and A. I. Kirkland, “On overlap ratio in defocused electron ptychography,” arXiv preprint arXiv:2502.00762, 2025
2025 arXiv
-
[31]
The discrete cosine transform,
G. Strang, “The discrete cosine transform,” SIAM Review, vol. 41, no. 1, pp. 135–147, 1999
1999
-
[32]
A wavelet tour of signal processing,
M. Stephane, “A wavelet tour of signal processing,” 1999
1999
-
[33]
De-noising by soft-thresholding,
D. L. Donoho, “De-noising by soft-thresholding,” IEEE transactions on information theory , vol. 41, no. 3, pp. 613–627, 1995. 14
1995
-
[34]
The what, how, and why of wavelet shrinkage denoising,
C. Taswell, “The what, how, and why of wavelet shrinkage denoising,” Computing in science & engineering , vol. 2, no. 3, pp. 12–19, 2000
2000
-
[35]
Compressed sensing,
D. L. Donoho, “Compressed sensing,” IEEE Transactions on information theory, vol. 52, no. 4, pp. 1289–1306, 2006
2006
-
[36]
Stable signal recovery from incomplete and inaccurate measure- ments,
E. J. Candes, J. K. Romberg, and T. Tao, “Stable signal recovery from incomplete and inaccurate measure- ments,” Communications on Pure and Applied Mathematics: A Journal Issued by the Courant Institute of Mathematical Sciences, vol. 59, no. 8, pp. 1207–1223, 2006
2006
-
[37]
Towards low-dose and fast 4-D scanning transmission electron microscopy: New sampling and reconstruction approaches,
A. Moshtaghpour, A. Velazco-Torrejon, A. Robinson, E. Liberti, J. S. Kim, N. D. Browning, and A. I. Kirkland, “Towards low-dose and fast 4-D scanning transmission electron microscopy: New sampling and reconstruction approaches,” Microscopy and Microanalysis, vol. 28, no. S1, p...
2022
-
[38]
Exploring low-dose and fast electron ptychography using l0 regularisation of extended ptychographical iterative engine,
A. Moshtaghpour, A. Velazco-Torrejon, A. W. Robinson, A. I. Kirkland, and N. D. Browning, “Exploring low-dose and fast electron ptychography using l0 regularisation of extended ptychographical iterative engine,” Microscopy and Microanalysis, vol. 29, no. Supplement 1, pp. 344–...
2023
-
[39]
Phase determination from image and diffraction plane pictures in the electron microscope,
R. W. Gerchberg, “Phase determination from image and diffraction plane pictures in the electron microscope,” Optik, vol. 34, pp. 275–284, 1971
1971
-
[40]
Phase retrieval algorithms: a comparison,
J. R. Fienup, “Phase retrieval algorithms: a comparison,” Applied optics, vol. 21, no. 15, pp. 2758–2769, 1982
1982
-
[41]
Iterative thresholding for sparse approximations,
T. Blumensath and M. E. Davies, “Iterative thresholding for sparse approximations,” Journal of Fourier analysis and Applications, vol. 14, pp. 629–654, 2008
2008
-
[42]
Iterative hard thresholding for compressed sensing,
——, “Iterative hard thresholding for compressed sensing,” Applied and computational harmonic analysis , vol. 27, no. 3, pp. 265–274, 2009
2009
-
[43]
Plug-and-play half-quadratic splitting for ptychography,
A. Denker, J. Hertrich, Z. Kereta, S. Cipiccia, E. Erin, and S. Arridge, “Plug-and-play half-quadratic splitting for ptychography,” arXiv preprint arXiv:2412.02548 , 2024
2024 arXiv
-
[44]
Perturbative fourier ptychographic microscopy for fast quantitative phase imaging,
M. Zach, K.-C. Shen, R. Cao, M. Unser, L. Waller, and J. Dong, “Perturbative fourier ptychographic microscopy for fast quantitative phase imaging,” arXiv preprint arXiv:2501.07308 , 2025
2025 arXiv
-
[45]
Overcoming information reduced data and experimentally uncertain parameters in ptychography with regularized optimization,
M. Schloz, T. C. Pekin, Z. Chen, W. Van den Broek, D. A. Muller, and C. T. Koch, “Overcoming information reduced data and experimentally uncertain parameters in ptychography with regularized optimization,” Optics Express, vol. 28, no. 19, pp. 28 306–28 323, 2020
2020
-
[46]
Anisotropic regularization for sparsely sampled and noise-robust fourier ptychography,
K. C. Lee, H. Chae, S. Xu, K. Lee, R. Horstmeyer, S. A. Lee, and B.-W. Hong, “Anisotropic regularization for sparsely sampled and noise-robust fourier ptychography,” Optics Express, vol. 32, no. 14, pp. 25 343–25 361, 2024
2024
-
[47]
Image denoising by sparse 3-d transform-domain collaborative filtering,
K. Dabov, A. Foi, V . Katkovnik, and K. Egiazarian, “Image denoising by sparse 3-d transform-domain collaborative filtering,” IEEE Transactions on image processing , vol. 16, no. 8, pp. 2080–2095, 2007
2007
-
[48]
Fourier ptychographic microscopy with sparse representation,
Y . Zhang, P. Song, J. Zhang, and Q. Dai, “Fourier ptychographic microscopy with sparse representation,” Scientific reports, vol. 7, no. 1, p. 8664, 2017. 15
2017
-
[49]
Regularized fourier ptychography using an online plug-and-play algorithm,
Y . Sun, S. Xu, Y . Li, L. Tian, B. Wohlberg, and U. S. Kamilov, “Regularized fourier ptychography using an online plug-and-play algorithm,” in ICASSP 2019-2019 IEEE International Conference on Acoustics, Speech and Signal Processing (ICASSP) . IEEE, 2019, pp. 7665–7669
2019
-
[50]
Sampling in x-ray ptychography,
T. Edo, D. Batey, A. Maiden, C. Rau, U. Wagner, Z. Pe ˇsi´c, T. Waigh, and J. Rodenburg, “Sampling in x-ray ptychography,” Physical Review A , vol. 87, no. 5, p. 053850, 2013
2013
-
[51]
Elementary signals in ptychography,
J. C. da Silva and A. Menzel, “Elementary signals in ptychography,” Optics express , vol. 23, no. 26, pp. 33 812–33 821, 2015
2015
-
[52]
Reciprocal-space up-sampling from real-space oversampling in x-ray ptychography,
D. Batey, T. Edo, C. Rau, U. Wagner, Z. Pe ˇsi´c, T. Waigh, and J. Rodenburg, “Reciprocal-space up-sampling from real-space oversampling in x-ray ptychography,” Physical Review A , vol. 89, no. 4, p. 043812, 2014
2014
-
[53]
A computational framework for ptychographic reconstructions,
B. Enders and P. Thibault, “A computational framework for ptychographic reconstructions,” Proceedings of the Royal Society A: Mathematical, Physical and Engineering Sciences , vol. 472, no. 2196, p. 20160640, 2016
2016
-
[54]
Wavelength-scale ptychographic coherent diffractive imaging using a high-order harmonic source,
G. K. Tadesse, W. Eschen, R. Klas, M. Tschernajew, F. Tuitje, M. Steinert, M. Zilk, V . Schuster, M. Z ¨urch, T. Pertsch et al., “Wavelength-scale ptychographic coherent diffractive imaging using a high-order harmonic source,” Scientific reports, vol. 9, no. 1, p. 1735, 2019
2019
-
[55]
Ptychographic wavefront characterization for single-particle imaging at x-ray lasers,
B. J. Daurer, S. Sala, M. F. Hantke, H. K. Reddy, J. Bielecki, Z. Shen, C. Nettelblad, M. Svenda, T. Ekeberg, G. A. Carini et al. , “Ptychographic wavefront characterization for single-particle imaging at x-ray lasers,” Optica, vol. 8, no. 4, pp. 551–562, 2021
2021
-
[56]
Ptychoshelves, a versatile high-level framework for high-performance analysis of ptychographic data,
K. Wakonig, H.-C. Stadler, M. Odstr ˇcil, E. H. Tsai, A. Diaz, M. Holler, I. Usov, J. Raabe, A. Menzel, and M. Guizar-Sicairos, “Ptychoshelves, a versatile high-level framework for high-performance analysis of ptychographic data,” Journal of applied crystallography , vol. 53, ...
2020
-
[57]
Extended ptychography in the transmission electron microscope: Possibilities and limitations,
F. H ¨ue, J. Rodenburg, A. Maiden, and P. Midgley, “Extended ptychography in the transmission electron microscope: Possibilities and limitations,” Ultramicroscopy, vol. 111, no. 8, pp. 1117–1123, 2011
2011
-
[58]
Image quality assessment: from error visibility to structural similarity,
Z. Wang, A. C. Bovik, H. R. Sheikh, and E. P. Simoncelli, “Image quality assessment: from error visibility to structural similarity,” IEEE transactions on image processing , vol. 13, no. 4, pp. 600–612, 2004
2004
-
[59]
Compressed sensing and best k-term approximation,
A. Cohen, W. Dahmen, and R. DeV ore, “Compressed sensing and best k-term approximation,” Journal of the American mathematical society , vol. 22, no. 1, pp. 211–231, 2009. 16 VII. S UPPLEMENTARY INFORMATION A. Low-complexity of the Rotavirus phase image The intuition that motiv...
2009
Reviewed August 12, 2026 · model on record in the stance chip above.
Discussion (0). Continue with ORCID to comment.