REVIEW 3 major objections 5 minor 1 cited by
Structure of the chromatic polynomial
T0 review · 3 major / 5 minor · reviewed 2026-08-12 · deepseek-v4-flash
Pith's one-line read The paper claims that chromatic polynomial data of all simple connected graphs with up to ten vertices is essentially one-dimensional, with over 99 percent of variance explained by the first principal component.
desk verdict Useful exploratory study of chromatic polynomial coefficient space, but the one-dimensionality claim is conditioned on the preprocessing and the paper overstates finite-data observations as implications. read the letter →
The pith
A machine-rendered reading of the paper's core claim, the machinery that carries it, and where it could break.
The reading
What carries the argument
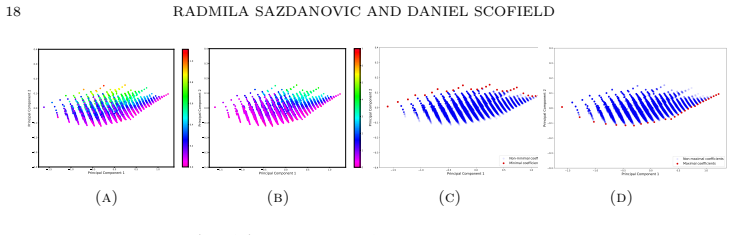
The central object is the coefficient vector $Q(G) = (|c_n|, |c_{n-1}|, \dots, |c_1|, 0, \dots, 0)$, built from the absolute values of the chromatic polynomial coefficients and padded with zeros to a common length. Before analysis, each fixed-order data set is transformed by $f(x) = \ln(1+x)$ and then each feature is min-max scaled to $[0,1]$. The argument is carried by two tools: filtered PCA, the practice of applying PCA to data sets filtered by increasing vertex order and tracking how many principal components are needed to keep cumulative explained variance above 95 percent, and Ball Mapper, which covers the point cloud with radius-$\epsilon$ balls and draws an edge between two balls whenever they share a data point. The load-bearing comparison is that the linear Ball Mapper graph, colored by average PC1 and PC2 scores, reproduces the PCA ordering; that agreement is what turns the variance percentages into a structural claim about the data.
What would settle it
Run PCA on the raw coefficient vectors and on log-only coefficient vectors for all graphs of order nine, without the per-feature min-max scaling; if the first component's explained variance drops below 95 percent in either case, the claimed one-dimensionality is an artifact of the normalization. As a second control, apply the exact same log-and-min-max pipeline to random vectors with coefficient magnitudes matching the chromatic data; if those also yield a first component above 99 percent, the result does not distinguish chromatic polynomials from generic high-dimensional vectors.
Extended reading notes
Core claim
On the paper's own terms, the central discovery is that the chromatic polynomial data of graphs is essentially one-dimensional, and this dimensionality is stable with respect to increasing the order of the graph. For orders eight, nine, and ten, the normalized explained variance of the first principal component is $0.99188$, $0.99178$, and $0.99189$, respectively, and the cumulative explained variance passes $0.999$ by the second component. The PC1 loadings are all positive and nearly equal, so moving along the first component means increasing all coefficients together, which correlates with the number of edges; the PC2 loadings change sign halfway through the coefficient list, so PC2 measures the contrast between the early and late coefficients. In the Ball Mapper graph, built from an epsilon-cover of the same point cloud, the clusters form a linear chain ordered by edge count, and coloring each cluster by its average PC1 or PC2 score reproduces the PCA ordering. Within a fixed number of edges, the PC2 extremes are the chromatically minimal graphs, whose absolute coefficient vectors are componentwise smallest and which include highly irregular threshold graphs, and the chromatically maximal graphs, whose coefficients are componentwise largest and which are typified by the nearly regular Turán graphs; the same extremal families appear at the ends of both the PCA projection and the Ball Mapper graph.
Load-bearing premise
The paper's central conclusion depends on the unexamined choice to take logarithms of the coefficients and then stretch every coefficient's values to the same 0-to-1 range before computing the principal components; if that preprocessing, rather than a property of chromatic polynomials, is what makes the first component explain over 99 percent of the variance, the one-dimensionality claim would not survive alternative scaling.
Editorial extensions
If this is right
- If the one-dimensionality holds, then the chromatic polynomial coefficient vectors of graphs with a fixed number of vertices can be summarized to near-perfect accuracy by a single scalar, essentially the number of edges.
- The linear Ball Mapper graph gives a coordinate line on which any graph invariant can be displayed as a function, so irregularity measures and extremal-graph properties can be compared across all graphs of a given order without pairing graphs one by one.
- Within each fixed vertex and edge count, the two ends of the PC2 direction separate chromatically minimal graphs, which include threshold graphs, from chromatically maximal graphs, typified by Turán graphs, giving a data-driven placement of these extremal families.
- The stability of the one-dimensional structure for orders up to ten suggests the pipeline can be applied to other graph polynomials; the authors expect the Tutte polynomial to have dimension at least three because it specializes to the Jones polynomial.
Reading between the lines
- The one-dimensionality conclusion is not yet separated from the preprocessing: applying the same log-and-min-max scaling to unstructured random vectors of comparable coefficient sizes might also put more than 99 percent of variance on the first component, in which case the result would describe the normalization rather than anything special about chromatic polynomials.
- Because PC2 is essentially a contrast between the early and late coefficients, and the late coefficients are governed by subgraph-counting formulas, one could try to identify PC2 with a closed-form function of the coefficient formulas in Theorem 2.12, turning the empirical axis into an algebraic invariant.
- A direct way to test whether the one-dimensionality is specific to colorings would be to run the same pipeline on the coefficient vectors of the Tutte polynomial, which is known to specialize to both the chromatic and Jones polynomials; a higher PCA dimension there would confirm that the low dimension is not a generic artifact of polynomial coefficients.
Editorial analysis
A structured set of objections, weighed in public.
Referee Report
Summary. The paper applies PCA and Ball Mapper to the point cloud of chromatic polynomial coefficient vectors of all simple connected graphs with up to 10 vertices (over 11.7 million graphs). The data is preprocessed by taking absolute values, applying ln(1+x), and min-max normalizing each coefficient feature separately for each fixed vertex count. The main claim is that this data is essentially one-dimensional, with the first principal component explaining over 99% of variance (Table 2) and corresponding to the number of edges, while the second component reflects graph irregularity. The authors further claim that Ball Mapper graphs are linear and agree with the PCA ordering, and that extremal graphs in the chromatic polynomial poset occupy the ends of the PC2 spectrum. The paper also states, based on computations up to 9 vertices, that Turan graphs are maximal in the chromatic polynomial poset G(n,m).
Significance. If the central empirical claims are robust, this is a valuable contribution to the emerging area of data-driven mathematics and to the study of graph polynomial invariants. The paper uses an impressively complete dataset, combines two independent geometric data analysis tools (PCA and Ball Mapper), and connects its findings to a known poset of chromatic polynomials and to irregularity measures. The explicit identification of clusters containing well-known graph families (trees, complete graphs, Turan graphs) and the observed relationship between PC2 and irregularity are concrete, falsifiable observations that could guide future theoretical work on chromatically maximal and minimal graphs. However, the paper's main conclusions are empirical, and their validity depends on preprocessing choices that are not yet justified by sensitivity analysis or null models.
major comments (3)
- [§3.3 and §4.1, Table 2] The central one-dimensionality claim rests on the specific preprocessing pipeline: log transform ln(1+x) followed by per-feature min-max normalization to [0,1] before PCA. This normalization equalizes the range of every coefficient and can force a common 'size' direction to dominate the covariance matrix. The paper does not test alternative normalizations (e.g., z-score standardization, no normalization beyond the log transform, or PCA on the correlation matrix) nor compare the observed explained-variance profile against a null model of independent features with the same marginal distributions. Without such checks, the >99% PC1 normalized explained variance in Table 2 may be an artifact of the chosen coordinate scaling rather than an intrinsic geometric property of chromatic polynomial coefficient vectors. Because Section 4.1's statement that 'chromatic polynomial data is essentially one-dimensional' is the paper's main quantitative claim, this missing sensitivity analysis is load-bearing.
- [§4.4, bulleted list] The bullet 'The Turan graph T(n,m) is maximal in the poset G(n,m)' is presented as a direct consequence of computations for graphs up to nine vertices. As written, this is a universal statement over all n and m, which cannot be established by finite enumeration. Either the statement should be explicitly restricted to the computed range (n ≤ 9, with m in the appropriate range) or a proof should be supplied. This is not merely a wording issue: the preceding text says 'Computations for graphs up to nine vertices imply that', which overstates the logical force of a finite computational check.
- [§3.2, §4.3, Figures 6–9] The Ball Mapper analysis uses Euclidean distance on the same log-transformed, min-max-normalized vectors that feed the PCA, and the BMGraph is then compared with PCA scores. Because both methods operate on the same coordinate scaling, the observed agreement between the linear BMGraph and PC1 does not provide independent confirmation of the one-dimensionality claim; it may reflect the same preprocessing-induced structure. Additionally, the Ball Mapper radius epsilon is chosen ad hoc (values 0.1, 0.15, 0.22, 0.06 in different figures), and the paper does not systematically study how the BMGraph topology varies with epsilon. A robustness check over a range of epsilon values, or at least a justification for the chosen radii, is needed to support the claim that the linear structure is a stable feature of the data rather than an artifact of a particular cover.
minor comments (5)
- [Abstract and §1] The abstract and introduction refer to graphs 'up to 10 crossings', but the data consist of graphs with up to 10 vertices; the term 'crossings' appears to be a typo and should be replaced with 'vertices' throughout.
- [§2.2, Proposition 2.22] There is a typo: 'quasi-star fraphs' should read 'quasi-star graphs'.
- [Figure 11 caption] The caption reads 'GMGraph' but should be 'BMGraph'.
- [§4.4, bulleted list] The notation 'Turan graph T(n,m)' is inconsistent with Definition 2.23, where a Turan graph is denoted T(n,r) with r the number of partition classes; m is used elsewhere for the number of edges. Please use consistent notation.
- [§3.3, Table 1] The coefficient vectors are given as absolute values, and the sign pattern is said to be '(−1)^k' for each coefficient c_{n−k}. This is true for the first few coefficients but is not true in general for all coefficients of arbitrary graphs; the statement should be more careful, since the signs of later chromatic coefficients are not universally alternating.
Circularity Check
No significant circularity: the one-dimensionality claim is an empirical PCA observation under explicit preprocessing, not a derivation from the input; self-citations are methodological only.
full rationale
The paper's central claims are empirical observations about a point cloud of chromatic coefficient vectors, not derivations from fitted parameters. The one-dimensionality claim rests on PCA of an explicitly described representation (log-transformed, min-max normalized coefficients, Section 3.3), and the paper explicitly labels the evidence 'only empirical' in the Introduction, reducing the risk of a hidden derivation-as-input reduction. The dimension criterion is imported as a definition from the authors' prior work [36], but a definition is not a load-bearing theorem; the reported PC1 normalized explained variance >0.99 (Table 2) is a computed quantity, not an output forced by the definition. Ball Mapper and filtered PCA are cited from [36,43] for methodology, but the chromatic-data structure itself is newly computed on complete enumeration data. No parameter is fitted to a subset and then renamed a prediction; the Ball Mapper radius is user-chosen, and PCA is unsupervised. The agreement between BMGraph linearity and PCA is not independent confirmation because both methods use the same normalized vectors, but the paper does not claim it as a derivation, only as informal corroboration. Concerns about preprocessing sensitivity or lack of a null model are correctness and robustness issues, not circularity under the stated criteria.
Assumptions & free parameters
free parameters (3)
- Ball Mapper radius epsilon =
0.06, 0.1, 0.15, 0.22 (values used in figures)
- Dimension threshold (95% explained variance) =
0.95
- Preprocessing log transform and min-max normalization =
ln(1+x) and per-feature min-max scaling to [0,1]
assumptions (3)
- standard math Coefficients of the chromatic polynomial of a simple graph alternate in sign, so absolute values can be used without losing information.
- domain assumption The sample of all simple connected graphs up to 10 vertices is representative of the 'space of graphs' for structural inference.
- domain assumption The Bollobas-Pebody-Riordan conjecture is mentioned as motivation but not used as a premise.
Cite this review
Pith. "Pith review of Structure of the chromatic polynomial." pith.science (2026). https://pith.science/paper/DZIOKYP3
@misc{pith2026241115088,
  author       = {Pith},
  title        = {Pith review of: Structure of the chromatic polynomial},
  year         = {2026},
  howpublished = {\url{https://pith.science/paper/DZIOKYP3}},
  note         = {Machine review of arXiv:2411.15088}
}
read the original abstract
Recently, big data techniques such as machine learning and topological data analysis have made their way to theoretical mathematics. Motivated by the recent work with polynomial invariants for knots, we use manifold learning and topological data analysis techniques to explore the structure and properties of the point cloud consisting of the chromatic polynomials of graphs up to 10 crossings. Although chromatic, as well as the Tutte polynomial fail to distinguish graphs, according to a conjecture by Bollobas, Pebody and Riordan they approximate the space of random graphs. In this work we compare structures in the chromatic data revealed using filtered PCA and Ball Mapper techniques, and relate them with a range of numerical invariants for graphs.
Figures


Figures from the paper (11 more)



Forward citations
Cited by 1 Pith paper
-
Big data approach to Kazhdan-Lusztig polynomials
Data on Kazhdan-Lusztig polynomials up to S_11 suggests superexponential growth of extremal coefficients, near-universal unimodality, and a conjectured closed family (1+v+...+v^l)^{k-1}.
Reference graph
Works this paper leans on
-
[1]
Hosam Abdo, Stephan Brandt, and Darko Dimitrov, The total irregularity of a graph, Discrete Mathematics and Theoretical Computer Science 16 (2014), no. 1, 201–206
work page 2014
-
[2]
Hosam Abdo, Darko Dimitrov, and Ivan Gutman, Graph irregularity and its measures , Ap- plied Mathematics and Computation 357 (2019), 317–324
work page 2019
-
[3]
Rudolf Ahlswede and Gyula OH Katona, Graphs with maximal number of adjacent pairs of edges, Acta Mathematica Academiae Scientiarum Hungarica 32 (1978), no. 1-2, 97–120
work page 1978
-
[4]
Michael O Albertson, The irregularity of a graph , Ars Combinatoria 46 (1997), 219–225
work page 1997
-
[5]
Francis K Bell, A note on the irregularity of graphs , Linear Algebra and its Applications 161 (1992), 45–54
work page 1992
-
[6]
Halina Bielak, A new method for counting chromatic coefficients, Annales UMCS Informatica AI 3 (2005), no. 1, 179–189
work page 2005
-
[7]
Zbigniew Ryszard Bogdanowicz, Spanning trees in undirected simple graphs, Stevens Institute of Technology, 1985
work page 1985
-
[8]
B´ ela Bollob´ as, Luke Pebody, and Oliver Riordan,Contraction–deletion invariants for graphs , Journal of Combinatorial Theory, Series B 80 (2000), no. 2, 320–345
work page 2000
Show all 55 references
-
[9]
2, 139–143
Chong-Yun Chao and George A Novacky Jr, On maximally saturated graphs , Discrete Math- ematics 41 (1982), no. 2, 139–143
1982
-
[10]
Chong-Yun Chao and Earl Whitehead Jr., On chromatic equivalence of graphs , Theory and Applications of Graphs (Yousef Alavi and Don Lick, eds.), Lecture Notes in Mathematics, Springer, 1976, pp. 121–131
1976
-
[11]
2, 171–177
, Chromatically unique graphs , Discrete Mathematics 27 (1979), no. 2, 171–177
1979
-
[12]
Nikiforov , Discrete Mathematics 309 (2009), no
P´ eter Csikv´ ari,On a conjecture of V. Nikiforov , Discrete Mathematics 309 (2009), no. 13, 4522–4526
2009
-
[13]
, Applications of the Kelmans transformation: extremality of the threshold graphs , The Electronic Journal of Combinatorics (2011), P182–P182
2011
-
[14]
4, 261–284
Jonathan Cutler and AJ Radcliffe, Extremal graphs for homomorphisms , Journal of Graph Theory 67 (2011), no. 4, 261–284
2011
-
[15]
Alex Davies, Andr´ as Juh´ asz, Marc Lackenby, and Nenad Tomasev,The signature and cusp geometry of hyperbolic knots, arXiv preprint arXiv:2111.15323 to appear in Geometry & Topol- ogy (2021)
2021 arXiv
-
[16]
7887, 70–74
Alex Davies, Petar Veliˇ ckovi´ c, Lars Buesing, Sam Blackwell, Daniel Zheng, Nenad Tomaˇ sev, Richard Tanburn, Peter Battaglia, Charles Blundell, Andr´ as Juh´ asz, et al.,Advancing math- ematics by guiding human intuition with AI , Nature 600 (2021), no. 7887, 70–74
2021
-
[17]
1, 45–50
Darko Dimitrov and Riste ˇSkrekovski, Comparing the irregularity and the total irregularity of graphs, Ars Mathematica Contemporanea 9 (2014), no. 1, 45–50
2014
-
[18]
P Dlotko, Ballmapper: Create a ball mapper graph of the input data , R package version 0.1.0 (2019)
2019
-
[20]
Fengming Dong, Khee Meng Koh, and Kie Leong Teo, Chromatic Polynomials and Chro- maticity of Graphs , World Scientific, Singapore, 2005
2005
-
[21]
6, 1553–1560
Michael Eastwood and Stephen Huggett, Euler characteristics and chromatic polynomials , European Journal of Combinatorics 28 (2007), no. 6, 1553–1560
2007
-
[22]
Edward Farrell, On chromatic coefficients, Discrete Mathematics 29 (1980), 257–264
1980
-
[23]
Conda forge community, The conda-forge Project: Community-based Software Distribution Built on the conda Package Format and Ecosystem , July 2015
2015
-
[24]
4, 1365–1388
Laure Helme-Guizon and Yongwu Rong, A categorification for the chromatic polynomial , Algebraic & Geometric Topology 5 (2005), no. 4, 1365–1388
2005
-
[25]
Richard Hepworth and Simon Willerton, Categorifying the magnitude of a graph , Homology, Homotopy and Applications (2017), 31–60
2017
-
[26]
03, 2050005
Mark C Hughes, A neural network approach to predicting and computing knot invariants , Journal of Knot Theory and Its Ramifications 29 (2020), no. 03, 2050005
2020
-
[27]
3, 907–927
June Huh, Milnor numbers of projective hypersurfaces and the chromatic polynomial of graphs, Journal of the American Mathematical Society 25 (2012), no. 3, 907–927
2012
-
[28]
20 RADMILA SAZDANOVIC AND DANIEL SCOFIELD
Vishnu Jejjala, Arjun Kar, and Onkar Parrikar, Deep learning the hyperbolic volume of a knot, Physics Letters B 799 (2019), 135033. 20 RADMILA SAZDANOVIC AND DANIEL SCOFIELD
2019
-
[29]
2065, 20150202
Ian T Jolliffe and Jorge Cadima, Principal component analysis: a review and recent de- velopments, Philosophical Transactions of the Royal Society A: Mathematical, Physical and Engineering Sciences 374 (2016), no. 2065, 20150202
2016
-
[30]
Nathan Kahl, Graph vulnerability parameters, compression, and threshold graphs , Discrete Applied Mathematics 292 (2021), 108–116
2021
-
[31]
, Extremal graphs for the Tutte polynomial , Journal of Combinatorial Theory, Series B 152 (2022), 121–152
2022
-
[32]
1, 77–88
Alexander K Kelmans, On graphs with randomly deleted edges, Acta Mathematica Academiae Scientiarum Hungarica 37 (1981), no. 1, 77–88
1981
-
[33]
6, 703–723
Lauren Keough and Andrew J Radcliffe, Graphs with the fewest matchings , Combinatorica 36 (2016), no. 6, 703–723
2016
-
[34]
10, 2783–2791
Felix Lazebnik, The maximum number of colorings of graphs of given order and size: A survey, Discrete Mathematics 342 (2019), no. 10, 2783–2791
2019
-
[35]
Tom Leinster, The magnitude of metric spaces , Documenta Mathematica 18 (2013), 857–905
2013
-
[36]
Jesse SF Levitt, Mustafa Hajij, and Radmila Sazdanovic, Big data approaches to knot theory: Understanding the structure of the Jones polynomial , arXiv:1912.10086 (2019)
2019 arXiv
-
[37]
1-3, 181–185
Martin Loebl, Jiˇ r ´ ı Matouˇ sek, and Ondˇ rej Pangr´ ac,Triangles in random graphs , Discrete mathematics 289 (2004), no. 1-3, 181–185
2004
-
[38]
Guy Meredith, Coefficients of chromatic polynomials, Journal of Combinatorial Theory, Series B 13 (1972), 14–17
1972
-
[39]
1, 347–360
Vladimir Nikiforov, Eigenvalues and degree deviation in graphs , Linear Algebra and its Ap- plications 414 (2006), no. 1, 347–360
2006
-
[40]
2, 365–384
Marc Noy, Graphs determined by polynomial invariants , Theoretical Computer Science 307 (2003), no. 2, 365–384
2003
-
[41]
3, 383–398
Joelma Ananias de Oliveira, Carla Silva Oliveira, Claudia Justel, and Nair Maria Maia de Abreu, Measures of irregularity of graphs , Pesquisa Operacional 33 (2013), no. 3, 383–398
2013
-
[42]
D lotko Pawe l,Ball mapper: a shape summary for topological data analysis , arXiv:1901.07410 (2019)
2019 arXiv
-
[43]
D lotko Pawe l, Davide Gurnari, and Radmila Sazdanovic,Knot invariants and their relations: a topological perspective, arXiv preprint arXiv:2109.00831 (2021)
2021 arXiv
-
[44]
Pedregosa, G
F. Pedregosa, G. Varoquaux, A. Gramfort, V. Michel, B. Thirion, O. Grisel, M. Blondel, P. Prettenhofer, R. Weiss, V. Dubourg, J. Vanderplas, A. Passos, D. Cournapeau, M. Brucher, M. Perrot, and E. Duchesnay, Scikit-learn: Machine learning in Python , Journal of Machine Learnin...
2011
-
[45]
Ronald Read, An introduction to chromatic polynomials , Journal of Combinatorial Theory 4 (1968), 52–71
1968
-
[46]
1-3, 115–119
J Rodriguez and A Satyanarayana, Chromatic polynomials with least coefficients , Discrete Mathematics 172 (1997), no. 1-3, 115–119
1997
-
[47]
Theory of M¨ obius functions, Zeitschrift f¨ ur Wahrscheinlichkeitstheorie und verwandte Gebiete2 (1964), no
Gian-Carlo Rota, On the foundations of combinatorial theory I. Theory of M¨ obius functions, Zeitschrift f¨ ur Wahrscheinlichkeitstheorie und verwandte Gebiete2 (1964), no. 4, 340–368
1964
-
[48]
2, 209– 216
Appajosyula Satyanarayana, L Schoppmann, and Charles L Suffel, A reliability-improving graph transformation with applications to network reliability , Networks 22 (1992), no. 2, 209– 216
1992
-
[49]
Radmila Sazdanovi´ c and Martha Yip,A categorification of the chromatic symmetric function, Journal of Combinatorial Theory, Series A 154 (2018), 218–246
2018
-
[50]
Gurjeet Singh, Facundo M´ emoli, and Gunnar Carlsson, Topological methods for the analysis of high dimensional data sets and 3D object recognition , SPBG 91 (2007), 100
2007
-
[51]
1, 166–194
Richard P Stanley, A symmetric function generalization of the chromatic polynomial of a graph, Advances in Mathematics 111 (1995), no. 1, 166–194
1995
-
[52]
W. A. Stein et al., Sage Mathematics Software (Version 9.1) , The Sage Development Team, 2020, http://www.sagemath.org
2020
-
[53]
Paul Tur´ an,Eine extremalaufgabe aus der graphentheorie , Mat. Fiz. Lapok 48 (1941), 436– 452
1941
-
[54]
William Thomas Tutte, A contribution to the theory of chromatic polynomials , Canadian Journal of Mathematics 6 (1954), 80–91
1954
-
[55]
21(1), Springer, 1957, pp
Lothar Von Collatz and Ulrich Sinogowitz, Spektren endlicher grafen, Abhandlungen aus dem Mathematischen Seminar der Universit¨ at Hamburg, vol. 21(1), Springer, 1957, pp. 63–77. STRUCTURE OF THE CHROMATIC POLYNOMIAL 21
1957
-
[56]
8, 572–579
Hassler Whitney, A logical expansion in mathematics, Bulletin of the American Mathematical Society 38 (1932), no. 8, 572–579. Department of Mathematics, North Carolina State University Email address : rsazdanovic@math.ncsu.edu Department of Mathematics, Francis Marion Universi...
1932
Reviewed August 12, 2026 · model on record in the stance chip above.
Discussion (0). Continue with ORCID to comment.