REVIEW 3 major objections 6 minor 108 references
Large-scale dual AGN in large-scale cosmological hydrodynamical simulations
T0 review · 3 major / 6 minor · reviewed 2026-08-12 · deepseek-v4-flash
Pith's one-line read Nine cosmological simulations place the dual-AGN peak at cosmic noon and find too few such systems in the local universe.
desk verdict A solid, transparent multi-simulation census of dual AGN, but the z=0 deficit claim needs a matched selection comparison before it becomes a secure result. read the letter →
The pith
A machine-rendered reading of the paper's core claim, the machinery that carries it, and where it could break.
The reading
What carries the argument
The carrying definition is a three-part selection rule: a pair of massive black holes each with bolometric luminosity $L_{\rm bol}\ge 10^{43}\,\mathrm{erg\,s^{-1}}$, three-dimensional separation $d\le 30\,\mathrm{pkpc}$, and members residing in distinct galaxies. The distinct-galaxy clause is what lets the nine simulations—which treat black-hole dynamics very differently, from repositioning black holes to galactic centres to modelling dynamical friction—be compared on equal footing. Bolometric luminosities are computed from accretion rates via $L_{\rm bol}=0.1\,\dot{M}_{\rm MBH} c^2$, with a fixed bolometric correction to the 2–10 keV band for the X-ray detectability forecasts.
What would settle it
A volume-complete, arcsecond-resolution X-ray survey at z ≈ 2–3 that counts AGN pairs with $L_{\rm bol}\ge 10^{43}\,\mathrm{erg\,s^{-1}}$ and separation $\le 30\,\mathrm{pkpc}$ could settle it: the simulations predict about $10^{-5}$ to $10^{-3}\,\mathrm{cMpc^{-3}}$, so a survey that should contain dozens but finds none would falsify the peak-density prediction, and a detection rate an order of magnitude higher would falsify the current upper limits.
Extended reading notes
Core claim
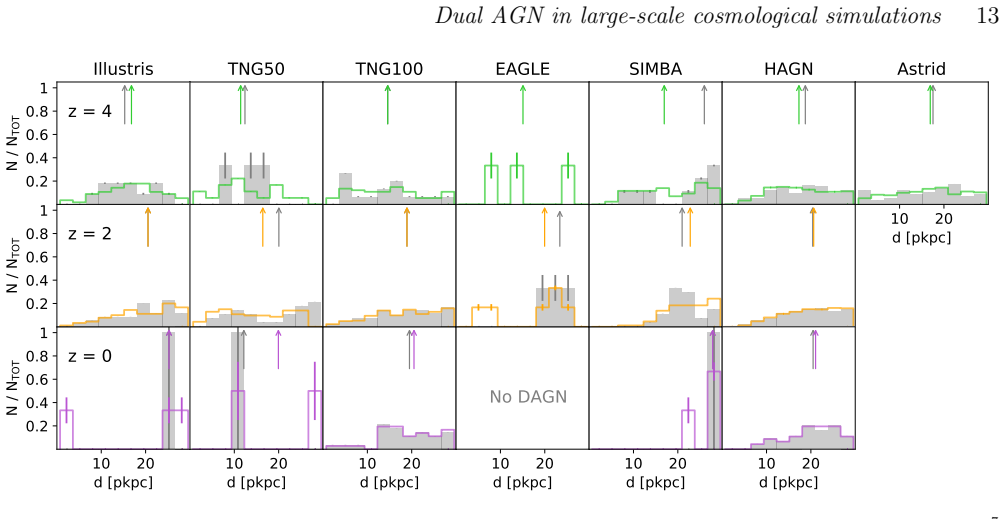
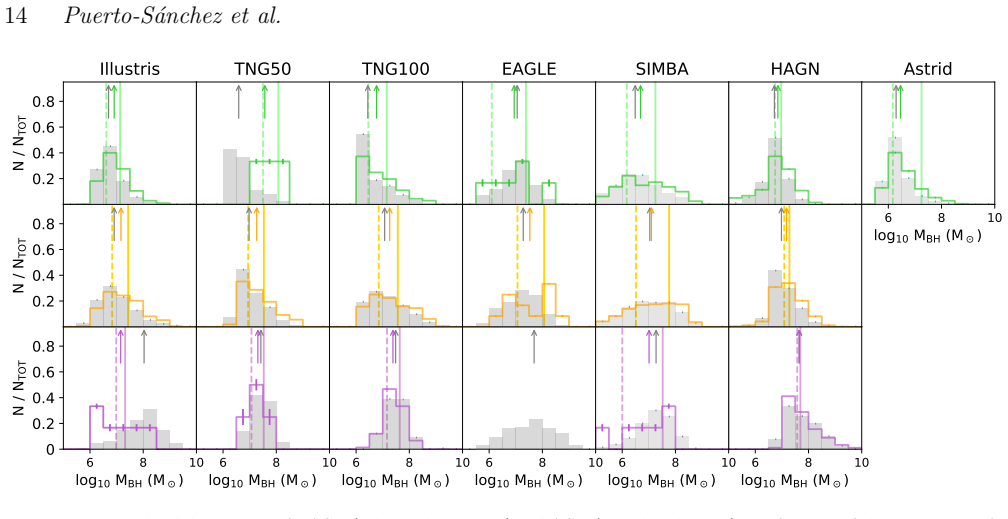
On the simulations' own terms, the paper establishes three things. First, DAGN with Lbol ≥ $10^{43}$ erg/s in distinct galaxies and d ≤ 30 pkpc have number densities from about $10^{-8}$ (or zero) to $10^{-3}$ $cMpc^{-3}$ over z = 0–7, with fractions of AGN in pairs of 0–6 percent. Second, all nine simulations place the peak of that population at z = 1–3, slightly earlier than the peak of AGN activity, and the typical DAGN separation grows with time while the median black-hole mass grows with time. Third, the simulated z = 0 DAGN fractions fall below the values reported by local AGN-pair surveys, while the z ≈ 3 predictions are consistent with current upper limits; the paper interprets this as simulations either producing too few pairs or merging them too quickly. The paper also translates the simulated populations into predicted detections for upcoming X-ray telescopes and argues that a large fraction of the DAGN it finds in EAGLE would fall in the LISA gravitational-wave detection region.
Load-bearing premise
The load-bearing premise is that the simulated AGN populations are reliable enough for pair counting even though their luminosity functions are not calibrated and are known to overproduce faint AGN in low-mass galaxies at high redshift; if that overproduction dominates the DAGN counts, the predicted densities, the z = 1–3 peak, and the local deficit would be artefacts of the subgrid physics rather than real astrophysics.
Editorial extensions
If this is right
- The predicted DAGN peak at z ≈ 1–3 means deep surveys should target cosmic noon: the AXIS Deep field is expected to recover about 10^-5 to 10^-3 cMpc^-3 of these systems at z = 2–3.
- If the simulated z = 0 shortfall is correct, local AGN-pair surveys are detecting systems that current feedback and merging recipes cannot reproduce, pointing to missing merger delays or overly prompt numerical merging.
- Restricting to bright, massive-MBH DAGN, as many observational samples do, changes both the fraction and its redshift evolution, so survey selection must be matched before comparing theory with data.
- At least 75 percent of the EAGLE DAGN identified by the paper fall in the LISA signal-to-noise region, meaning a dedicated electromagnetic survey of such systems could flag gravitational-wave progenitor candidates.
Reading between the lines
- Beyond the paper: if the z = 0 deficit is physical rather than a luminosity-function artefact, it implies the subgrid models merge massive black holes too promptly; a direct test would be to rerun one simulation with redshift-dependent dynamical-friction delays and see whether the local DAGN fraction rises to the observed value.
- Beyond the paper: the two-order-of-magnitude spread in predicted densities makes DAGN a sharper diagnostic of subgrid AGN physics than the overall AGN luminosity function, so matching a single upcoming DAGN survey could break degeneracies between seeding mass, accretion efficiency, and feedback.
- Beyond the paper: because the simulations only treat pairs in distinct galaxies, the consensus peak at z = 1–3 may underestimate the true DAGN abundance once same-galaxy pairs at separations below about 5 pkpc, which current surveys cannot resolve, are included; high-resolution zoom-in simulations could test this.
Editorial analysis
A structured set of objections, weighed in public.
Referee Report
Summary. This paper uses nine published large-scale cosmological hydrodynamical simulations (Illustris, TNG50/100/300, Horizon-AGN, EAGLE, SIMBA, BlueTides, and Astrid) to compute the number density, fraction, host-galaxy and MBH properties, and X-ray detectability of dual AGN, defined as two AGN with Lbol >= 1e43 erg/s in distinct galaxies with three-dimensional separation <= 30 pkpc. The main quantitative results are a DAGN number density spanning roughly 1e-8 to 1e-3 cMpc^-3 over z = 0-7, a peak in DAGN number density and fraction at z = 1-3, a claimed deficit of simulated DAGN at z = 0 relative to the constraints of Liu et al. (2011) and Koss et al. (2012), consistency with the Sandoval et al. (2023) upper limit at z ~ 3, and forecasts that future X-ray observatories, especially AXIS, should detect from a few to more than a hundred DAGN depending on survey and simulation.
Significance. The paper is a useful census that applies a uniform DAGN definition across nine simulations and systematically explores the sensitivity of the results to selection cuts in stellar mass, MBH mass, luminosity, and separation. Its qualitative conclusions, such as a DAGN peak at z = 1-3 and fractions of order a few percent, are likely robust to several modeling choices, and the AXIS/Athena detection forecasts with cosmic-variance estimates are a valuable forward-looking element. The authors are transparent about the uncalibrated nature of the simulated AGN luminosity functions and about the dependence of the results on definitions. However, the headline comparison at z = 0 is currently weakened by a mismatch between the simulated selection (3D separation, Lbol >= 1e43 erg/s) and the observed selections (projected separation, X-ray or emission-line thresholds), and the absolute number densities remain conditioned on the AGN luminosity-function normalizations of the host simulations. These issues need to be addressed before the quantitative claims, especially the claimed z = 0 deficit, can be taken at face value.
major comments (3)
- [Sec. 3.2.1 and Fig. 5 (also Abstract and Sec. 6)] The claim that all simulations produce too few DAGN at z = 0 is not yet securely established, because the simulated and observed samples are selected differently. The simulation selection uses a 3D separation d <= 30 pkpc and Lbol >= 1e43 erg/s, whereas Liu et al. (2011) use projected separations of 3.5-30 kpc with optical emission-line AGN selection and Koss et al. (2012) use L2-10keV > 1e42 erg/s at z < 0.05. Using Eq. (3), Lbol = 1e43 erg/s corresponds to Lx ~ 7.8e41 erg/s, so the simulated sample contains AGN fainter than the Koss threshold; conversely, a projected-separation cut can include pairs whose true 3D separation exceeds 30 pkpc. These two effects act in opposite directions, so the net bias on the simulated DAGN fraction is unknown. The analogous statement in the Fig. 6 caption that using 3D rather than projected separation 'does not impact the results here' is not supported by a calculation for the z = 0 constraints. Please recompute the DAGN fractions with projected separations and with the luminosity thresholds of the comparison samples, accounting for the redshift window of each survey, and report both the matched and unmatched values.
- [Sec. 3.1, Sec. 2.2, and Table A1] The absolute DAGN number densities are outputs of AGN populations whose luminosity functions are not calibrated and, as the paper notes in Sec. 2.2, overproduce faint AGN at z >= 4 relative to observational constraints (Habouzit et al. 2022). The 1e-8 to 1e-3 cMpc^-3 range quoted in the Abstract therefore mixes DAGN physics with AGN normalization differences between the simulations. The DAGN fraction partly cancels this normalization, but the denominator (total number of AGN) is itself affected by the overproduction of low-luminosity AGN in low-mass galaxies, so the fraction is not fully immune. Please add a robustness test, for example by reweighting or restricting the simulated AGN to the luminosity and host-stellar-mass range where each simulation's AGN luminosity function is in better agreement with observations, and state which of the paper's quantitative conclusions survive. At minimum, the high-redshift (z >= 4) DAGN densities should be explicitly labeled as conditional on the uncalibrated AGN luminosity function.
- [Sec. 3.2.1 and Fig. 5] The three fraction definitions shown in the rows of Fig. 5 are not all matched to the definitions used by the plotted observational constraints, yet the same observational points are repeated in every panel. Liu et al.'s 1.85% includes a correction for SDSS spectroscopic incompleteness and a projected-separation window of 3.5-30 kpc, while the simulation curves use 3D separations and no incompleteness correction; Koss et al.'s fraction is based on an X-ray-selected parent sample. Repeating the observational values in all panels makes the comparison look more exact than it is. Please place each observational constraint only in the panel(s) whose definition it matches, or state explicitly in the caption and text which rows are not directly comparable.
minor comments (6)
- [Abstract and Sec. 3.1.1] The minimum DAGN number density is quoted as 1e-8 cMpc^-3 in the Abstract and Conclusions but as 1e-7 cMpc^-3 in Sec. 3.1.1; unify these values after deciding whether the zero-DAGN cases are included in the quoted range.
- [Fig. B1] The label 'Koos et al. 2012' should read 'Koss et al. 2012'.
- [Title page and running text] There are several LaTeX and formatting artifacts, including 'MN L ATEX style file' on the title page and 'T able 1' and 'T able A1' in the text; these should be cleaned before final submission.
- [Sec. 3.1.1] In the paragraph discussing EAGLE, 'EAGLE MHBs' should be 'EAGLE MBHs'.
- [Sec. 3.2.1 and Fig. 5] The observed points from Liu et al. and Koss et al. are plotted without error bars, while the text notes that the observational error bars can be large and that the values are sensitive to definitions; please either add error bars or clearly state that the plotted values are central estimates.
- [Sec. 5.1] The detectability forecast discusses DAGN with separations larger than 30 pkpc for Athena, but the fiducial DAGN definition in the rest of the paper is d <= 30 pkpc; please clarify that this part intentionally extends the separation range.
Circularity Check
No significant circularity: the DAGN predictions are outputs of independent, previously published simulations, compared against external observational constraints; self-citations are contextual and not load-bearing.
full rationale
The paper's derivation chain is self-contained with respect to circularity. DAGN are defined in Section 2.3 as AGN with Lbol >= 1e43 erg/s and 3D separation <= 30 pkpc in distinct galaxies, applied to nine published simulation outputs. The luminosity computation (Eqs. 2-3) uses a fixed radiative efficiency and an external bolometric correction from Shen et al. (2020); no DAGN observational dataset is used to set any parameter. The choice epsilon_r = 0.1 is a physics assumption matched to AGN luminosity functions, not to the target DAGN statistics, so the DAGN number densities and fractions remain genuine outputs rather than fits. The comparisons in Section 3.2.1 and Figures 5-6 confront these outputs with external constraints (Liu et al. 2011; Koss et al. 2012; Sandoval et al. 2023; Silverman et al. 2020), making the claimed z = 0 deficit a falsifiable prediction. The self-citations (Habouzit et al. 2021, 2022; Volonteri et al. 2022; Rosas-Guevara et al. 2019; Chen et al. 2023) are used for methodology transfer, AGN luminosity-function context, and consistency checks, not as a uniqueness theorem or as the sole support for the central predictions; removing them would not collapse the argument. The projected-versus-3D separation mismatch noted in the Fig. 6 caption and relevant to the z = 0 comparison is a selection-effect concern for the observational comparison, but it is not a circular reduction of the predictions to the inputs.
Assumptions & free parameters
free parameters (4)
- Radiative efficiency epsilon_r =
0.1
- Shen et al. bolometric correction parameters alpha1, alpha2, beta1, beta2 =
12.60, 4.073, 0.278, -0.026
- XRB scaling relation parameters =
10^29.15, 10^39.73, slopes 1 and 1.3
- Selection thresholds: Lbol >= 1e43 erg/s, d <= 30 pkpc, M* >= 1e9 Msun =
as stated
assumptions (3)
- domain assumption AGN populations in the nine simulations are reliable enough for DAGN statistics despite known luminosity function discrepancies
- domain assumption Simulated 3D separations map to projected separations without large bias
- domain assumption Central/satellite classifications from different group catalogs are comparable
Cite this review
Pith. "Pith review of Large-scale dual AGN in large-scale cosmological hydrodynamical simulations." pith.science (2026). https://pith.science/paper/GMKJW2Q5
@misc{pith2026241115297,
  author       = {Pith},
  title        = {Pith review of: Large-scale dual AGN in large-scale cosmological hydrodynamical simulations},
  year         = {2026},
  howpublished = {\url{https://pith.science/paper/GMKJW2Q5}},
  note         = {Machine review of arXiv:2411.15297}
}
read the original abstract
Detecting dual active galactic nuclei (DAGN) in observations and understanding theoretically which massive black holes (MBHs) compose them and in which galactic and large-scale environment they reside are becoming increasingly important questions as we enter the multi-messenger era of MBH astronomy. This paper presents the abundance and properties of DAGN produced in nine large-scale cosmological hydrodynamical simulations. We focus on DAGN powered by AGN with Lbol > 1e43 erg/s and belonging to distinct galaxies, i.e. pairs that can be characterised with current and near-future electromagnetic observations. We find that the number density of DAGN separated by a few to 30 proper kpc varies from 1e-8 (or none) to 1e-3 comoving Mpc^3 in the redshift range z=0-7. At a given redshift, the densities of the DAGN numbers vary by up to two orders of magnitude from one simulation to another. However, for all simulations, the DAGN peak is in the range z=1-3, right before the peak of cosmic star formation or cosmic AGN activity. The corresponding fractions of DAGN (with respect to the total number of AGN) range from 0 to 6 percent. We find that simulations could produce too few DAGN at z=0 (or merge pairs too quickly) compared to current observational constraints while being consistent with preliminary constraints at high redshift (z = 3). Next-generation observatories (e.g., AXIS) will be of paramount importance to detect DAGN across cosmic times. We predict the detectability of DAGN with future X-ray telescopes and discuss DAGN as progenitors for future LISA gravitational wave detections.
Figures


Figures from the paper (15 more)




Reference graph
Works this paper leans on
-
[1]
, " * write output.state after.block = add.period write newline
ENTRY address author booktitle chapter edition editor howpublished institution journal key month note number organization pages publisher school series title type volume year label extra.label sort.label short.list INTEGERS output.state before.all mid.sentence after.sentence after.block FUNCTION init.state.consts #0 'before.all := #1 'mid.sentence := #2 '...
-
[2]
write newline
" write newline "" before.all 'output.state := FUNCTION n.dashify 't := "" t empty not t #1 #1 substring "-" = t #1 #2 substring "--" = not "--" * t #2 global.max substring 't := t #1 #1 substring "-" = "-" * t #2 global.max substring 't := while if t #1 #1 substring * t #2 global.max substring 't := if while FUNCTION word.in bbl.in " " * FUNCTION format....
-
[3]
Aird J. et al. , 2010, , 401, 2531
2010
-
[4]
Amaro-Seoane P. et al. , 2023, Living Reviews in Relativity, 26, 2
2023
-
[5]
F., 2017 a , , 464, 2840
Angl \'e s-Alc \'a zar D., Dav \'e R., Faucher-Gigu \`e re C.-A., \"O zel F., Hopkins P. F., 2017 a , , 464, 2840
2017
-
[6]
F., Feldmann R., Torrey P., Wetzel A., Kere s D., 2017 b , , 472, L109
Angl \'e s-Alc \'a zar D., Faucher-Gigu \`e re C.-A., Quataert E., Hopkins P. F., Feldmann R., Torrey P., Wetzel A., Kere s D., 2017 b , , 472, L109
2017
-
[7]
Angl \'e s-Alc \'a zar D., \"O zel F., Dav \'e R., 2013, , 770, 5
2013
-
[8]
A., Oppenheimer B
Angl \'e s-Alc \'a zar D., \"O zel F., Dav \'e R., Katz N., Kollmeier J. A., Oppenheimer B. D., 2015, , 800, 127
2015
Show all 108 references
-
[9]
Bah \'e Y. M. et al. , 2022, , 516, 167
2022
-
[10]
Baron D., M \'e nard B., 2019, , 487, 3404
2019
-
[11]
S., Sandberg Lacy C
Barrows R. S., Sandberg Lacy C. H., Kennefick J., Comerford J. M., Kennefick D., Berrier J. C., 2013, , 769, 95
2013
-
[12]
C., Blandford R
Begelman M. C., Blandford R. D., Rees M. J., 1980, , 287, 307
1980
-
[13]
K., Di Matteo T., Myers A
Bhowmick A. K., Di Matteo T., Myers A. D., 2020, , 492, 5620
2020
-
[14]
Bird S., Ni Y., Di Matteo T., Croft R., Feng Y., Chen N., 2022, , 512, 3703
2022
-
[15]
Buchner J. et al. , 2015, , 802, 89
2015
-
[16]
R., Dotti M., Volonteri M., Mayer L., Bellovary J
Capelo P. R., Dotti M., Volonteri M., Mayer L., Bellovary J. M., Shen S., 2017, , 469, 4437
2017
-
[17]
R., Volonteri M., Dotti M., Bellovary J
Capelo P. R., Volonteri M., Dotti M., Bellovary J. M., Mayer L., Governato F., 2015, , 447, 2123
2015
-
[18]
Cappelluti N. et al. , 2023, arXiv e-prints, arXiv:2311.07669
2023 arXiv
-
[19]
Chen N. et al. , 2023, , 522, 1895
2023
-
[20]
Chen N. et al. , 2023, Monthly Notices of the Royal Astronomical Society, stad834
2023
-
[21]
Chen N. et al. , 2022 a , , 514, 2220
2022
-
[22]
Chen N., Ni Y., Tremmel M., Di Matteo T., Bird S., DeGraf C., Feng Y., 2022 b , , 510, 531
2022
-
[23]
L., Yang Q., Li J
Chen Y.-C., Hwang H.-C., Shen Y., Liu X., Zakamska N. L., Yang Q., Li J. I., 2022 c , , 925, 162
2022
-
[24]
Ciurlo A. et al. , 2023, , 671, L4
2023
-
[25]
Civano F. et al. , 2016, VizieR Online Data Catalog, J/ApJ/819/62
2016
-
[26]
M., Pooley D., Barrows R
Comerford J. M., Pooley D., Barrows R. S., Greene J. E., Zakamska N. L., Madejski G. M., Cooper M. C., 2015, , 806, 219
2015
-
[27]
M., Pooley D., Gerke B
Comerford J. M., Pooley D., Gerke B. F., Madejski G. M., 2011, , 737, L19
2011
-
[28]
Crain R. A. et al. , 2015, , 450, 1937
2015
-
[29]
H., Appleby S., 2019, , 486, 2827
Dav \'e R., Angl \'e s-Alc \'a zar D., Narayanan D., Li Q., Rafieferantsoa M. H., Appleby S., 2019, , 486, 2827
2019
-
[30]
L., Graham A
Davis B. L., Graham A. W., Cameron E., 2018, , 869, 113
2018
-
[31]
M., Shiralilou B., Piana O., Choudhury T
Dayal P., Rossi E. M., Shiralilou B., Piana O., Choudhury T. R., Volonteri M., 2019, , 486, 2336
2019
-
[32]
De Rosa A. et al. , 2019, , 86, 101525
2019
-
[33]
De Rosa A. et al. , 2023, , 519, 5149
2023
-
[34]
Di Matteo T., Angles-Alcazar D., Shankar F., 2023, arXiv e-prints, arXiv:2304.11541
2023 arXiv
-
[35]
Dubois Y., Peirani S., Pichon C., Devriendt J., Gavazzi R., Welker C., Volonteri M., 2016, , 463, 3948
2016
-
[36]
A., Bird S., Battaglia N., Wilkins S., 2016, , 455, 2778
Feng Y., Di-Matteo T., Croft R. A., Bird S., Battaglia N., Wilkins S., 2016, , 455, 2778
2016
-
[37]
Foord A. et al. , 2023, arXiv e-prints, arXiv:2311.07664
2023 arXiv
-
[38]
M., Hodges-Kluck E., Barrows R
Foord A., G \"u ltekin K., Nevin R., Comerford J. M., Hodges-Kluck E., Barrows R. S., Goulding A. D., Greene J. E., 2020, , 892, 29
2020
-
[39]
C., Koss M
Foord A., G \"u ltekin K., Runnoe J. C., Koss M. J., 2021, , 907, 71
2021
-
[40]
\'E ., An T., Frey S., Komossa S., Paragi Z., Hong X
Gab \'a nyi K. \'E ., An T., Frey S., Komossa S., Paragi Z., Hong X. Y., Shen Z. Q., 2016, , 826, 106
2016
-
[41]
Genel S. et al. , 2014, , 445, 175
2014
-
[42]
Georgakakis A. et al. , 2015, , 453, 1946
2015
-
[43]
Gilli R. et al. , 2022, , 666, A17
2022
-
[44]
M., Habouzit M., Ba \ n ados E., Afonso P
Greiner J., Bolmer J., Yates R. M., Habouzit M., Ba \ n ados E., Afonso P. M. J., Schady P., 2021, , 654, A79
2021
-
[45]
Habouzit M. et al. , 2020, arXiv e-prints, arXiv:2006.10094
2020 arXiv
-
[46]
Habouzit M. et al. , 2021, , 503, 1940
2021
-
[47]
Habouzit M. et al. , 2022, , 509, 3015
2022
-
[48]
Habouzit M., Volonteri M., Dubois Y., 2017, Monthly Notices of the Royal Astronomical Society, 468, 3935
2017
-
[49]
Haidar H. et al. , 2022, , 514, 4912
2022
-
[50]
Haiman Z. et al. , 2023, arXiv e-prints, arXiv:2306.14990
2023 arXiv
-
[51]
Hirschmann M., Dolag K., Saro A., Bachmann L., Borgani S., Burkert A., 2014, , 442, 2304
2014
-
[52]
F., Richards G
Hopkins P. F., Richards G. T., Hernquist L., 2007, ApJ, 654, 731
2007
-
[53]
Ishikawa Y. et al. , 2024, arXiv e-prints, arXiv:2403.08098
2024 arXiv
-
[54]
Izquierdo-Villalba D., Sesana A., Bonoli S., Colpi M., 2022, , 509, 3488
2022
-
[55]
L., Kelley L
Katz M. L., Kelley L. Z., Dosopoulou F., Berry S., Blecha L., Larson S. L., 2020, , 491, 2301
2020
-
[56]
Kaviraj S. et al. , 2017, , 467, 4739
2017
-
[57]
Z., Blecha L., Hernquist L., Sesana A., Taylor S
Kelley L. Z., Blecha L., Hernquist L., Sesana A., Taylor S. R., 2017, , 471, 4508
2017
-
[58]
Kocevski D. D. et al. , 2018, VizieR Online Data Catalog, J/ApJS/236/48
2018
-
[59]
Koss M., Mushotzky R., Treister E., Veilleux S., Vasudevan R., Trippe M., 2012, , 746, L22
2012
-
[60]
Koss M. J. et al. , 2023, , 942, L24
2023
-
[61]
Lehmer B. D. et al. , 2019, , 243, 3
2019
-
[62]
Li J., Zhuang M.-Y., Shen Y., Volonteri M., Chen N., Di Matteo T., 2024, arXiv e-prints, arXiv:2405.14980
2024 arXiv
-
[63]
Li Y. et al. , 2020, , 895, 102
2020
-
[64]
A., Hao L., 2011, , 737, 101
Liu X., Shen Y., Strauss M. A., Hao L., 2011, , 737, 101
2011
-
[65]
Luo B. et al. , 2017, , 228, 2
2017
-
[66]
Mannucci F. et al. , 2022, Nature Astronomy, 6, 1185
2022
-
[67]
Mannucci F. et al. , 2023, arXiv e-prints, arXiv:2305.07396
2023 arXiv
-
[68]
G., Harrison C
McAlpine S., Bower R. G., Harrison C. M., Crain R. A., Schaller M., Schaye J., Theuns T., 2017, , 468, 3395
2017
-
[69]
G., Rosario D
McAlpine S., Bower R. G., Rosario D. J., Crain R. A., Schaye J., Theuns T., 2018, , 481, 3118
2018
-
[70]
Merloni A., 2004, , 353, 1035
2004
-
[71]
M., Nevin R., Barrows R
M \"u ller-S \'a nchez F., Comerford J. M., Nevin R., Barrows R. S., Cooper M. C., Greene J. E., 2015, , 813, 103
2015
-
[72]
Nandra K. et al. , 2013, arXiv e-prints, arXiv:1306.2307
2013 arXiv
-
[73]
Nandra K. et al. , 2015, VizieR Online Data Catalog, J/ApJS/220/10
2015
-
[74]
Ni Y. et al. , 2022, , 513, 670
2022
-
[75]
Perna M. et al. , 2023 a , arXiv e-prints, arXiv:2310.03067
2023 arXiv
-
[76]
Perna M. et al. , 2023 b , , 679, A89
2023
-
[77]
Pfister H., Volonteri M., Dubois Y., Dotti M., Colpi M., 2019, , 486, 101
2019
-
[78]
Pillepich A. et al. , 2018 a , , 473, 4077
2018
-
[79]
Pillepich A. et al. , 2018 b , , 473, 4077
2018
-
[80]
H., Naab T., Lah \'e n N., Sawala T., 2017, , 840, 53
Rantala A., Pihajoki P., Johansson P. H., Naab T., Lah \'e n N., Sawala T., 2017, , 840, 53
2017
-
[81]
E., Volonteri M., 2015, , 813, 82
Reines A. E., Volonteri M., 2015, , 813, 82
2015
-
[82]
Reynolds C. S. et al. , 2023, arXiv e-prints, arXiv:2311.00780
2023 arXiv
-
[83]
Ricarte A., Natarajan P., 2018, , 481, 3278
2018
-
[84]
G., Schaye J., McAlpine S., Dalla Vecchia C., Frenk C
Rosas-Guevara Y., Bower R. G., Schaye J., McAlpine S., Dalla Vecchia C., Frenk C. S., Schaller M., Theuns T., 2016, , 462, 190
2016
-
[85]
M., Bower R
Rosas-Guevara Y. M., Bower R. G., McAlpine S., Bonoli S., Tissera P. B., 2019, , 483, 2712
2019
-
[86]
Rosas-Guevara Y. M. et al. , 2015, , 454, 1038
2015
-
[87]
G., Theuns T., McAlpine S., Schaller M., Crain R
Salcido J., Bower R. G., Theuns T., McAlpine S., Schaller M., Crain R. A., Schaye J., Regan J., 2016, , 463, 870
2016
-
[88]
Sandoval B. et al. , 2023, arXiv e-prints, arXiv:2312.02311
2023 arXiv
-
[89]
Schaye J. et al. , 2015, , 446, 521
2015
-
[90]
Schirra A. P. et al. , 2021, , 508, 4816
2021
-
[91]
Scialpi M. et al. , 2024, , 690, A57
2024
-
[92]
Sesana A., Volonteri M., Haardt F., 2007, , 377, 1711
2007
-
[93]
F., Faucher-Gigu \`e re C.-A., Alexander D
Shen X., Hopkins P. F., Faucher-Gigu \`e re C.-A., Alexander D. M., Richards G. T., Ross N. P., Hickox R. C., 2020, , 495, 3252
2020
-
[94]
Shen Y. et al. , 2023 a , arXiv e-prints, arXiv:2306.15527
2023 arXiv
-
[95]
Shen Y. et al. , 2023 b , , 943, 38
2023
-
[96]
Silverman J. D. et al. , 2020, , 899, 154
2020
-
[97]
S., Dav \'e R., 2015, , 53, 51
Somerville R. S., Dav \'e R., 2015, , 53, 51
2015
-
[98]
Thomas N., Dav \'e R., Angl \'e s-Alc \'a zar D., Jarvis M., 2019, , 487, 5764
2019
-
[99]
Thomas N., Dav \'e R., Angl \'e s-Alc \'a zar D., Jarvis M., 2019, Monthly Notices of the Royal Astronomical Society, 487, 5764
2019
-
[100]
J., Angles-Alcazar D., 2020, arXiv e-prints, arXiv:2010.11225
Thomas N., Dave R., Jarvis M. J., Angles-Alcazar D., 2020, arXiv e-prints, arXiv:2010.11225
2020 arXiv
-
[101]
R., 2015, , 451, 1868
Tremmel M., Governato F., Volonteri M., Quinn T. R., 2015, , 451, 1868
2015
-
[102]
Vogelsberger M. et al. , 2014, , 444, 1518
2014
-
[103]
Volonteri M., Dubois Y., Pichon C., Devriendt J., 2016, , 460, 2979
2016
-
[104]
Volonteri M., Pfister H., Beckmann R., Dotti M., Dubois Y., Massonneau W., Musoke G., Tremmel M., 2022, , 514, 640
2022
-
[105]
Volonteri M. et al. , 2020, , 498, 2219
2020
-
[106]
Weinberger R. et al. , 2018, , 479, 4056
2018
-
[107]
Yue M., Fan X., Yang J., Wang F., 2021, , 921, L27
2021
-
[108]
Yue M., Fan X., Yang J., Wang F., 2023, , 165, 191
2023
Reviewed August 12, 2026 · model on record in the stance chip above.
Discussion (0). Continue with ORCID to comment.