REVIEW 3 major objections 6 minor 40 references
Single-Shot Ionization-Based Transverse Profile Monitor for Pulsed Electron Beams
T0 review · 3 major / 6 minor · reviewed 2026-08-12 · deepseek-v4-flash
Pith's one-line read The paper demonstrates a single-shot, non-destructive transverse profile monitor for electron beams, imaging ions from a pulsed nitrogen jet with measured resolution below 0.07 mm rms.
desk verdict Single-shot gas-jet ionization profile monitor works, but the sub-0.1 mm resolution claim is not yet evidenced. read the letter →
The pith
A machine-rendered reading of the paper's core claim, the machinery that carries it, and where it could break.
The reading
What carries the argument
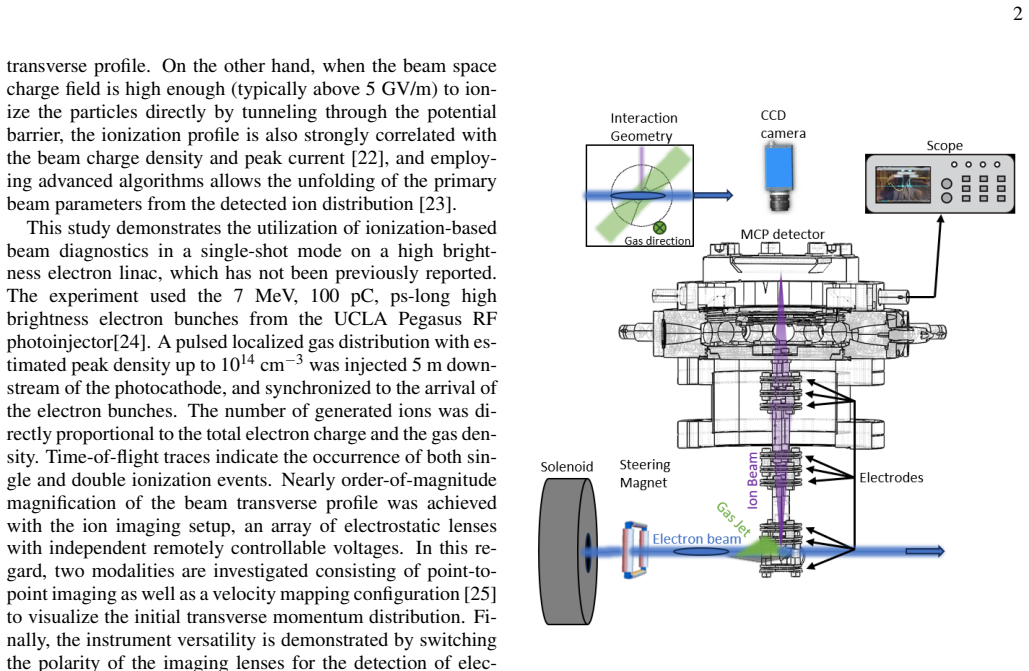
The central object is the gas sheet monitor: a pulsed nitrogen jet with peak density near $10^{13}$--$10^{14}$ cm$^{-3}$ and an extent of about 2 mm, crossed by the electron bunch, followed by a nine-ring electrostatic lens column and a microchannel-plate detector. The column carries the argument: in point-to-point imaging mode the transport matrix element $R_{12}$ is tuned to zero so each final ion position encodes only its initial position, while in velocity-map-imaging mode $R_{11}$ is tuned to zero so each final position encodes only the initial transverse velocity; particle-tracking simulations supply the voltage setpoints for both conditions. A time-of-flight readout on the detector input identifies the ion species and independently benchmarks the transport model.
What would settle it
Measure the monitor's reconstructed beam size while varying the gas density at fixed beam parameters, or compare its single-shot profile against a temporary intercepting screen at the same location; if the image width shifts with gas density or disagrees with the screen by more than the claimed $0.07$ mm rms resolution, the faithful-imaging premise fails.
Extended reading notes
Core claim
The central claim is that the transverse distribution of ions produced by impact ionization of a dilute gas jet is a faithful, magnifiable imprint of a relativistic electron bunch's transverse profile, and that imaging that distribution on a microchannel plate yields the bunch size and centroid in a single pass. The authors show that the detected ion yield scales linearly with bunch charge and gas density, consistent with impact ionization as the dominant channel, and that the time-of-flight spectrum contains distinct peaks for multiple ion species with different charge-to-mass ratios. A nine-ring electrostatic column tuned with particle-tracking simulations reaches an imaging condition ($R_{12}=0$) with measured magnification $R_{11}=3.2$, and a velocity-mapping condition ($R_{11}=0$) with $R_{12}=-66$ m. In imaging mode, single-ion hits on the detector give a point-spread function of $0.19$ mm rms, corresponding to better than $0.07$ mm rms resolution at the beam once the magnification is divided out.
Load-bearing premise
The ion pattern recorded on the detector is assumed to be a faithful picture of the electron beam's transverse profile, which requires the gas target to be uniform over the beam, ionization to be mostly single-impact, and space-charge forces not to bend the ion trajectories during extraction.
Editorial extensions
If this is right
- An accelerator operator could tag every bunch with its transverse centroid and rms size, enabling shot-to-shot feedback rather than multi-shot averaged profiles.
- Because the gas density stays below $10^{15}$ cm$^{-3}$, the beam loses only a tiny fraction of its energy in the interaction, so the monitor can serve where intercepting screens or wires would be damaged.
- Gating the microchannel plate to the arrival time of one ion species would exclude the other ionization products and sharpen the image.
- Reversing the column polarity detects secondary electrons instead of ions, providing a second readout channel from the same gas interaction.
- At higher bunch densities, field ionization would add a signal component tied to peak current, potentially unfolding bunch length from the same apparatus.
Reading between the lines
- The measured 2 mm gas-jet width is larger than the 1.19 mm rms beam waist, so the quoted below-$0.07$ mm resolution belongs to small beams; deconvolving the gas profile would extend the same apparatus to larger beams, a step the paper leaves for future work.
- The clean time-of-flight separation of distinct ion species suggests the instrument could double as a relativistic-energy ionization cross-section measurement tool, an application the authors flag but do not quantify.
- Velocity-mapping mode with a short laser trigger could in principle map secondary-electron momentum against ionization time, giving access to the primary beam's space-charge field at the interaction point.
- If field ionization becomes reachable at higher charge density, the ratio of field-ionized to impact-ionized signal could serve as a built-in peak-current monitor, extending the diagnostic beyond transverse profiles.
Editorial analysis
A structured set of objections, weighed in public.
Referee Report
Summary. The manuscript reports a proof-of-principle experiment of a gas-sheet monitor that images ions produced by impact ionization of a pulsed nitrogen jet by 7 MeV electron bunches, using an electrostatic lens column and MCP detector. The authors demonstrate imaging and velocity-map modes, measure time-of-flight spectra identifying N2+, N2++/N+, and N2+++, observe a linear ion yield versus bunch charge, and benchmark transport coefficients (R11 = 3.2, R12 = -66 m) against GPT simulations. They perform a solenoid scan and compare the measured ion-beam rms size with a start-to-end GPT simulation of the Pegasus beamline, obtaining a 1.19 mm waist. The paper claims a single-shot transverse profile measurement with sub-0.1 mm resolution after accounting for a 0.19 mm detector point-spread function.
Significance. If the resolution and single-shot claims survive scrutiny, this is a valuable non-destructive diagnostic for high-intensity electron beams, with potential for single-bunch tagging and velocity-map imaging of secondary electrons. The paper's strengths are the quantitative cross-check of the transport model against centroid and time-of-flight data, the demonstration of two distinct modalities, and the explicit scaling of ion yield with charge and gas density. The internal consistency of the data is good. However, the central quantitative claims—absolute beam-size accuracy and sub-0.1 mm resolution—currently rest on an undocumented PSF estimate and a partially self-referential GPT comparison, so the significance is conditional on addressing these points.
major comments (3)
- [Conclusion (p. 7)] The claim that the rms spatial resolution is below 0.07 mm rests on a 0.19 mm rms point-spread function 'estimated from the single ion hits', but no single-ion-hit data, estimation procedure, fit, or uncertainty is presented anywhere in the paper. Furthermore, the quoted resolution accounts only for the detector PSF; it ignores residual R12 in the imaging condition, electrostatic lens aberrations (which the authors themselves note as non-linearities for large steering offsets in Sec. III), and the non-uniform gas density across the beam. Please provide the PSF measurement and a breakdown of all resolution terms before the sub-0.1 mm claim can be accepted.
- [Sec. III, solenoid scan (Fig. 6)] The absolute accuracy of the transverse size measurement is not established. The measured ion distribution is proportional to the product n_gas(x,y) * n_e(x,y); the gas-jet extent is stated to be 'close to 2 mm' and is inferred from the same solenoid-scan data, while the GPT-predicted waist is 1.19 mm rms. Thus the gas-density variation across the beam is not negligible, and no deconvolution or independent gas-density measurement is presented. The stated 'good agreement' with the GPT start-to-end simulation is therefore not an independent validation of the beam-size measurement; an independent beam-size diagnostic (e.g., a wire scanner or OTR screen before or after the GSM) is needed.
- [Abstract and Sec. III] The paper's central claim is single-shot operation, but it is never documented whether the MCP/CCD images used for the profile analysis correspond to a single electron bunch or to an accumulation over several bunches. Please state this explicitly, show a representative single-shot image with its intensity projection, and provide the signal-to-noise ratio for a single bunch. Without this, the single-shot nature of the diagnostic is not demonstrated.
minor comments (6)
- [Introduction, p. 1] There is a typo: 'in the from of' should read 'in the form of'.
- [Sec. II, Eq. (1)] The definitions of the areas A1 and A2 are not fully explicit; please clarify the geometry and state whether 'peak gas number density' n is in cm^-3 and how the 10^13-10^14 cm^-3 range is obtained from the formula.
- [Fig. 4(c)] Please provide the details of the GPT fit used to map the steering setting to the initial vertical position ye, including the number of free parameters and the fit uncertainties; otherwise the offset of the horizontal axis is not reproducible.
- [Sec. III, solenoid scan] The statement that the gas-jet spatial extent is 'close to 2 mm' should specify whether this is an rms, FWHM, or total width, and how it is estimated from the nozzle geometry; this quantity is essential for assessing the convolution limit in Fig. 6.
- [Sec. II, MCP description] The homogeneity of the MCP response over the used central area is not quantified; please state the assumed uniformity or provide a flat-field correction for the region of interest.
- [Sec. IV, space-charge discussion] The claim that the primary-beam space-charge expansion factor is negligible for the Pegasus parameters is supported only by a one-sentence estimate; please add the explicit calculation or a reference to the equation in Ref. [37].
Circularity Check
No significant circularity: the profile measurement rests on an empirical steering-scan calibration and external cross-section/beamline-simulation checks, not on a self-defined equivalence.
full rationale
The paper's central claim, that the ion image divided by the independently measured magnification R11=3.2 gives the electron-beam transverse size, is an instrument calibration chain rather than a constructed identity. The magnification is obtained from a steering scan (Fig. 5a) in which the electron beam centroid is moved and the ion-image centroid response is measured with a linear fit; this is a direct calibration, not a fitted prediction. The time-of-flight peaks are assigned to ion species by charge-to-mass ratios and their relative yields are compared with literature cross-section data (Sec. III), and the ion-yield estimate uses NIST cross sections and the Bethe-Bloch-type formula (Eqs. 2-3), all external inputs that do not already contain the target profile. The solenoid-scan beam sizes are compared with a GPT start-to-end simulation; although the authors contributed to this simulation ecosystem, the simulation is a beamline model built from photoinjector physics rather than a fit to the GSM output, so the agreement is a consistency check, not a reduction of the measurement to the input. The finite gas-jet size (~2 mm) is explicitly acknowledged to limit the largest measurable beams, and no deconvolution is applied; that is a correctness/accuracy limitation, not circular reasoning. The conclusion's 0.19 mm rms PSF estimate from single ion hits is not documented in the text, but an undocumented measurement is a lack of evidence, not a circular derivation. No equation, fit, or calibration in the paper reduces by construction to the claimed profile measurement, so no circular step is exhibited.
Assumptions & free parameters
assumptions (5)
- domain assumption Impact ionization is the dominant process and the transverse ion distribution faithfully represents the beam profile when the gas distribution is much larger than the beam.
- domain assumption The effusive gas-flow model (Eq. 1) gives the interaction-point density with laminar flow.
- standard math The Bethe-Bloch-like energy-loss formula (Eq. 2) and ionization potential epsilon yield the ion charge (Eq. 3).
- domain assumption GPT/POISSON simulation accurately models the ion transport through the electrostatic column.
- domain assumption Primary beam space-charge effects on ion transport are negligible for Pegasus parameters.
Cite this review
Pith. "Pith review of Single-Shot Ionization-Based Transverse Profile Monitor for Pulsed Electron Beams." pith.science (2026). https://pith.science/paper/KZH7EYH3
@misc{pith2026241115460,
  author       = {Pith},
  title        = {Pith review of: Single-Shot Ionization-Based Transverse Profile Monitor for Pulsed Electron Beams},
  year         = {2026},
  howpublished = {\url{https://pith.science/paper/KZH7EYH3}},
  note         = {Machine review of arXiv:2411.15460}
}
abstract
We present an experimental demonstration of a single-shot, non-destructive electron beam diagnostic based on the ionization of a low-density pulsed gas jet. In our study, 7~MeV electron bunches from a radio frequency (RF) photoinjector, carrying up to 100 pC of charge, traversed a localized distribution of nitrogen gas (N$_2$). The interaction of the electron bunches with the N$_2$ gas generated a correlated signature in the ionized particle distribution, which was spatially magnified using a series of electrostatic lenses and recorded with a micro-channel-plate detector. Various modalities, including point-to-point imaging and velocity mapping, are investigated. A temporal trace of the detector current enabled the identification of single- and double-ionization events. The characteristics of the ionization distribution, dependence on gas density, total bunch charge, and other parameters, are described. Approaches to scaling to higher electron bunch density and energy are suggested. Additionally, the instrument proves useful for comprehensive studies of the ionization process itself.
Figures


Figures from the paper (3 more)


Reference graph
Works this paper leans on
-
[1]
Developments in laser-driven plasma accelerators,
Simon Martin Hooker, “Developments in laser-driven plasma accelerators,” Nature Photonics 7, 775–782 (2013)
work page 2013
-
[2]
A third much smaller peak at 0.65 µs which would cor- respond to a charge to mass ratio of 4 could also be distin- guished. It is worth noting that while the heights of the peaks varied in relation to changes made to the electron beam fo- cusing and steering, their relative ratio and time separations remained constant. We attributed the different peaks to...
-
[3]
Advances in bright electron sources,
P Musumeci, J Giner Navarro, JB Rosenzweig, L Cultrera, I Bazarov, J Maxson, S Karkare, and H Padmore, “Advances in bright electron sources,” Nuclear Instruments and Methods in Physics Research Section A: Accelerators, Spectrometers, De- tectors and Associated Equipment 907, 209–220 (2018)
work page 2018
-
[4]
Facet- ii facility for advanced accelerator experimental tests,
V Yakimenko, L Alsberg, E Bong, G Bouchard, C Clarke, C Emma, S Green, C Hast, MJ Hogan, J Seabury,et al., “Facet- ii facility for advanced accelerator experimental tests,” Physical Review Accelerators and Beams 22, 101301 (2019)
work page 2019
-
[5]
Diagnostics for plasma-based electron accelera- tors,
Mike C Downer, R Zgadzaj, A Debus, U Schramm, and MC Kaluza, “Diagnostics for plasma-based electron accelera- tors,” Reviews of Modern Physics90, 035002 (2018)
work page 2018
-
[6]
Spatial resolution in opti- cal transition radiation beam diagnostics,
M. Castellano and V . A. Verzilov, “Spatial resolution in opti- cal transition radiation beam diagnostics,” Phys. Rev. ST Accel. Beams 1, 062801 (1998)
work page 1998
-
[7]
Scintillating screen applications in accelerator beam diagnostics,
B Walasek-Hohne, C Andre, P Forck, E Gutlich, G Kube, P Lecoq, and A Reiter, “Scintillating screen applications in accelerator beam diagnostics,” IEEE Transactions on nuclear science 59, 2307–2312 (2012)
work page 2012
-
[8]
Fast wire scanner for intense electron beams,
T. Moore, N. I. Agladze, I. V . Bazarov, A. Bartnik, J. Dobbins, B. Dunham, S. Full, Y . Li, X. Liu, J. Savino, and K. Smolenski, “Fast wire scanner for intense electron beams,” Phys. Rev. ST Accel. Beams 17, 022801 (2014)
work page 2014
Show all 40 references
-
[9]
De- sign and experimental tests of free electron laser wire scanners,
GL Orlandi, P Heimgartner, R Ischebeck, C Ozkan Loch, S Trovati, P Valitutti, V Schlott, M Ferianis, and G Penco, “De- sign and experimental tests of free electron laser wire scanners,” Physical Review Accelerators and Beams 19, 092802 (2016)
2016
-
[10]
Nondestructive beam pro- file detection systems for the zero gradient synchrotron,
F Hornstra and William H DeLuca, “Nondestructive beam pro- file detection systems for the zero gradient synchrotron,” in Proc. VI Conference on High Energy Acceleration, Cambridge, MA (1967) pp. 374–377
1967
-
[11]
A residual-gas ionization beam profile monitor for the heidelberg test storage ring tsr,
B Hochadel, F Albrecht, M Grieser, D Habs, D Schwalm, E Sz- mola, and A Wolf, “A residual-gas ionization beam profile monitor for the heidelberg test storage ring tsr,” Nuclear Instru- ments and Methods in Physics Research Section A: Accelera- tors, Spectrometers, Detectors an...
1994
-
[12]
Introducing timepix2, a frame-based pixel detector read- out asic measuring energy deposition and arrival time,
WS Wong, J Alozy, R Ballabriga, M Campbell, I Kremastio- tis, X Llopart, T Poikela, V Sriskaran, L Tlustos, and D Ture- cek, “Introducing timepix2, a frame-based pixel detector read- out asic measuring energy deposition and arrival time,” Radia- tion Measurements 131, 106230 (2020)
2020
-
[13]
A study of the gain of microchannel plates in the ionization profile monitors at fermilab,
R Thurman-Keup, D Slimmer, C Lundberg, and JR Zagel, “A study of the gain of microchannel plates in the ionization profile monitors at fermilab,” arXiv preprint arXiv:2310.01300 (2023)
2023 arXiv
-
[14]
Development of residual gas profile monitors at gsi,
T Giacomini, S Barabin, P Forck, D Liakin, and V Skachkov, “Development of residual gas profile monitors at gsi,” in AIP Conference Proceedings , V ol. 732 (American Institute of Physics, 2004) pp. 286–293
2004
-
[15]
A non-invasive beam profile monitor for charged particle beams,
Vasilis Tzoganis and Carsten P Welsch, “A non-invasive beam profile monitor for charged particle beams,” Applied Physics Letters 104 (2014)
2014
-
[16]
A gas curtain beam profile monitor using beam induced flu- orescence for high intensity charged particle beams,
A Salehilashkajani, HD Zhang, M Ady, N Chritin, P Forck, J Glutting, OR Jones, R Kersevan, N Kumar, T Lefevre, et al., “A gas curtain beam profile monitor using beam induced flu- orescence for high intensity charged particle beams,” Applied Physics Letters 120 (2022)
2022
-
[17]
Design and first operation of a supersonic gas jet based beam profile monitor,
Vasilis Tzoganis, Hao D Zhang, Adam Jeff, and Carsten P Welsch, “Design and first operation of a supersonic gas jet based beam profile monitor,” Physical Review Accelerators and Beams 20, 062801 (2017)
2017
-
[18]
Characterization of a supersonic molecular beam for charged 9 particle beam profile monitor,
HD Zhang, A Salehilashkajani, O Sedlacek, and CP Welsch, “Characterization of a supersonic molecular beam for charged 9 particle beam profile monitor,” Vacuum208, 111701 (2023)
2023
-
[19]
High- intensity beam profile measurement using a gas sheet monitor by beam induced fluorescence detection,
Ippei Yamada, Motoi Wada, Katsuhiro Moriya, Junichiro Kamiya, Pranab Kumar Saha, and Michikazu Kinsho, “High- intensity beam profile measurement using a gas sheet monitor by beam induced fluorescence detection,” Physical Review Ac- celerators and Beams 24, 042801 (2021)
2021
-
[21]
Plasma photonic spatiotemporal synchroniza- tion of relativistic electron and laser beams,
P. Scherkl, A. Knetsch, T. Heinemann, A. Sutherland, A. F. Habib, O. S. Karger, D. Ullmann, A. Beaton, G. G. Manahan, Y . Xi, A. Deng, M. D. Litos, B. D. O’Shea, S. Z. Green, C. I. Clarke, G. Andonian, R. Assmann, D. L. Bruhwiler, J. Smith, J. R. Cary, M. J. Hogan, V . Yakimen...
2022
-
[22]
Characterization of a non- destructive beam profile monitor using luminescent emission,
A Variola, R Jung, and G Ferioli, “Characterization of a non- destructive beam profile monitor using luminescent emission,” Physical Review Special Topics-Accelerators and Beams 10, 122801 (2007)
2007
-
[23]
Transverse space-charge field-induced plasma dynamics for ultraintense electron-beam characterization,
Roxana Tarkeshian, JL Vay, R Lehe, CB Schroeder, EH Esarey, Thomas Feurer, and WP Leemans, “Transverse space-charge field-induced plasma dynamics for ultraintense electron-beam characterization,” Physical review X8, 021039 (2018)
2018
-
[24]
Electron beam phase space reconstruction from a gas sheet diagnostic,
N Cook, A Diaw, C Hall, G Andonian, M Yadav, and N Norvell, “Electron beam phase space reconstruction from a gas sheet diagnostic,” Proceedings of the 13th International Par- ticle Accelerator Conference (2022)
2022
-
[25]
New technology based on clamping for high gradient radio frequency photogun,
David Alesini, Antonio Battisti, Massimo Ferrario, Luca Foggetta, Valerio Lollo, Luca Ficcadenti, Valerio Pettinacci, Sean Custodio, Eylene Pirez, Pietro Musumeci, et al. , “New technology based on clamping for high gradient radio frequency photogun,” Physical Review Special T...
2015
-
[26]
Velocity map imag- ing of ions and electrons using electrostatic lenses: Applica- tion in photoelectron and photofragment ion imaging of molec- ular oxygen,
André TJB Eppink and David H Parker, “Velocity map imag- ing of ions and electrons using electrostatic lenses: Applica- tion in photoelectron and photofragment ion imaging of molec- ular oxygen,” Review of Scientific Instruments 68, 3477–3484 (1997)
1997
-
[27]
Electrostatic cylinder lenses ii: Three element einzel lenses,
A Adams and F H Read, “Electrostatic cylinder lenses ii: Three element einzel lenses,” Journal of Physics E: Scientific Instru- ments 5, 150 (1972)
1972
-
[28]
General particle tracer: A new 3d code for accelerator and beamline design,
MJ De Loos, SB Van der Geer, et al., “General particle tracer: A new 3d code for accelerator and beamline design,” in5th Eu- ropean Particle Accelerator Conference, V ol. 1241 (1996)
1996
-
[29]
MT Menzel and H K_ Stokes, Users guide for the POIS- SON/SUPERFISH group of codes, Tech. Rep. (Los Alamos Na- tional Lab., NM (United States), 1987)
1987
-
[30]
Experimental characterization of gas sheet transverse profile diagnostic,
N Burger, G Andonian, T Hodgetts, D Gavryushkin, AL Lamure, M Ruelas, C Welsch, M Yadav, P Denham, P Musumeci, et al., “Experimental characterization of gas sheet transverse profile diagnostic,” Proceedings of the 5th North American Particle Accelerator Conference (2022)
2022
-
[31]
(Taylor and Francis, USA, 1995)
Nicholas Tsoulfanidis, Measurement and detection of radia- tion, second edition ed. (Taylor and Francis, USA, 1995)
1995
-
[32]
Ex- tension of the binary-encounter-dipole model to relativistic in- cident electrons,
Yong-Ki Kim, José Paulo Santos, and Fernando Parente, “Ex- tension of the binary-encounter-dipole model to relativistic in- cident electrons,” Physical Review A62, 052710 (2000)
2000
-
[33]
Binary-encounter-dipole model for electron-impact ionization,
Yong-Ki Kim and M Eugene Rudd, “Binary-encounter-dipole model for electron-impact ionization,” Physical Review A 50, 3954 (1994)
1994
-
[34]
Electron-impact cross sections for ionization and excitation,
YK Kim, KK Irikura, ME Rudd, MA Ali, PM Stone, J Chang, JS Coursey, RA Dragoset, AR Kishore, KJ Olsen, et al. , “Electron-impact cross sections for ionization and excitation,” NIST Standard Reference Database 107 (2010)
2010
-
[35]
Critical review of n, n {sup+}, n {sup+}{sub 2}, n {sup++}, and n {sup++}{sub 2} main production processes and reactions of relevance to titan’s atmosphere,
Odile Dutuit, Roland Thissen, Veronique Vuitton, Nathalie Car- rasco, Christian Alcaraz, Pascal Pernot, Nadia Balucani, Pier- giorgio Casavecchia, Andre Canosa, Sebastien Le Picard,et al., “Critical review of n, n {sup+}, n {sup+}{sub 2}, n {sup++}, and n {sup++}{sub 2} main p...
2013
-
[36]
Cross sections for collisions of electrons and photons with nitrogen molecules,
Yukikazu Itikawa, M Hayashi, A Ichimura, K Onda, K Saki- moto, K Takayanagi, M Nakamura, H Nishimura, and T Takayanagi, “Cross sections for collisions of electrons and photons with nitrogen molecules,” Journal of physical and chemical reference data 15, 985–1010 (1986)
1986
-
[37]
Total cross sec- tions for ionization and attachment in gases by electron im- pact. i. positive ionization,
Donald Rapp and Paula Englander-Golden, “Total cross sec- tions for ionization and attachment in gases by electron im- pact. i. positive ionization,” The Journal of Chemical Physics 43, 1464–1479 (1965)
1965
-
[38]
Space-charge effects in ionization beam profile monitors,
Vladimir Shiltsev, “Space-charge effects in ionization beam profile monitors,” Nuclear Instruments and Methods in Physics Research Section A: Accelerators, Spectrometers, Detectors and Associated Equipment 986, 164744 (2021)
2021
-
[39]
A co-axial velocity map imaging spectrometer for electrons,
S. Li, E. G. Champenois, R. Coffee, Z. Guo, K. Hegazy, A. Ka- malov, A. Natan, J. O’Neal, T. Osipov, III Owens, M., D. Ray, D. Rich, P. Walter, A. Marinelli, and J. P. Cryan, “A co-axial velocity map imaging spectrometer for electrons,” AIP Ad- vances 8, 115308 (2018), https:/...
2018 doi
-
[40]
Oxygen gas-sheet beam profile monitor for the synchrotron and storage ring,
Y Hashimoto, T Fujisawa, T Morimoto, Y Fujita, T Honma, S Muto, K Noda, Y Sato, and S Yamada, “Oxygen gas-sheet beam profile monitor for the synchrotron and storage ring,” Nu- clear Instruments and Methods in Physics Research Section A: Accelerators, Spectrometers, Detectors a...
2004
-
[41]
High- intensity beam profile measurement using a gas sheet moni- tor by beam induced fluorescence detection,
Ippei Yamada, Motoi Wada, Katsuhiro Moriya, Junichiro Kamiya, Pranab Kumar Saha, and Michikazu Kinsho, “High- intensity beam profile measurement using a gas sheet moni- tor by beam induced fluorescence detection,” Phys. Rev. Accel. Beams 24, 042801 (2021)
2021
Reviewed August 12, 2026 · model on record in the stance chip above.
Discussion (0). Continue with ORCID to comment.