REVIEW 4 major objections 5 minor 42 references
Inter-firm Heterogeneity in Production
T0 review · 4 major / 5 minor · reviewed 2026-08-12 · deepseek-v4-flash
Pith's one-line read Using manufacturing panels from Chile, Colombia, and Japan, this paper argues that firms differ not only in factor-neutral productivity but also in capital and labor output elasticities, and that these two dimensions are strongly…
desk verdict A genuinely interesting empirical finding—negative correlation between productivity intercepts and returns to scale—that is not yet nailed down because the headline correlations come without standard errors and the simulation never tests them. read the letter →
The pith
A machine-rendered reading of the paper's core claim, the machinery that carries it, and where it could break.
The reading
What carries the argument
The central object is a nonparametric Empirical Bayes estimator built on a rational-expectations prior. The firm-level parameters $(\alpha_0, \alpha_1, \alpha_2, \beta, \gamma, s)$ are discretized into a finite grid of $15^3 \times 6^3 = 729{,}000$ configurations for the Cobb-Douglas case. For each firm, the likelihood of each configuration is computed from the firm's own time series, and a prior probability vector over configurations is updated by Bayes rule. The estimator chooses the fixed point of the prior-to-posterior map that is coherent (prior equals posterior) and stable; this fixed point is the maximum likelihood estimate of the discrete joint distribution. Iterating the map, using an EM-like step, yields the posterior distribution, and firm-specific parameters are obtained as posterior means. The key work of this machinery is to estimate the joint distribution of all technology parameters without restricting the correlation pattern among them, so the negative correlation between $\alpha_0$ and $\beta+\gamma$ is an estimated feature rather than an imposed one.
What would settle it
Simulate a panel of firms whose true elasticities are drawn independently of true productivity, let productivity follow an AR(1) process that managers observe when choosing inputs, and then apply this paper's estimator, which forces a quadratic productivity trend. If the estimated correlation between the intercept and returns to scale is strongly negative while the true correlation is zero, the central discovery is an artifact of the quadratic-trend assumption.
Extended reading notes
Core claim
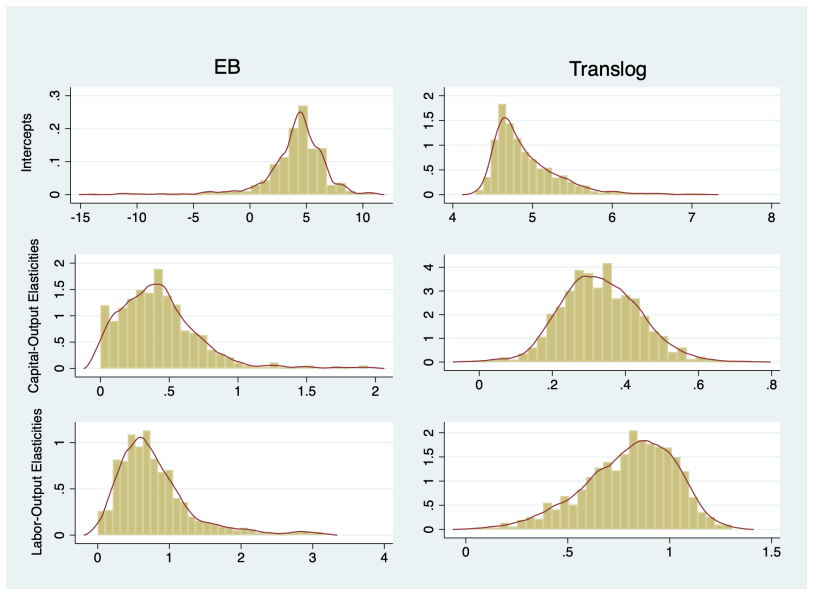
On the paper's own terms, the central discovery is that the joint distribution of Cobb-Douglas technology parameters is much wider than standard estimators suggest, and that its two main components pull in opposite directions. Across the Chilean, Colombian, and Japanese samples, the intercept $\alpha_0$ has a standard deviation roughly six times larger than the Translog estimate, the capital elasticity $\beta$ about twice as large, and the labor elasticity $\gamma$ two to three times as large. The correlation between the intercept and returns to scale $\beta+\gamma$ is $-0.828$ in Chile, $-0.887$ in Colombia, and $-0.819$ in Japan, and similar magnitudes appear under a CES specification and an intensive Cobb-Douglas specification. The paper reads this negative correlation as absence of technology dominance: because no single firm's production function dominates all others, many firms with different techniques can coexist in one sector, and measured capital-labor differences need not indicate misallocation.
Load-bearing premise
The entire result depends on assuming that the part of productivity that affects input choices is exactly a quadratic function of time, so that any remaining productivity shock arrives only after inputs are chosen.
Editorial extensions
If this is right
- One-number total factor productivity rankings overstate productivity dispersion: once returns to scale are allowed to vary, the 90/10 ratio of Total Technology Productivity is about 3 to 4 in all three countries, an order of magnitude smaller than the 90/10 ratio of factor-neutral productivity alone.
- Markup estimates built on homogeneous or Translog production functions understate markup dispersion; the Empirical Bayes labor-markup distributions have 90/10 ratios roughly double the Translog ones in Chile and Colombia.
- Firm size and industry sector explain at most about 10 percent of the variance in estimated technology parameters, so sector-level or size-level production functions cannot substitute for firm-level technology heterogeneity.
- If firms differ in both factor-neutral productivity and returns to scale, observed variation in capital-labor ratios need not be misallocation; it can reflect different technologies rather than distorted input choices.
Reading between the lines
- If the negative correlation is a technology-menu equilibrium rather than an estimation artifact, then resource reallocation toward high-factor-neutral-productivity firms may be much less productivity-enhancing than standard misallocation calculations suggest, since those firms tend to have lower returns to scale.
- A natural next test is to estimate the same Empirical Bayes model on gross-output data with materials, or on longer panels with a higher-order productivity process; the paper's own identifiability requirement, more time periods than parameters, says the test will need longer panels and coarser grids.
- The correlation pattern predicts a specific cross-sectional fact: within an industry, firms with high estimated intercepts should use different capital-labor ratios from firms with low intercepts, and that input-basket prediction can be checked directly on the same datasets without re-estimating the model.
Editorial analysis
A structured set of objections, weighed in public.
Referee Report
Summary. The paper develops an empirical Bayes (EB) estimator for heterogeneous Cobb-Douglas production functions, treating intercept, factor elasticities, and error variance as firm-specific and estimating their joint distribution nonparametrically via a discretized fixed-point approach. Using balanced manufacturer panels from Chile (1986–1996), Colombia (1978–1989), and Japan (2013–2019), the authors report substantial dispersion in factor-neutral productivity and output elasticities, with a strong negative correlation between the estimated intercept and returns to scale (about −0.8 in all three countries, Table 4). These correlations are found to persist under CES and intensive-CD specifications. The paper compares means with ACF Translog estimates, documents that most heterogeneity is within sectors and size classes, and shows implications for total technology productivity (TTP) and markup dispersion.
Significance. If valid, the headline result—that factor-neutral productivity and returns to scale are strongly negatively correlated—implies that conventional one-number TFP measures omit a key dimension of inter-firm technology variation, with direct consequences for markup estimation and misallocation analysis. The paper demonstrates the viability of an EB approach for joint estimation of heterogeneous production parameters, and it offers a transparent comparison with standard ACF Translog estimates on the same samples. The central empirical claim, however, is only as credible as the identifying assumption that firm-specific productivity dynamics are exactly captured by a quadratic trend; this is the main vulnerability that the current manuscript does not resolve.
major comments (4)
- [Section 4, Eqs. (4)–(5) and footnote 11] The identification of firm-specific elasticities β_i and γ_i rests on the assumption that the firm-specific quadratic trend fully captures the productivity dynamics relevant to input choice, with innovations η_it observed only after input decisions. If true productivity follows a persistent process (e.g., an AR(1) as in Olley–Pakes), then k_it and l_it will be correlated with the residual ϕ_it in Eq. (5), and with only T=7–12 observations per firm the within-firm variation used to separate elasticities from productivity is thin. The resulting estimated slopes can absorb the omitted productivity component, and the correlation between estimated intercepts and returns to scale may be spurious even when the true technology parameters are independent. The authors should address this threat, either by relaxing the timing assumption, providing an alternative identification strategy, or showing through Monte Carlo evidence that the estimated correlation is not induced by this misspecification.
- [Section 5.1, Eq. (6) and Table 5] The simulation does not validate the central claim concerning the negative correlation between intercept and returns to scale. The DGP in Eq. (6) sets α1=α2=0 and generates productivity as a firm fixed effect, which is nested inside the maintained quadratic-trend assumption. Consequently, the simulation cannot speak to the possibility that omitted persistent productivity shocks generate the Table 4 correlations. I recommend an additional Monte Carlo exercise in which the true productivity process is a persistent, input-correlated shock (for instance, an AR(1) with input choices reacting to current productivity) and in which the true correlation between the intercept and returns to scale is set to zero. Reporting the EB estimates of that correlation under such a DGP would directly assess the skeptical scenario.
- [Table 4 and Section 4.2] The headline correlations between α0 and β, γ, and β+γ are reported without any standard errors, confidence intervals, or other measures of sampling or posterior uncertainty. Given the EB framework, one can compute the posterior distribution of these correlations or use a bootstrap that resamples firms and/or the estimated type distribution. Without such measures, the reader cannot judge whether the ≈−0.8 correlations are distinguishable from, say, −0.5 or −0.3, nor whether they are statistically significant at all. This is a load-bearing statistic for the paper, so it should be accompanied by an appropriate uncertainty measure.
- [Section 3, balanced-panel screen and outlier trimming] The estimation samples are restricted to firms that survive the entire sample period (Chile 1986–1996, Colombia 1978–1989, Japan 2013–2019), and the Japanese sample additionally excludes 10% of observations as univariate and multivariate outliers via the BACON algorithm. The paper explicitly acknowledges that it does not address the Olley–Pakes selection issue. If survival is correlated with the technology parameters or with productivity dynamics, the estimated joint distribution—and specifically the negative intercept–RTS correlation—could be a selection artifact rather than a population feature. The authors should at least discuss the likely direction of selection bias, and if feasible, estimate the model on an unbalanced sample or examine the sensitivity of the correlation to the outlier trimming threshold.
minor comments (5)
- [General] The name of the country is spelled inconsistently (“Colombia” in the text and tables versus “Columbia” in several places, e.g., Section 6.2 and Table 8); please standardize to “Colombia”.
- [Table 9] The header of Table 9 appears to duplicate “α1” in the column names (one column is presumably α2); please correct the label.
- [Section 4.1] The grid intervals used for discretizing α0, β, γ, α1, α2, and s are not fully specified in the text (e.g., footnote 5 says “intervals which contain most of the parameters’ density” without giving the actual bounds). Adding the exact grid support and a brief sensitivity analysis to alternative grid sizes/bounds would improve reproducibility.
- [Section 5.1] The simulation reports bias and MSE for means and standard deviations of α, β, γ, but not for the correlation between the intercept and returns to scale; given that correlation is the paper’s central finding, it should be included in the simulation evaluation.
- [Section 6.1 and Figure 5] The “absence of dominance” explanation for the negative correlation is intuitive, but it is presented as a theoretical rationalization rather than a direct test; the paper could clarify that this is one possible interpretation, not a validation of the empirical result.
Circularity Check
The central empirical finding has independent data content and is benchmarked against ACF Translog and pooled OLS, but the EB estimator's uniqueness theorem is imported from the authors' own companion paper, and the Section 6.1 'non-dominance' explanation restates the negative correlation by definition rather than deriving it.
-
uniqueness imported from authors
[Section 2, Empirical Bayes Estimation (paragraphs 3-5)]
"Using an approach suggested by Dardanoni and Demichelis (2024), we propose that the choice of the prior is guided by two rational expectations conditions... Dardanoni and Demichelis (2024) show that a coherent and stable fixed point (say π∗) exists and is unique."
The paper's estimator is justified by an existence/uniqueness result that is not proved here; the cited source is the authors' own companion paper (Dardanoni and Demichelis 2024). The uniqueness and the accompanying claim that the iterative procedure converges to the unique global maximum of the Log Likelihood are load-bearing: every reported EB posterior mean and correlation in Tables 2-4 and 9-10 depends on this fixed point being the correct estimator. The companion result is not machine-checked, code-reproduced, or otherwise made independently verifiable in this manuscript, so under the review rules it is not independent support. This does not make the empirical correlation a tautology, but it makes the statistical premises of the headline estimates rest on a self-citation chain.
-
self definitional
[Section 6.1, 'The puzzle of negative correlation between factor neutral productivity and returns to scale']
"Generally, given a set of firms {an, bn}n=1:N, absence of dominance implies the condition(ai − aj)(bi − bj) ≤ 0 for all i, j(i.e. a negative correlation betweena andb). ... This is reflected in the large negative correlation between a and b found in our estimation of the intensive production functions in section 5.3 above."
The proposed explanation for the 'puzzling' negative correlation defines absence of dominance as (ai−aj)(bi−bj) ≤ 0 for all pairs, which it explicitly glosses as 'a negative correlation between a and b.' It then says the estimated large negative correlation is 'reflected' in this same condition. Thus the theoretical explanation is the empirical finding renamed 'non-dominance'; no independent derivation generates the correlation beyond the definition. The observed correlations (about −0.86 to −0.87) are also not the perfect pairwise monotone ordering implied by the all-pairs condition, but the circular move is the definitional equation of the target quantity with the explanatory concept.
full rationale
The paper's headline result—the large negative correlation between factor-neutral productivity (intercept) and returns to scale—is an empirical output of an EB estimator applied to three independent datasets, benchmarked against ACF Translog and pooled OLS counterparts. The prior is not set to enforce the correlation: the algorithm starts from a uniform distribution over parameter grids, and the finding is reproduced under CES and intensive CD specifications, so the central claim has substantial independent content. Two problems prevent a clean bill. First, the validity of the EB procedure, including existence, uniqueness, and the ML interpretation of the fixed point, is imported from the authors' own companion paper (Dardanoni and Demichelis 2024) rather than proved or independently verified in this manuscript; that self-citation is load-bearing for the estimator that produces every table. Second, the Section 6.1 'explanation' of the negative correlation defines non-dominance as the condition (ai−aj)(bi−bj) ≤ 0 for all pairs, which it calls 'a negative correlation,' and then says the estimated negative correlation is 'reflected' in that condition; the explanation is therefore a relabeling of the finding rather than an independent derivation. Because neither issue makes the empirical estimates collapse into their inputs, the appropriate overall circularity score is 4 rather than 6 or higher.
Assumptions & free parameters
free parameters (2)
- EB grid sizes and interval bounds =
15/15/15/6/6/6 grid points; interval bounds not reported
- Outlier trimming in Japan =
10%
assumptions (6)
- domain assumption h(Xit; psi_i) is injective for all X and T > dim(psi), guaranteeing identification of firm-specific parameters
- domain assumption Idiosyncratic errors epsilon_it are i.i.d. normal with firm-specific standard deviation s_i
- ad hoc to paper Firm-specific productivity follows a quadratic trend alpha_it = alpha0_i + alpha1_i t + alpha2_i t^2, and residual innovations are observed after input choices
- domain assumption A coherent and stable rational-expectations fixed point pi* exists and is unique and equals the MLE (Dardanoni-Demichelis 2024)
- domain assumption The finite-grid discrete distribution nonparametrically approximates the true joint distribution
- ad hoc to paper Surviving a balanced-panel screen does not systematically bias technology parameters
Cite this review
Pith. "Pith review of Inter-firm Heterogeneity in Production." pith.science (2026). https://pith.science/paper/EVUSYSXI
@misc{pith2026241115980,
  author       = {Pith},
  title        = {Pith review of: Inter-firm Heterogeneity in Production},
  year         = {2026},
  howpublished = {\url{https://pith.science/paper/EVUSYSXI}},
  note         = {Machine review of arXiv:2411.15980}
}
read the original abstract
This paper studies inter-firm heterogeneity in production. Unlike much of the existing research, which primarily addresses heterogeneous production through unobserved fixed effects, our approach also focuses on differences in factors' output elasticities. Using manufacturing data from Chile, Colombia, and Japan, we apply an innovative Empirical Bayes methodology to estimate heterogeneous Cobb-Douglas production functions. We uncover substantial heterogeneity in both factor neutral productivity and factor elasticities, with a strong negative correlation between them. These findings are consistently observed across datasets and remain robust when using CES and intensive Cobb-Douglas specifications. We show that accounting for these features has significant implications for issues such as markup estimation, firms' technology adoption, and productivity measurement.
Figures


Figures from the paper (11 more)


Reference graph
Works this paper leans on
-
[1]
Ackerberg, D. A., Caves, K. and Frazer, G. (2015) Identification properties of recent production function estimators, Econometrica, 83, 2411--2451
work page 2015
-
[2]
Ackerberg, D. A., Hahn, J. and Pan, Q. (2022) Nonparametric identification using timing and information set assumptions with an application to non-hicks neutral productivity shocks
work page 2022
-
[3]
Arrow, K. J., Chenery, H. B., Minhas, B. S. and Solow, R. M. (1961) Capital-labor substitution and economic efficiency, Review of Economics and Statistics, 43, 225--250
work page 1961
-
[4]
Battisti, M., Belloc, F. and Del Gatto, M. (2020) Labor productivity and firm-level tfp with technology-specific production functions, Review of Economic Dynamics, 35, 283--300
work page 2020
-
[5]
Bernard, A. B. and Jones, C. I. (1996) Comparing apples to oranges: productivity convergence and measurement across industries and countries, American Economic Review, 86, 1216--1238
work page 1996
-
[6]
Billor, N., Hadi, A. S. and Velleman, P. F. (2000) Bacon: blocked adaptive computationally efficient outlier nominators, Computational Statistics & Data Analysis, 34, 279--298
work page 2000
-
[7]
Chen, J. (2024) Empirical bayes when estimation precision predicts parameters, arXiv preprint arXiv:2212.14444v4
arXiv 2024
-
[8]
Cobb, C. W. and Douglas, P. H. (1928) A theory of production (1928), American Economic Review, 18, 139--152
work page 1928
Show all 42 references
-
[9]
and Demichelis, S
Dardanoni, V. and Demichelis, S. (2024) Rational expectations nonparametric empirical bayes estimation, arXiv preprint arXiv:2411.06129
2024 arXiv
-
[10]
David, P. A. and Van de Klundert, T. (1965) Biased efficiency growth and capital-labor substitution in the us, 1899-1960, The American Economic Review, pp. 357--394
1965
-
[11]
(2011) Product differentiation, multiproduct firms, and estimating the impact of trade liberalization on productivity, Econometrica, 79, 1407--1451
De Loecker, J. (2011) Product differentiation, multiproduct firms, and estimating the impact of trade liberalization on productivity, Econometrica, 79, 1407--1451
2011
-
[12]
and Warzynski, F
De Loecker, J. and Warzynski, F. (2012) Markups and firm-level export status, American Economic Review, 102, 2437--2471
2012
-
[13]
(2022) Production function estimation with factor-augmenting technology: An application to markups, Job Market Paper
Demirer, M. (2022) Production function estimation with factor-augmenting technology: An application to markups, Job Market Paper
2022
-
[14]
and Jaumandreu, J
Doraszelski, U. and Jaumandreu, J. (2018) Measuring the bias of technological change, Journal of Political Economy, 126, 1027--1084
2018
-
[15]
and Rivers, D
Gandhi, A., Navarro, S. and Rivers, D. A. (2020) On the identification of gross output production functions, Journal of Political Economy, 128, 2973--3016
2020
-
[16]
and Villegas-Sanchez, C
Gopinath, G., Kalemli- zcan, S ., Karabarbounis, L. and Villegas-Sanchez, C. (2017) Capital allocation and productivity in south europe, Quarterly Journal of Economics, 132, 1915--1967
2017
-
[17]
and Walters, C
Gu, J. and Walters, C. (2022) Nber si 2022 methods lectures - empirical bayes methods, theory and application
2022
-
[18]
Hall, R. E. (1988) The relation between price and marginal cost in us industry, Journal of political Economy, 96, 921--947
1988
-
[19]
H., Littlewood, J
Hardy, G. H., Littlewood, J. E. and P \'o lya, G. (1952) Inequalities, CUP
1952
-
[20]
Hulten, C. R. (1992) Growth accounting when technical change is embodied in capital, American Economic Review, 82, 964--980
1992
-
[21]
Jones, C. I. (2005) The shape of production functions and the direction of technical change, Quarterly Journal of Economics, 120, 517--549
2005
-
[22]
and Suzuki, M
Kasahara, H., Schrimpf, P. and Suzuki, M. (2023) Identification and estimation of production function with unobserved heterogeneity, arXiv preprint arXiv:2305.12067
2023 arXiv
-
[23]
Kass, R. E. and Steffey, D. (1989) Approximate bayesian inference in conditionally independent hierarchical models (parametric empirical bayes models), Journal of the American Statistical Association, 84, 717--726
1989
-
[24]
and Wolfowitz, J
Kiefer, J. and Wolfowitz, J. (1956) Consistency of the maximum likelihood estimator in the presence of infinitely many incidental parameters, The Annals of Mathematical Statistics, pp. 887--906
1956
-
[25]
(1967) On estimation of the ces production function, International Economic Review, 8, 180--189
Kmenta, J. (1967) On estimation of the ces production function, International Economic Review, 8, 180--189
1967
-
[26]
and Mizera, I
Koenker, R. and Mizera, I. (2014) Convex optimization, shape constraints, compound decisions, and empirical bayes rules, Journal of the American Statistical Association, 109, 674--685
2014
-
[27]
(1963) Capital stock growth: A micro-econometric approach, North-Holland, Amsterdam
Kuh, E. (1963) Capital stock growth: A micro-econometric approach, North-Holland, Amsterdam
1963
-
[28]
Le \'o n-Ledesma, M. A. and Satchi, M. (2019) Appropriate technology and balanced growth, Review of Economic Studies, 86, 807--835
2019
-
[29]
and Petrin, A
Levinsohn, J. and Petrin, A. (2003) Estimating production functions using inputs to control for unobservables, Review of Economic Studies, 70, 317--341
2003
-
[30]
(2021) A time-varying endogenous random coefficient model with an application to production functions, arXiv preprint arXiv:2110.00982
Li, M. (2021) A time-varying endogenous random coefficient model with an application to production functions, arXiv preprint arXiv:2110.00982
2021
-
[31]
and Sasaki, Y
Li, T. and Sasaki, Y. (2024) Identification of heterogeneous elasticities in gross-output production functions, Journal of Econometrics, 238, 105637
2024
-
[32]
and Kadane, J
Maddala, G. and Kadane, J. B. (1967) Estimation of returns to scale and the elasticity of substitution, Econometrica, 35, 419--423
1967
-
[33]
and Griliches, Z
Mairesse, J. and Griliches, Z. (1988) Heterogeneity in panel data: are there stable production functions?, NBER Working Paper no. 2619
1988
-
[34]
and Andrews, W
Marschak, J. and Andrews, W. H. (1944) Random simultaneous equations and the theory of production, Econometrica, 12, 143--205
1944
-
[35]
and Raval, D
Oberfield, E. and Raval, D. (2021) Micro data and macro technology, Econometrica, 89, 703--732
2021
-
[36]
Olley, G. S. and Pakes, A. (1996) The dynamics of productivity in the telecommunications equipment industry, Econometrica, 64, 1263--1297
1996
-
[37]
(2023) Testing the production approach to markup estimation, Review of Economic Studies, 90, 2592--2611
Raval, D. (2023) Testing the production approach to markup estimation, Review of Economic Studies, 90, 2592--2611
2023
-
[38]
and Rogerson, R
Restuccia, D. and Rogerson, R. (2017) The causes and costs of misallocation, Journal of Economic Perspectives, 31, 151--174
2017
-
[39]
and Mollisi, V
Rovigatti, G. and Mollisi, V. (2018) Theory and practice of total-factor productivity estimation: The control function approach using stata, The Stata Journal, 18, 618--662
2018
-
[40]
(2011) What determines productivity?, Journal of Economic Literature, 49, 326--365
Syverson, C. (2011) What determines productivity?, Journal of Economic Literature, 49, 326--365
2011
-
[41]
(2003) Productivity dynamics with technology choice: An application to automobile assembly, Review of Economic Studies, 70, 167--198
Van Biesebroeck, J. (2003) Productivity dynamics with technology choice: An application to automobile assembly, Review of Economic Studies, 70, 167--198
2003
-
[42]
and Dreze, J
Zellner, A., Kmenta, J. and Dreze, J. (1966) Specification and estimation of cobb-douglas production function models, Econometrica, 34, 784--795
1966
Reviewed August 12, 2026 · model on record in the stance chip above.
Discussion (0). Continue with ORCID to comment.