REVIEW 4 major objections 5 minor 30 references
Forest Biomass Mapping with Terrestrial Hyperspectral Imaging for Wildfire Risk Monitoring
T0 review · 4 major / 5 minor · reviewed 2026-08-12 · deepseek-v4-flash
Pith's one-line read Hyper-Drive3D identifies sub-canopy vegetation at risk of becoming wildfire fuel by projecting a two-band SWIR moisture index onto LiDAR point clouds.
desk verdict The sensor integration is real but the moisture index is unvalidated, so the headline risk-mapping claim fails. read the letter →
The pith
A machine-rendered reading of the paper's core claim, the machinery that carries it, and where it could break.
The reading
What carries the argument
The load-bearing object is the two-band moisture ratio $I_M = (S_{r1300} - S_{r1119})/(S_{r1300} + S_{r1119})$, a normalized difference between reflectance at 1300 nm and 1119 nm. It converts the registered hyperspectral cube into a single-channel moisture image, which is then thresholded into high-, medium-, and low-risk zones and fused with LiDAR. Supporting machinery includes dark- and reference-based reflectance calibration, homography-based alignment of the VNIR and SWIR images, target-based LiDAR-camera extrinsic calibration, and LiDAR odometry and mapping to build the point cloud onto which the moisture image is projected.
What would settle it
Drive Hyper-Drive3D through an area where fuel moisture is independently measured by oven-drying vegetation samples or using a calibrated dielectric probe, and check whether $I_M = (S_{r1300} - S_{r1119})/(S_{r1300} + S_{r1119})$ moves monotonically with measured moisture across species and lighting conditions; a flat, non-monotonic, or species-dependent response would falsify the risk classification.
Extended reading notes
Core claim
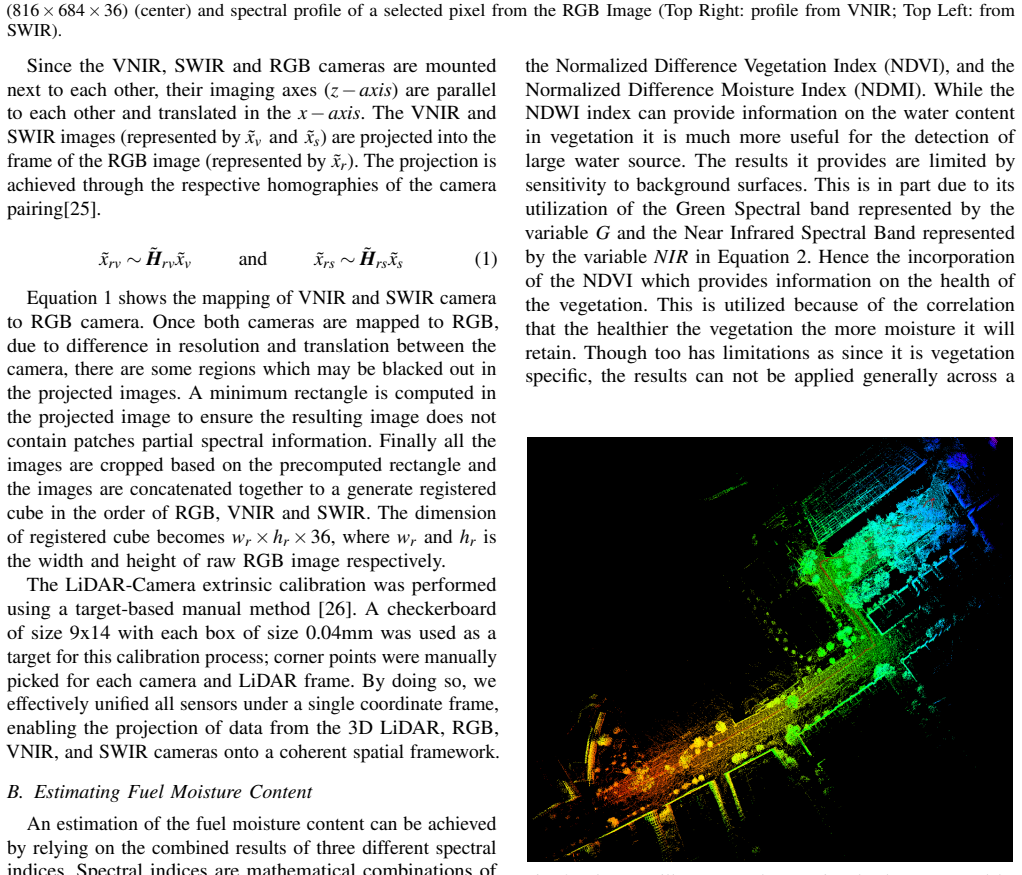
The central claim is that a terrestrial robotic platform can turn hyperspectral reflectance into a fuel-moisture map at plant scale. The paper presents the full chain: VNIR and SWIR snapshot cameras are registered to an RGB frame with homographies to form a 36-band cube; radiance is converted to reflectance using dark and PTFE reference signals; the normalized difference moisture index $I_M = (S_{r1300} - S_{r1119})/(S_{r1300} + S_{r1119})$ is computed from two SWIR bands; and that single-channel image is colored by risk category and projected through a calibrated camera-to-LiDAR transform onto each point of a dense point cloud. The authors state that this identifies areas inside forests at risk of becoming fuel for a forest fire, enabling proactive monitoring without exposing forest rangers.
Load-bearing premise
The entire risk map rests on assuming the two-band reflectance index $I_M$ measures vegetation water content, but no ground-truth fuel-moisture measurements are used to calibrate or confirm that relationship.
Editorial extensions
If this is right
- If correct, the dense maps close the sub-canopy resolution gap, showing individual plants rather than the coarse pixels available from satellites or aircraft.
- Because each LiDAR point carries a moisture value, the same ground robot can revisit a plot and track how fuel dryness changes over time.
- The calibrated point cloud provides a spatial coordinate system in which spectral indices such as NDVI and NDWI can be treated as random variables, supporting uncertainty-aware risk metrics for planning.
- The two-day collection under rainy and sunny conditions demonstrates that the pipeline can operate in variable illumination, which is necessary for repeated monitoring.
Reading between the lines
- An extension the paper does not make is that the risk categories should be treated as relative until calibrated against ground-truth moisture measurements.
- A natural next test is to co-locate Hyper-Drive3D scans with handheld or oven-dried fuel-moisture samples; if the index tracks those samples, the system becomes a quantitative moisture sensor rather than a relative indicator.
- Because only surface reflectance is observed, shadow, leaf angle, and sun position could dominate the index; repeated scans of the same plot at different times of day would show whether the signal is stable.
- If the terrestrial moisture index proves reliable, it could be used as ground truth to calibrate coarser satellite-based fuel-moisture products, effectively connecting remote coverage with sub-canopy detail.
Editorial analysis
A structured set of objections, weighed in public.
Referee Report
Summary. The paper introduces Hyper-Drive3D, a UGV-mounted system combining snapshot hyperspectral cameras (VNIR and SWIR), an RGB camera, and LiDAR, with a pipeline to calibrate raw hyperspectral data to reflectance, compute a moisture index from two SWIR bands, and project the resulting classification onto 3D LiDAR point clouds. The authors report preliminary and final field data collections and claim the system can identify areas inside forests at risk of becoming fuel for a forest fire. The central technical contribution is the moisture index I_M = (S_r1300 - S_r1119)/(S_r1300 + S_r1119) in Equation 6, which is asserted to represent fuel moisture content and is then thresholded into three risk zones.
Significance. If the moisture index were properly validated, a terrestrial, sub-canopy fuel moisture mapping system would be a meaningful contribution to wildfire risk monitoring. The paper also demonstrates a non-trivial hardware integration effort (hyperspectral cameras, LiDAR, calibration, and projection) and provides a new dataset from forested environments. However, the significance of the claimed scientific contribution—quantifying wildfire risk from spectral data—is currently not established because the moisture index is never calibrated against ground-truth fuel moisture content, and no quantitative evaluation of the system's risk identification performance is provided.
major comments (4)
- [Section IV.C, Equation (6)] The moisture index I_M = (S_r1300 - S_r1119)/(S_r1300 + S_r1119) is asserted to represent fuel moisture content, but no calibration is provided. The paper gives no ground-truth fuel moisture content measurements (e.g., gravimetric samples), no comparison with an independent moisture sensor, and no spectral-library or literature basis for selecting 1300 nm and 1119 nm. Because the entire risk-mapping output and all downstream claims depend on this spectral-to-moisture relationship, the core claim of the paper is unsupported.
- [Section IV.C, risk zones] The risk zones are defined as "high-risk (0-20), medium-risk (20-50), and low-risk (greater than 50)" with no units, while I_M is stated to range from 0 to 1. A normalized difference over positive reflectances necessarily lies in (-1, 1), so a threshold of 20 or 50 cannot be applied to I_M as defined. This dimensional inconsistency makes the risk classification uninterpretable and prevents replication.
- [Section V, Results] The Results section contains no quantitative evaluation whatsoever. There are no accuracy metrics, no statistical tests, no comparison against ground-truth moisture content or against established indices such as NDWI, and no assessment of the risk classification's correctness. The section only describes the processing steps and shows qualitative visualizations. This does not support the abstract's claim that the system 'identifies areas inside forests at risk of becoming fuel for a forest fire.'
- [Section III.A, reflectance calibration] The reflectance calibration method is referenced to [24], which is the authors' own paper currently under peer review. The method is not described in sufficient detail for the reader to assess or reproduce it, and the validity of the reflectance values used in Equation (6) consequently cannot be evaluated. A central component of the pipeline is thus not independently verifiable.
minor comments (5)
- [Section III.A, checkerboard description] The checkerboard is described as having boxes of size 0.04 mm; this is almost certainly a typo, most likely 0.04 m (4 cm). Please correct the unit.
- [Section III.A, VNIR range] The VNIR camera wavelength range is given as '660-900' without units; it should be nm.
- [Section III.B, indices] Equations (2)-(4) define NDWI, NDVI, and NDMI, but none of these indices is used in the later moisture content calculation; Equation (6) introduces a different normalized difference index. The relationship between the discussion of NDWI/NDVI/NDMI and the actual implemented index should be clarified.
- [Equation (7)] The projection formula p_lidar = T_camera^lidar * (z * K^{-1} * p_camera) is incomplete or incorrectly typeset: the notation is ambiguous and the dot after 'lidar' appears to be a typographical artifact. Please clarify the coordinate transformations and the variables used.
- [Figure 1 caption] The caption contains a stray space: 'system platform .' should be 'system platform.'
Circularity Check
The moisture/risk output is defined as the normalized difference IM and then thresholded into risk zones, so the central claim reduces by construction to the chosen bands and cutoffs, with no external fuel-moisture calibration.
-
self definitional
[Section IV.C, Equations 5-6 and the risk-zone definitions]
"Moisture content is calculated by normalizing the difference between two wavelength channels, 1300 and 1119, as shown in Equation 6, where IM is a 2-D array (single-channel image) of moisture content, ranging from 0 − 1. ... Using this moisture content information, we categorize areas into three risk zones for wildfire susceptibility: high-risk (0-20), medium-risk (20-50), and low-risk (greater than 50)."
The paper defines the quantity 'moisture content' as IM = (Sr1300 - Sr1119)/(Sr1300 + Sr1119) and then defines wildfire risk zones directly as thresholds on IM. Therefore the central output, 'areas inside forests at risk of becoming fuel for a forest fire', is by construction a recoding of IM: the risk map is the index itself after arbitrary thresholding. No independent fuel moisture measurement, gravimetric sample, or external FMC dataset is used to calibrate or validate the transformation. The stated thresholds (0-20, 20-50, >50) also have no units and are inconsistent with the paper's own stated 0-1 range for IM, confirming that they are arbitrary cuts on the index rather than calibrated risk strata.
full rationale
The central derivation chain is short: raw radiance is converted to reflectance via Equation 5, then IM is computed from two SWIR bands in Equation 6, and risk zones are defined by thresholding IM. Because IM is declared to be 'moisture content' and the risk categories are declared to be functions of IM, the final risk maps do not test or predict anything beyond the chosen index. This is a self-definitional reduction rather than a calibrated scientific measurement. The hardware, registration, LiDAR projection, and reflectance formula are not circular: those are standard engineering steps and are given explicitly. The self-citations to the authors' prior work [23] and [24] are present but not the main source of circularity, since the key equations are stated in the paper itself. The circularity is concentrated in the unvalidated identification of a normalized difference index with moisture content and wildfire risk, which makes the central claim equivalent to its own definition. Score 6 reflects a partial but substantive circularity: the risk-mapping output reduces by construction, while the platform and data-collection contributions retain independent content.
Assumptions & free parameters
free parameters (2)
- Moisture index spectral bands (1300 nm and 1119 nm) =
1300 nm and 1119 nm
- Risk zone thresholds (0-20, 20-50, greater than 50) =
0-20 high risk, 20-50 medium risk, greater than 50 low risk
assumptions (3)
- domain assumption Reflectance calibration Sr = (S - Sd)/(Sref - Sd) removes illumination effects across the scene.
- ad hoc to paper The normalized difference IM = (Sr1300 - Sr1119)/(Sr1300 + Sr1119) is monotonically related to vegetation fuel moisture content.
- domain assumption Manual target-based camera-LiDAR calibration yields accurate extrinsics.
Cite this review
Pith. "Pith review of Forest Biomass Mapping with Terrestrial Hyperspectral Imaging for Wildfire Risk Monitoring." pith.science (2026). https://pith.science/paper/F22SMIWV
@misc{pith2026241116107,
  author       = {Pith},
  title        = {Pith review of: Forest Biomass Mapping with Terrestrial Hyperspectral Imaging for Wildfire Risk Monitoring},
  year         = {2026},
  howpublished = {\url{https://pith.science/paper/F22SMIWV}},
  note         = {Machine review of arXiv:2411.16107}
}
read the original abstract
With the rapid increase in wildfires in the past decade, it has become necessary to detect and predict these disasters to mitigate losses to ecosystems and human lives. In this paper, we present a novel solution -- Hyper-Drive3D -- consisting of snapshot hyperspectral imaging and LiDAR, mounted on an Unmanned Ground Vehicle (UGV) that identifies areas inside forests at risk of becoming fuel for a forest fire. This system enables more accurate classification by analyzing the spectral signatures of forest vegetation. We conducted field trials in a controlled environment simulating forest conditions, yielding valuable insights into the system's effectiveness. Extensive data collection was also performed in a dense forest across varying environmental conditions and topographies to enhance the system's predictive capabilities for fire hazards and support a risk-informed, proactive forest management strategy. Additionally, we propose a framework for extracting moisture data from hyperspectral imagery and projecting it into 3D space.
Figures


Figures from the paper (3 more)


Reference graph
Works this paper leans on
-
[24]
Field calibration of hyperspectral cameras for autonomous terrain inference,
N. Hanson, B. Pyatski, S. Hibbard, G. Lvov, O. De La Garza, C. DiMarzio, K. Dorsey, and T. Padir, “Field calibration of hyperspectral cameras for autonomous terrain inference,” Under Peer Review, 2024
work page 2024
-
[1]
The latest data confirms: Forest fires are getting worse,
James MacCarthy, Jessica Richter, Sasha Tyukavina, Mikaela Weisse and Nancy Harris, “The latest data confirms: Forest fires are getting worse,” https://www.wri.org/insights/global-trends-forest-fires, 2024
work page 2024
-
[2]
Hyperspec- tral remote sensing of fire: State-of-the-art and future perspectives,
S. Veraverbeke, P. Dennison, I. Gitas, G. Hulley, O. Kalashnikova, T. Katagis, L. Kuai, R. Meng, D. Roberts, and N. Stavros, “Hyperspec- tral remote sensing of fire: State-of-the-art and future perspectives,” Remote Sensing of Environment , vol. 216, pp. 105–121, 2018
work page 2018
-
[3]
Spectral imaging for remote sensing,
G. A. Shaw and H. K. Burke, “Spectral imaging for remote sensing,” Lincoln laboratory journal , vol. 14, no. 1, pp. 3–28, 2003
work page 2003
-
[4]
XPRIZE Foundation, “Xprize wildfire,” https://www.xprize.org/prizes/ wildfire, accessed: 21-Aug-2024
work page 2024
-
[5]
U.S. Forest Service, Northwest Area Coordination Center, “Fire terminology,” https://www.fs.usda.gov/nwacfire/home/terminology.html, accessed: 17-Aug-2024
work page 2024
-
[6]
Forest service manual (fsm) directive issuances, series 5000—protection and development,
U.S. Forest Service, “Forest service manual (fsm) directive issuances, series 5000—protection and development,” https://www.fs.usda.gov/ im/directives/dughtml/fsm5000.html, accessed: 21-Aug-2024
work page 2024
-
[7]
Wildfire response performance measurement: current and future directions,
M. P. Thompson, C. J. Lauer, D. E. Calkin, J. D. Rieck, C. S. Stonesifer, and M. S. Hand, “Wildfire response performance measurement: current and future directions,” Fire, vol. 1, no. 2, p. 21, 2018
work page 2018
Show all 30 references
-
[8]
Patterns of wildfire risk in the united states from systematic operational risk assessments: How risk is characterised by land managers,
E. Noonan-Wright and C. A. Seielstad, “Patterns of wildfire risk in the united states from systematic operational risk assessments: How risk is characterised by land managers,” International journal of wildland fire, vol. 30, no. 8, pp. 569–584, 2021
2021
-
[9]
Development of a framework for fire risk assessment using remote sensing and geographic information system technologies,
E. Chuvieco, I. Aguado, M. Yebra, H. Nieto, J. Salas, M. P. Mart ´ın, L. Vilar, J. Mart ´ınez, S. Mart ´ın, P. Ibarra et al., “Development of a framework for fire risk assessment using remote sensing and geographic information system technologies,” Ecological modelling, vol. 2...
2010
-
[10]
Com- parison of different methods for the in situ measurement of forest litter moisture content,
C. Schunk, B. Ruth, M. Leuchner, C. Wastl, and A. Menzel, “Com- parison of different methods for the in situ measurement of forest litter moisture content,” Natural Hazards and Earth System Sciences , vol. 16, no. 2, pp. 403–415, 2016
2016
-
[11]
Estimating live fuel moisture content from remotely sensed reflectance,
F. M. Danson and P. Bowyer, “Estimating live fuel moisture content from remotely sensed reflectance,” Remote Sensing of Environment , vol. 92, no. 3, pp. 309–321, 2004
2004
-
[12]
Determining fuel moisture thresholds to assess wildfire hazard: A contribution to an operational early warning system,
Arga˜naraz, J. P., Landi, M. A., Scavuzzo, C. M., and Bellis, L. M., “Determining fuel moisture thresholds to assess wildfire hazard: A contribution to an operational early warning system,” PloS one vol. 13,10 e0204889, 2018
2018
-
[13]
Validating the effect of fuel moisture content by a multivalued operator in a simplified physical fire spread model,
M. Asensio, J. Casc ´on, P. Laiz, and D. Prieto-Herr ´aez, “Validating the effect of fuel moisture content by a multivalued operator in a simplified physical fire spread model,” Environmental Modelling and Software, vol. 164, p. 105710, 2023. [Online]. Available: https: //www....
2023
-
[14]
Deep learning for land use and land cover classification based on hyperspectral and multispectral earth observation data: A review,
A. Vali, S. Comai, and M. Matteucci, “Deep learning for land use and land cover classification based on hyperspectral and multispectral earth observation data: A review,” Remote Sensing, vol. 12, no. 15, p. 2495, 2020
2020
-
[15]
Monitoring vegetation systems in the great plains with erts,
J. W. Rouse, R. H. Haas, J. A. Schell, D. W. Deering et al., “Monitoring vegetation systems in the great plains with erts,” NASA Spec. Publ , vol. 351, no. 1, p. 309, 1974
1974
-
[16]
Ndwi—a normalized difference water index for remote sensing of vegetation liquid water from space,
B.-C. Gao, “Ndwi—a normalized difference water index for remote sensing of vegetation liquid water from space,” Remote sensing of environment, vol. 58, no. 3, pp. 257–266, 1996
1996
-
[17]
Close range hyperspectral imaging of plants: A review,
P. Mishra, M. S. M. Asaari, A. Herrero-Langreo, S. Lohumi, B. Diezma, and P. Scheunders, “Close range hyperspectral imaging of plants: A review,” Biosystems Engineering, vol. 164, pp. 49–67, 2017. [Online]. Available: https://www.sciencedirect.com/science/article/pii/ S1537511...
2017
-
[18]
Autonomous satellite wildfire detection using hyperspectral imagery and neural networks: A case study on australian wildfire,
K. Thangavel, D. Spiller, R. Sabatini, S. Amici, S. T. Sasidharan, H. Fayek, and P. Marzocca, “Autonomous satellite wildfire detection using hyperspectral imagery and neural networks: A case study on australian wildfire,” Remote Sensing , vol. 15, no. 3, 2023. [Online]. Availa...
2023
-
[19]
Hardware acceleration for real-time wildfire detection onboard drone networks,
A. A. Briley and F. Afghah, “Hardware acceleration for real-time wildfire detection onboard drone networks,” in IEEE INFOCOM 2024 - IEEE Conference on Computer Communications Workshops (INFOCOM WKSHPS), 2024, pp. 01–06
2024
-
[20]
Early wildfire detection using uavs integrated with air quality and lidar sensors,
D. Rjoub, A. Alsharoa, and A. Masadeh, “Early wildfire detection using uavs integrated with air quality and lidar sensors,” in 2022 IEEE 96th Vehicular Technology Conference (VTC2022-Fall), 2022, pp. 1–5
2022
-
[21]
A cooperative uav/ugv platform for wildfire detection and fighting,
C. Phan and H. H. Liu, “A cooperative uav/ugv platform for wildfire detection and fighting,” in 2008 Asia Simulation Conference - 7th In- ternational Conference on System Simulation and Scientific Computing , 2008, pp. 494–498
2008
-
[22]
Vast: Visual and spectral terrain classification in unstructured multi-class environments,
N. Hanson, M. Shaham, D. Erdo ˘gmus ¸, and T. Padir, “Vast: Visual and spectral terrain classification in unstructured multi-class environments,” in 2022 IEEE/RSJ International Conference on Intelligent Robots and Systems (IROS). IEEE, 2022, pp. 3956–3963
2022
-
[23]
Hyper- drive: Visible-short wave infrared hyperspectral imaging datasets for robots in unstructured environments,
N. Hanson, S. Hibbard, B. Pyatski, C. DiMarzio, and T. Padır, “Hyper- drive: Visible-short wave infrared hyperspectral imaging datasets for robots in unstructured environments,” in 2023 13th Workshop on Hyperspectral Imaging and Signal Processing: Evolution in Remote Sensing (...
2023
-
[25]
Szeliski, Computer Vision: Algorithms and Applications , 1st ed
R. Szeliski, Computer Vision: Algorithms and Applications , 1st ed. Berlin, Heidelberg: Springer-Verlag, 2010
2010
-
[26]
GitHub - heethesh/lidar camera calibration: Light-weight camera LiDAR calibration package for ROS using OpenCV and PCL (PnP + LM optimization) — github.com,
“GitHub - heethesh/lidar camera calibration: Light-weight camera LiDAR calibration package for ROS using OpenCV and PCL (PnP + LM optimization) — github.com,” https://github.com/heethesh/lidar camera calibration.git, [Accessed 21-08-2024]
2024
-
[27]
Lego-loam: Lightweight and ground-optimized lidar odometry and mapping on variable terrain,
T. Shan and B. Englot, “Lego-loam: Lightweight and ground-optimized lidar odometry and mapping on variable terrain,” in 2018 IEEE/RSJ International Conference on Intelligent Robots and Systems (IROS) , 2018, pp. 4758–4765
2018
-
[28]
Quantitative hyperspectral reflectance imaging,
M. E. Klein, B. J. Aalderink, R. Padoan, G. De Bruin, and T. A. G. Steemers, “Quantitative hyperspectral reflectance imaging,” Sensors (Basel), vol. 8, no. 9, pp. 5576–5618, Sep. 2008
2008
-
[29]
Hyperspectral reflectance imaging for water content and firmness prediction of potatoes by optimum wavelengths,
L. Cui, X. Wang, Y . Xu, Y . Li, and M. Han, “Hyperspectral reflectance imaging for water content and firmness prediction of potatoes by optimum wavelengths,” Journal of Consumer Protection and Food Safety, vol. 17, no. 1, pp. 51–64, Mar 2022. [Online]. Available: https://doi....
2022 doi
-
[30]
Classification of hyperspectral reflectance images with physical and statistical criteria,
A. Alakian and V . Achard, “Classification of hyperspectral reflectance images with physical and statistical criteria,” Remote Sensing, vol. 12, no. 14, 2020. [Online]. Available: https: //www.mdpi.com/2072-4292/12/14/2335
2020
Reviewed August 12, 2026 · model on record in the stance chip above.
Discussion (0). Continue with ORCID to comment.