REVIEW 3 major objections 5 minor 53 references
Dimming events of evolved stars due to clouds of molecular gas. Scenarios based on 3D radiation-hydrodynamics simulations with CO5BOLD
T0 review · 3 major / 5 minor · reviewed 2026-08-12 · deepseek-v4-flash
Pith's one-line read Episodic levitation of dense gas clumps above the stellar surface, cooling into molecules, explains dark patches and strong dimming events in evolved stars such as Betelgeuse.
desk verdict A solid mechanism-taxonomy paper: three distinct ways cool molecular gas dims evolved stars, with an honest but real extrapolation gap to Betelgeuse. read the letter →
The pith
A machine-rendered reading of the paper's core claim, the machinery that carries it, and where it could break.
The reading
What carries the argument
The central object is the 'star-in-a-box' global 3D radiation-hydrodynamics model computed with the CO5BOLD code: a Cartesian box containing a whole star, with a spherically symmetric gravitational potential, nonlocal radiative transfer, gray Rosseland opacities extended by low-temperature molecular opacity tables, a tabulated equation of state that includes H2 formation, and a small energy-source core. The machinery couples large-scale convection in the stellar interior, self-excited radial and non-radial pulsations, and strong radiative shocks in the atmosphere; from its output, bolometric intensity maps, radial density-temperature-opacity profiles, and synthetic spectra are used to show where, when, and why a dark patch forms.
What would settle it
Observe a resolved dimming event on a Betelgeuse-class star with simultaneous imaging and spectroscopy: the molecular-gas model predicts a dark patch with strong TiO and H2O absorption from gas cooler than about 2600 K, outward motion within the patch, the strongest flux drop in the visual band, and little spectral change outside the patch. A patch that instead shows gray extinction without molecular bands, mid-infrared thermal dust emission, or a dark feature moving across the disk as a foreground cloud would falsify the model for that event.
Extended reading notes
Core claim
The paper's central claim is that the episodic levitation of dense gas clumps above the stellar surface, followed by the formation of complex molecules in the cooling gas and possibly dust grains at a later stage, can account for the dark patches and strong dimming events of supergiant stars such as Betelgeuse. In the simulations the dimming is caused by gas alone: dense material is pushed above the top of the convection zone by one of three mechanisms, expands and radiatively cools, and once its temperature drops below roughly 2000 to 2600 K the steeply rising molecular opacities, TiO in the optical and H2O in the near-infrared, make the clump optically thick and dark against the photosphere. The same physics produces nearly global obscuration in low-mass AGB stars during pulsation minima and rarer, localized patches in 5 to 8 solar-mass models, and the authors propose the Rayleigh-Taylor plume and convective-rebound scenarios as the plausible mechanisms for Betelgeuse.
Load-bearing premise
The load-bearing premise is that the mechanisms seen in models of 1 to 8 solar-mass stars also operate in Betelgeuse-class supergiants above 10 solar masses, even though the models themselves are acknowledged to have too-compact atmospheres and reduced pulsation amplitudes at higher masses.
Editorial extensions
If this is right
- Dark patches appear in all of the models whenever dense gas is levitated above the convection zone, cools below roughly 2000 to 2600 K, and forms molecules; the patches are never uniform and show substructure.
- In low-mass AGB models the same mechanism produces almost global obscuration at pulsation minima, while in 5 to 8 solar-mass models only localized, intermittent patches form, mostly near luminosity minima.
- For Betelgeuse, the Rayleigh-Taylor plume and convective-rebound scenarios are the viable candidates, and the dimming should be tied to the pulsation cycle and stay in one region of the disk, as the resolved images show.
- Because the obscuring material is molecular gas, the visual flux can drop by orders of magnitude while the spectral energy distribution outside the patch changes little; dust is not required for the dimming itself.
Reading between the lines
- Extension: if improved higher-mass models produced stronger pulsations and less compact atmospheres, plumes and rebounds would likely become more frequent, so the current 1 to 8 solar-mass results may underestimate how often Betelgeuse-class stars dim.
- Extension: the three scenarios are hard to distinguish in a single image but have different anchors—plumes form above global convective upflows, rebounds above downdrafts, and post-shock clumps are not tied to either—so time-resolved Doppler maps of a forming patch could identify the mechanism in a real event.
- Extension: a testable prediction follows: during a dimming minimum, spectroscopy of the dark patch should show strong TiO and H2O bands from gas cooler than about 2600 K with outward line-of-sight velocities, and no coincident thermal dust emission; if those signatures are absent, a molecular-gas cloud is not the cause.
Editorial analysis
A structured set of objections, weighed in public.
Referee Report
Summary. The paper analyzes a set of global 3D radiation-hydrodynamical 'star-in-a-box' simulations of evolved stars (M⋆ = 1.0, 1.5, 5.0, and 8.0 M⊙) computed with the CO5BOLD code, which include self-excited pulsations, convection, and shock-dominated atmospheric dynamics. It identifies three mechanisms that lift cool, dense gas above the top of the convection zone and produce dark patches in bolometric intensity maps: (i) Rayleigh-Taylor plumes triggered by the combination of large convective upflows and strong radial pulsations (Sect. 3, demonstrated in the 5 M⊙ model st35gm04n045); (ii) a rare 'convective rebound' event following the merging of deep downdrafts, which produced a single prominent dimming episode in the 5 M⊙ model st35gm04n048 (Sect. 4); and (iii) nearly global obscuration by cool post-shock gas in the lower-mass, cooler AGB models (Sect. 5). The authors combine intensity maps, radial profiles, ray-based spectrum synthesis, and light curves to argue that the associated cooling, molecular-opacity increase, and TiO/H2O absorption can account for the dark patches and strong dimming events of red supergiants such as Betelgeuse, while acknowledging (Sect. 6.6) that the application to Betelgeuse requires an extrapolation beyond the mass range of the models. The final section explicitly frames the transfer to massive RSGs as an assumption and the dust-forming corollary as speculation.
Significance. If the mechanisms hold up, the paper provides a physically concrete, three-channel classification of dimming phenomena in evolved stars that can be confronted with interferometric imaging, photometric light curves, and time-resolved spectroscopy of AGB stars and red supergiants. The main strengths are that the dark patches are an emergent outcome of self-consistent 3D RHD models rather than a prescribed boundary condition; that the analysis connects the hydrodynamics (dynamical pressure, Rayleigh-Taylor instabilities, shocks) to observable signatures (molecular opacity feedback, TiO/H2O bands, wavelength-dependent darkening); and that the paper is unusually candid about its own limitations, including the manual selection of snapshots (Sect. 2.3), the single-event basis of the rebound scenario (Sect. 4), and the admitted interior deficiencies of CO5BOLD models for higher-mass RSGs (Sect. 6.6). The steps that currently carry the largest uncertainty are the transfer of mechanisms demonstrated at 5-8 M⊙ to a >10 M⊙ red supergiant, and the translation of local dark patches into disk-integrated dimming amplitudes; both are flagged as assumptions or extrapolations in the text.
major comments (3)
- [§1, §3.5, §6.6] The paper asserts that the local darkening produces 'a strong dimming of the disc-integrated light' with V-band fluxes 'decreasing by orders of magnitude' and that the processes have 'little effect on the shape of disk-integrated spectra', but the manuscript presents only ray-based spectra (Fig. 9) and bolometric observer-integrated normalized intensities (Figs. 5, 12, 14); no synthetic disk-integrated spectrum, broadband (e.g., V-band) light curve, or spectroscopically derived effective temperature is computed for any dimming epoch. Since these wavelength-dependent, disk-integrated quantities are precisely the observables used in Sect. 6.6 to connect the model to the Great Dimming of Betelgeuse, this is a load-bearing gap; the authors should compute synthetic disk-integrated photometry/spectra for the dimming events in st35gm04n045, st35gm04n048, and st28gm05n056, or explicitly downgrade the corresponding claims.
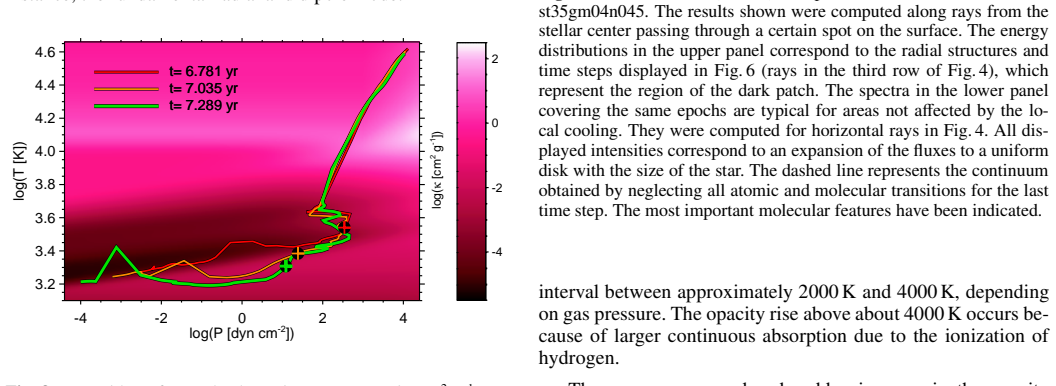
- [§6.6, §7] The transfer of the mechanisms to Betelgeuse rests on an acknowledged extrapolation: Sect. 6.6 states that CO5BOLD models of higher-mass RSGs suffer from an insufficient description of the stellar interior (likely missing radiation pressure, possibly missing self-gravity, and a contribution from the damping inner boundary condition), which reduces pulsation amplitudes and large-scale convective flows and presumably makes the atmosphere too compact, and the grid contains no model between 8 M⊙ and Betelgeuse's mass. The conclusion that the mechanisms 'will also work in the slightly hotter atmospheres of massive RSGs' is labeled 'We assume' (Sect. 7). Because both the plume and rebound scenarios depend on the coupling between pulsations and convection, this is a correctness-risk rather than a presentation issue; I ask for a concrete scaling argument (for example, using the Pdyn/P and Mach-number profiles in Fig. 15 together with Betelgeuse's observed pulsation amplitudes and surface gravity) that shows the expected direction and magnitude of the bias, or a clear statement of which observations would discriminate the scenarios.
- [§2.3, §4, Abstract] The claimed frequencies are not quantified. The abstract states that AGB stars show dark patches 'regularly during intermediate phases' while more massive stars show them 'only intermittently', and that the rebound process is 'the third and rarest scenario', but Sect. 2.3 states that snapshots were manually selected, and Sect. 4 reports only one prominent rebound event in 'around a hundred models' without specifying the search criterion, the number of models inspected, or the definition of 'prominent'. Either provide a systematic (even simple) detection statistic for dark patches and light-curve minima across the available model runs, or explicitly qualify these frequency statements as preliminary, since the scenario classification by rarity is part of the paper's claims.
minor comments (5)
- [Fig. 1 caption] The top-row caption lists 'st28gm06n056' for the model with Teff≈2848 K and refers to it as the opposite side of the model in Fig. 13, but Table 1 and Fig. 13 identify that model as st28gm05n056; the caption should be corrected.
- [Fig. 14 caption] The final sentence of the caption contains a typo: 'The timer for this model does not start at zero' should read 'The time for this model does not start at zero'.
- [§3.5] The ray-based spectra in Fig. 9 are computed at resolution R=200 with a microturbulent velocity of 2.5 km/s and without velocity-field effects; given that the dark patch material moves at tens of km/s relative to the photosphere, a brief statement of how Doppler shifts would affect the molecular-band depths would strengthen the quantitative interpretation.
- [§2.3] The caption of Fig. 1 states that the snapshots of the 5 and 8 M⊙ models were 'selected such that large-scale — comparably rare — dark patches are visible'; it would be useful to state in the text how many snapshots per model were inspected and how the displayed instances were chosen, to give the reader a sense of the selection bias.
- [Fig. 6 caption] The symbol 'Maradial' in the caption appears to be the radial Mach number with a subscript that has not rendered properly; please fix the notation.
Circularity Check
No significant circularity: the dark-patch mechanisms emerge from self-contained 3D RHD simulations, and the Betelgeuse application is explicitly presented as extrapolation, not as a fitted prediction.
full rationale
The paper's central derivation is an emergent result of CO5BOLD star-in-a-box simulations: convective flows, self-excited pulsations, shocks, and molecular opacities combine to levitate cool dense gas that appears as dark patches. No parameter is fitted to Betelgeuse's 2019/2020 light curve, and the dimming events are not tuned inputs; they are found in the time series and then classified into three scenarios. The CO5BOLD code and COMA opacity tables are prior published tools with independent validation and external use, so citing them is standard method attribution rather than circular support. The only place where the paper reaches beyond its computed grid is the application to Betelgeuse, and there the paper is explicit: Sect. 6.6 states that models of higher-mass RSGs 'suffer from an insufficient description of the stellar interior' and that application 'needs some extrapolation', and the Conclusions say 'We assume' and 'We speculate' for massive RSGs and possible dust. That is a clearly flagged extrapolation, which is a correctness risk, not a circularity. No equation reduces to a fitted input, no self-citation is load-bearing for the claim that the mechanisms operate, and no known result is merely renamed.
Assumptions & free parameters
assumptions (5)
- domain assumption Fixed gravitational potential with energy source term in the core replaces full stellar interior
- domain assumption Gray Rosseland opacities for radiative transfer
- domain assumption No dust formation or radiation pressure on dust
- ad hoc to paper Extrapolation from 1-8 Msun models to Betelgeuse-like RSGs (M > 10 Msun)
- domain assumption Solar-like chemical abundances and COMA opacity data
Cite this review
Pith. "Pith review of Dimming events of evolved stars due to clouds of molecular gas. Scenarios based on 3D radiation-hydrodynamics simulations with CO5BOLD." pith.science (2026). https://pith.science/paper/ICUIDTBD
@misc{pith2026241117561,
  author       = {Pith},
  title        = {Pith review of: Dimming events of evolved stars due to clouds of molecular gas. Scenarios based on 3D radiation-hydrodynamics simulations with CO5BOLD},
  year         = {2026},
  howpublished = {\url{https://pith.science/paper/ICUIDTBD}},
  note         = {Machine review of arXiv:2411.17561}
}
read the original abstract
The dramatic dimming episode of the red supergiant Betelgeuse in 2019/2020, caused by a partial darkening of the stellar disk, has highlighted gaps in the understanding of the evolution of massive stars. We analyzed numerical models to investigate the processes behind the formation of dark surface patches and the associated reduction in the disk-integrated stellar light. With the CO5BOLD code, we performed global 3D radiation-hydrodynamical simulations of evolved stars, including convection in the stellar interior, self-excited pulsations, and the resulting atmospheric dynamics with strong radiative shocks. We attribute dimming phenomena to obscuring clouds of cool gas in the lower atmosphere, forming according to three different scenarios. One process transports material outward in a strong shock, similar to what occurs in 1D simulations of radially pulsating AGB stars. Another mechanism is triggered by a large convective upflow structure, in combination with exceptionally strong radial pulsations. This induces Rayleigh-Taylor instabilities, causing plumes of material to be sent outward into the atmosphere. The third and rarest scenario involves large-amplitude convective fluctuations, leading to enhanced flows in deep downdrafts, which rebound and send material outward. In all cases, the dense gas above the stellar surface cools and darkens rapidly in visible light. AGB stars show localized dark patches regularly during intermediate phases of their large-amplitude pulsations, while more massive stars will only intermittently form such patches during luminosity minima. The episodic levitation of dense gas clumps above the stellar surface, followed by the formation of complex molecules in the cooling gas and possibly dust grains at a later stage, can account for the dark patches and strong dimming events of supergiant stars such as Betelgeuse.
Figures


Figures from the paper (13 more)




Reference graph
Works this paper leans on
-
[1]
2023, A&A, 669, A49
Ahmad, A., Freytag, B., & Höfner, S. 2023, A&A, 669, A49
2023
- [2]
-
[3]
Aringer, B., Girardi, L., Nowotny, W., Marigo, P ., & Bressan, A. 2016, MNRAS, 457, 3611
work page 2016
-
[4]
Aringer, B., Marigo, P ., Nowotny, W., et al. 2019, MNRAS, 487, 2133
work page 2019
-
[5]
Bladh, S., Höfner, S., Aringer, B., & Eriksson, K. 2015, A&A, 575, A105
work page 2015
-
[6]
Bladh, S., Höfner, S., Nowotny, W., Aringer, B., & Eriksson, K. 2013, A&A, 553, A20
work page 2013
-
[7]
Bladh, S., Liljegren, S., Höfner, S., Aringer, B., & Marigo, P . 2019, A&A, 626, A100
work page 2019
-
[8]
Burns, D., Baldwin, J. E., Boysen, R. C., et al. 1997, MNRAS, 2 90, L11
work page 1997
Show all 53 references
-
[9]
F., Baldwin, J
Buscher, D. F., Baldwin, J. E., Warner, P . J., & Hani ff, C. A. 1990, MNRAS, 245, 7 Caffau, E., Ludwig, H. G., & Ste ffen, M. 2009a, Mem. Soc. Astron. Italiana, 80, 643 Caffau, E., Maiorca, E., Bonifacio, P ., et al. 2009b, A&A, 498, 87 7
1990
-
[10]
2023, A&A, 675 , A46
Cannon, E., Montargès, M., de Koter, A., et al. 2023, A&A, 675 , A46
2023
-
[11]
& Stein, R
Carlsson, M. & Stein, R. F. 1992, ApJ, 397, L59
1992
-
[12]
2011, A& A, 535, A22
Chiavassa, A., Freytag, B., Masseron, T., & Plez, B. 2011, A& A, 535, A22
2011
-
[13]
2010, A&A, 511 , A51
Chiavassa, A., Lacour, S., Millour, F., et al. 2010, A&A, 511 , A51
2010
-
[14]
E., Mairs, S., Scicluna, P ., et al
Dharmawardena, T. E., Mairs, S., Scicluna, P ., et al. 2020, ApJ, 897, L9
2020
-
[15]
2013, Mem
Freytag, B. 2013, Mem. Soc. Astron. Italiana Suppl., 24, 26
2013
-
[16]
2017, Mem
Freytag, B. 2017, Mem. Soc. Astron. Italiana, 88, 12
2017
-
[17]
& Chiavassa, A
Freytag, B. & Chiavassa, A. 2013, in EAS Publications Series , V ol. 60, EAS Publications Series, ed. P . Kervella, T. Le Bertre, & G. Perrin, 137–144
2013
-
[18]
& Höfner, S
Freytag, B. & Höfner, S. 2008, A&A, 483, 571
2008
-
[19]
& Höfner, S
Freytag, B. & Höfner, S. 2023, A&A, 669, A155
2023
-
[20]
2017, A&A, 600, A137
Freytag, B., Liljegren, S., & Höfner, S. 2017, A&A, 600, A137
2017
-
[21]
2002, Astronomische Nachrichten, 323, 213
Freytag, B., Ste ffen, M., & Dorch, B. 2002, Astronomische Nachrichten, 323, 213
2002
-
[22]
2012, J.Comput.Phys., 231, 919
Freytag, B., Steffen, M., Ludwig, H.-G., et al. 2012, J.Comput.Phys., 231, 919
2012
-
[23]
D., Marchetti, J., McMillan, S., et al
Gehrz, R. D., Marchetti, J., McMillan, S., et al. 2020, The As tronomer’s Tele- gram, 13518, 1
2020
-
[24]
A., Jiang, Y .-F., & Bildsten, L
Goldberg, J. A., Jiang, Y .-F., & Bildsten, L. 2022, ApJ, 929, 156
2022
-
[25]
Gray, D. F. 2000, ApJ, 532, 487
2000
-
[26]
Guinan, E. F. & Wasatonic, R. J. 2020, The Astronomer’s Teleg ram, 13410, 1
2020
-
[27]
G., Milli, J., et al
Haubois, X., van Holstein, R. G., Milli, J., et al. 2023, A&A, 679, A8 Höfner, S., Bladh, S., Aringer, B., & Ahuja, R. 2016, A&A, 594 , A108 Höfner, S., Bladh, S., Aringer, B., & Eriksson, K. 2022, A&A, 657, A109 Höfner, S. & Freytag, B. 2019, A&A, 623, A158
2023
-
[28]
A., Rogers, F
Iglesias, C. A., Rogers, F. J., & Wilson, B. G. 1992, ApJ, 397, 717 Jadlovský, D., Krti ˇcka, J., Paunzen, E., & Štefl, V . 2023, New A, 99, 101962
1992
-
[29]
2020, ApJ, 902, 63
Joyce, M., Leung, S.-C., Molnár, L., et al. 2020, ApJ, 902, 63
2020
-
[30]
L., Drake, J
Kashyap, V . L., Drake, J. J., & Patnaude, D. 2020, The Astrono mer’s Telegram, 13501, 1
2020
-
[31]
Kervella, P ., Decin, L., Richards, A. M. S., et al. 2018, A&A, 609, A67
2018
-
[32]
Khouri, T., Maercker, M., Waters, L. B. F. M., et al. 2016, A&A , 591, A70
2016
-
[33]
Khouri, T., Vlemmings, W. H. T., Olofsson, H., et al. 2018, A& A, 620, A75
2018
-
[34]
2019, A&A, 632, A28
Kravchenko, K., Chiavassa, A., V an Eck, S., et al. 2019, A&A, 632, A28
2019
-
[35]
2021, A&A, 6 50, L17
Kravchenko, K., Jorissen, A., V an Eck, S., et al. 2021, A&A, 6 50, L17
2021
-
[36]
2012, ApJ, 749, 136
Leenaarts, J., Carlsson, M., & Rouppe van der V oort, L. 2012, ApJ, 749, 136
2012
-
[37]
2020, British Astronomical Association V ariableStar Section Circular, 184, 22
Lloyd, C. 2020, British Astronomical Association V ariableStar Section Circular, 184, 22
2020
-
[38]
E., et al
Ma, J.-Z., Chiavassa, A., de Mink, S. E., et al. 2024, ApJ, 962 , L36
2024
-
[39]
P ., Perdelwitz, V ., Jack, D., & Schm itt, J
Mittag, M., Schröder, K. P ., Perdelwitz, V ., Jack, D., & Schm itt, J. H. M. M. 2023, A&A, 669, A9 Montargès, M., Cannon, E., Lagadec, E., et al. 2021, Nature, 594, 365
2023
-
[40]
J., & Kupka, F
Mundprecht, E., Muthsam, H. J., & Kupka, F. 2013, MNRAS, 435, 3191 Nordlund, Å. & Stein, R. F. 2001, ApJ, 546, 576
2013
-
[41]
2016, A&A, 589, A91
Ohnaka, K., Weigelt, G., & Hofmann, K.-H. 2016, A&A, 589, A91
2016
-
[42]
2017, A&A, 597, A20
Ohnaka, K., Weigelt, G., & Hofmann, K.-H. 2017, A&A, 597, A20
2017
-
[43]
2018, Nature, 5 53, 310
Paladini, C., Baron, F., Jorissen, A., et al. 2018, Nature, 5 53, 310
2018
-
[44]
2020, The Ast ronomer’s Telegram, 13525, 1
Sbordone, L., Paladini, C., Antilen, J., et al. 2020, The Ast ronomer’s Telegram, 13525, 1
2020
-
[45]
1975, ApJ, 195, 137
Schwarzschild, M. 1975, ApJ, 195, 137
1975
-
[46]
Stein, R. F. & Nordlund, Å. 2001, ApJ, 546, 585
2001
-
[47]
& Leung, K.-C
Stothers, R. & Leung, K.-C. 1971, A&A, 10, 290
1971
-
[48]
G., Haniff, C
Tuthill, P . G., Haniff, C. A., & Baldwin, J. E. 1997, MNRAS, 285, 529
1997
-
[49]
1953, ZAp, 32, 135
Vitense, E. 1953, ZAp, 32, 135
1953
-
[50]
2004, A&A, 414, 1121
Wedemeyer, S., Freytag, B., Ste ffen, M., Ludwig, H.-G., & Holweger, H. 2004, A&A, 414, 1121
2004
-
[51]
2017, A&A, 606, A26
Wedemeyer, S., Ku ˇcinskas, A., Klevas, J., & Ludwig, H.-G. 2017, A&A, 606, A26
2017
-
[52]
Wheeler, J. C. & Chatzopoulos, E. 2023, Astronomy and Geophy sics, 64, 3.11
2023
-
[53]
W., Dhillon, V
Wilson, R. W., Dhillon, V . S., & Haniff, C. A. 1997, MNRAS, 291, 819 Y oung, J. S., Baldwin, J. E., Boysen, R. C., et al. 2000, MNRAS , 315, 635 Article number, page 19 of 19
1997
Reviewed August 12, 2026 · model on record in the stance chip above.
Discussion (0). Continue with ORCID to comment.