REVIEW 3 major objections 6 minor 65 references
Chemically Self-Consistent Modeling of the Globular Cluster NGC 2808 and its Effects on the Inferred Helium Abundance of Multiple Stellar Populations
T0 review · 3 major / 6 minor · reviewed 2026-08-12 · deepseek-v4-flash
Pith's one-line read Chemically self-consistent stellar models of NGC 2808 still find a helium difference of $\Delta Y = 0.15 \pm 0.03$ between its first and second stellar populations, matching earlier non-self-consistent fits.
desk verdict First chemically self-consistent models of NGC 2808 and a solid new fitting tool, but the helium error bar is really the grid spacing and the best-fit Y values sit on grid edges. read the letter →
The pith
A machine-rendered reading of the paper's core claim, the machinery that carries it, and where it could break.
The reading
What carries the argument
The load-bearing machinery is a set of chemically self-consistent stellar models built with the DSEP stellar evolution code, using MARCS model atmospheres as surface boundary conditions, OPLIB high-temperature opacities, and AESOPUS low-temperature opacities, all computed with the same CNO-enhanced or CNO-depleted abundances adopted for each population. On top of these models, the new fitting code Fidanka automatically measures fiducial lines by estimating local number density and clustering with Bayesian Gaussian Mixture Modeling, then fits pairs of isochrones to the photometry. The helium mass fraction is the only abundance left free in the fit, so the inferred $\Delta Y$ directly reflects the color separation between the two sequences.
What would settle it
Refit the same HUGS photometry with the light-element abundances varied across the spectroscopic uncertainties of the two populations; if the best-fit helium difference moves outside $\Delta Y=0.15 \pm 0.03$, then the inferred helium jump is not robust to the adopted composition.
Extended reading notes
Core claim
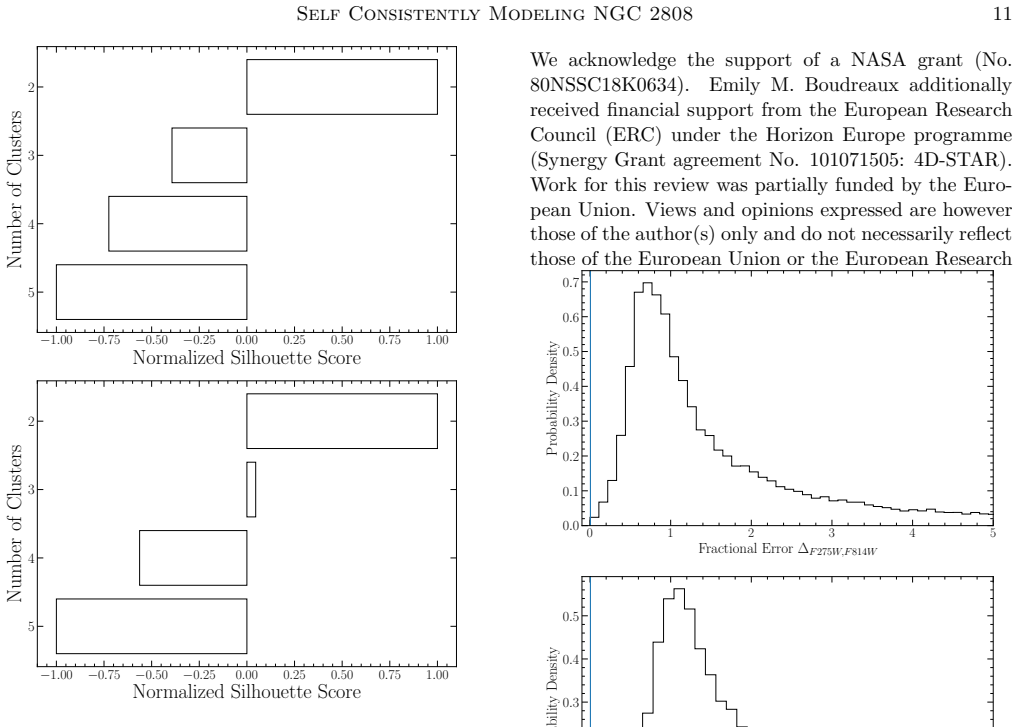
The central claim is that making globular cluster models chemically self-consistent, matching the abundances used in the stellar atmosphere, in the high- and low-temperature opacities, and in the interior structure, leaves the inferred helium enrichment of the second generation essentially unchanged. For NGC 2808 the best-fit chemically self-consistent isochrones give a helium mass fraction of $Y=0.24$ for the primordial population and $Y=0.39$ for the helium-enriched population, a difference of $\Delta Y=0.15\pm 0.03$ that agrees with previous non-self-consistent determinations. The paper also reports that the same photometric data, analyzed with its automated method, support only two distinct populations, consistent with recent spectroscopic analyses. Together with earlier self-consistent modeling of NGC 6752, the result implies that the extra effort of full chemical consistency changes inferred helium abundances by less than the uncertainties.
Load-bearing premise
The inferred helium difference rests on the adopted C, N, O, and other light-element abundances for the two populations being correct, because helium is the only abundance left free in the fit.
Editorial extensions
If this is right
- NGC 2808's first and second populations have helium mass fractions $Y=0.24$ and $Y=0.39$, respectively.
- The inferred helium difference agrees with earlier non-self-consistent fits within uncertainties, so the previous helium estimates for this cluster are not biased by their simpler chemistry.
- Only two stellar populations are preferred in the F275W-F814W photometry, consistent with recent spectroscopic analyses of NGC 2808.
- Fidanka provides an automated, uncertainty-aware path for fitting isochrones to multiple populations in other globular clusters.
- Full chemical self-consistency changes inferred helium abundances by less than the current model grid spacing, making it unlikely to be worth the significant additional time investment for helium-inference studies.
Reading between the lines
- If the conclusion generalizes, then helium abundances inferred for many globular clusters from simpler models are probably trustworthy, and the dominant systematic is the adopted light-element pattern rather than the consistency of the modeling.
- The two-population result in this two-filter CMD does not rule out extra populations that appear only in chromosome maps built from additional filters; a natural test is to run the same fitting pipeline on chromosome-map variables once the uncertainty propagation is worked out.
- A direct robustness check is to repeat the fit with the CNO abundances varied across the full spectroscopic uncertainty ranges; a stable $\Delta Y$ would strengthen the result, while a large shift would show the helium difference is partly an artifact of the assumed composition.
Editorial analysis
A structured set of objections, weighed in public.
Referee Report
Summary. The paper presents chemically self-consistent stellar structure and evolutionary models of the globular cluster NGC 2808, constructed with DSEP using MARCS model atmospheres, OPLIB high-temperature opacities, and AESOPUS low-temperature opacities. The models are fit to HUGS F275W-F814W photometry with the new software package Fidanka, which the authors also introduce and validate with injection-recovery tests. Fitting two populations (P1 and P2) simultaneously, the authors report helium mass fractions Y=0.24 and Y=0.39, respectively, a difference of ΔY=0.15±0.03, which they state is consistent with previous non-self-consistent determinations. They conclude that chemically self-consistent modeling does not significantly change inferred helium abundances for multiple populations, echoing earlier work on NGC 6752 by Dotter et al. (2015). The paper also reports evidence from silhouette analysis that only two populations are present in the F275W-F814W CMD, in contrast to the five populations identified by Milone et al. (2015a).
Significance. If the central quantitative claim were robust, the paper would provide a valuable validation that chemical self-consistency in globular cluster isochrones does not materially alter inferred helium spreads, and the open-source Fidanka package with its injection-recovery tests would be a useful community resource. The authors also release their isochrone grid on Zenodo, which is a reproducibility strength. However, the main result, ΔY=0.15±0.03, is currently weakened by the fact that both fitted helium values sit at the boundaries of the computed grid and by the lack of any likelihood-based uncertainty estimate. The negative result (self-consistency does not change the helium difference) is plausible and interesting, but it needs firmer statistical support before the paper can be accepted.
major comments (3)
- [§3, Table 4] The best-fit values Y_P1=0.24 and Y_P2=0.39 lie exactly at the lower and upper edges of the helium grid (Y=0.24, 0.27, 0.30, 0.33, 0.36, 0.39), and α_ML(P1)=2.050 lies outside the tabulated α_ML range of 1.0–2.0. The quoted ΔY=0.15 is therefore the full span of the helium grid, and the ±0.03 uncertainty is the grid spacing, not a likelihood-based confidence interval. The manuscript presents no χ² profile or marginal likelihood for Y or α_ML, so it is impossible to determine whether the true optimum is interior to the grid or beyond its boundaries. This is load-bearing because the paper's central claim of ΔY=0.15±0.03 rests on these boundary values. Please extend the grid (e.g., Y below 0.24 and above 0.39, α_ML above 2.0) and report confidence regions from the likelihood surface or a bootstrap, or demonstrate explicitly that the χ² surface is flat beyond the current boundaries.
- [§5, Table 4] Only the ages have quoted 1σ uncertainties in Table 4; there are no uncertainties reported for Y, α_ML, distance modulus, or extinction, and no covariance analysis for the six simultaneously fitted parameters (μ_P1, μ_P2, E(B-V)_P1, E(B-V)_P2, Age_P1, Age_P2) or between those parameters and the discrete grid parameters Y and α_ML. The abstract's '15±3%' therefore does not follow from any error propagation shown in the paper; the text itself notes that the helium grid spacing prevents resolution of values such as 0.37 vs. 0.39. Please provide a joint confidence region or, at minimum, a χ² map over the Y–α_ML plane for each population, and give the statistical definition of the quoted uncertainty.
- [§3, Tables 1 and 2] The helium inference is made with all light-element abundances (C, N, O, Na, etc.) fixed to the values adopted from Milone et al. (2015a) for populations A and E. Since Y is the only free abundance in the isochrone fitting, any error in the adopted CNO pattern, in the α-element enhancement, or in the measured population separation will be absorbed into the fitted helium and bias the derived ΔY. The paper does not propagate uncertainties from the adopted spectroscopic abundances into the helium result. Please include a sensitivity study—for example, recomputing the fit with C, N, O, and α abundances shifted by their reported uncertainties—to bound the systematic contribution to ΔY.
minor comments (6)
- [§3, Table 2] Table 2 lists Y=0.2700 for population A(1) and Y=0.2400 for population E(2), which is opposite to the expected helium enrichment of population E/P2 and inconsistent with the best-fit values in Table 4 (Y_P1=0.24, Y_P2=0.39). Please clarify what the X, Y, and Z columns in Table 2 represent and reconcile this apparent typographical or labeling error, as it affects the reproducibility of the model grid.
- [§3] The text refers to 'see Tables 3 and 2' when describing the chemical compositions, but no Table 3 exists in the manuscript; the intended reference is presumably Table 1 and/or Table 2. Please correct this citation.
- [Throughout] There are numerous typographical errors that should be corrected, including 'isochohrones', 'Magellenic', 'Retrival', 'temperautre', 'consistant', 'preform', 'NCG 2808', 'we useis', and 'esimate'. A careful proofreading pass is needed.
- [§5.1, Figure 8] The silhouette analysis is described as an average over magnitude bins, but the paper does not specify how the silhouette scores are normalized or how bin-to-bin variation is treated statistically; a brief clarification of the averaging and normalization procedure would help the reader judge the robustness of the two-population conclusion.
- [§4.4, Figure 6] The percent error distribution for Av in Figure 6 shows values around -90% to -98%; since Av is a small quantity, this may be a large relative error, but the axis labeling should clarify whether the plotted quantity is a fractional error or a percent error relative to the true Av, and the text should explain why the recovery is so biased in this parameter.
- [Table 4] The table reports χ²/ν values without defining ν (the number of degrees of freedom). Please state how ν is computed for the fiducial-line fits, since the quoted goodness-of-fit values cannot be interpreted otherwise.
Circularity Check
No significant circularity: the inferred helium difference is a data-driven grid search, not a quantity built into the inputs.
full rationale
The helium inference is a standard model-fitting exercise, not a derivation that assumes its conclusion. The helium grid Y=0.24--0.39 is scanned as a free parameter; DSEP models and MARCS atmospheres are generated for each Y, and Fidanka minimizes chi2 between isochrones and the observed F275W-F814W fiducial lines. The final Y values are therefore data-determined outputs. The adopted CNO abundances are external inputs from Milone et al. (2015a), and the comparison with previous inferred Y values is an external benchmark, not a constraint fed into the fit. The use of DSEP/Dotter isochrone tools (co-developed by one of the present authors) is a code dependency, not a circularity, because the fitted parameters are not encoded in the code; Fidanka's own injection-recovery tests demonstrate that the fitting pipeline recovers known inputs. The boundary-location of the best-fit Y values and the grid-spacing-sized quoted uncertainty are legitimate methodological limitations (the true optimum may lie outside the tested grid), but they are not a reduction of the output to the input by construction. No step of the chain defines Y in terms of the reported ΔY, nor does any fitted parameter get renamed as a prediction.
Assumptions & free parameters
free parameters (5)
- Helium mass fraction Y for P1 and P2 =
0.24 and 0.39
- Mixing length parameter alpha_ML for P1 and P2 =
2.05 and 1.60
- Distance modulus mu for P1 and P2 =
15.021 and 15.007 mag
- Extinction E(B-V) for P1 and P2 =
0.54 and 0.537 mag
- Age for P1 and P2 =
12.996 and 13.061 Gyr
assumptions (5)
- standard math Standard stellar evolution physics in DSEP is reliable.
- domain assumption MARCS atmospheres and OPLIB/AESOPUS opacities with the same abundances provide accurate boundary conditions and opacities.
- domain assumption The abundance pattern for populations A and E from Milone et al. (2015a) is correct.
- domain assumption The color-magnitude separation between the two populations in F275W-F814W is primarily due to helium.
- domain assumption The Bayesian Gaussian Mixture Model with Dirichlet process correctly identifies the number of populations in the data.
Cite this review
Pith. "Pith review of Chemically Self-Consistent Modeling of the Globular Cluster NGC 2808 and its Effects on the Inferred Helium Abundance of Multiple Stellar Populations." pith.science (2026). https://pith.science/paper/YYNGBYYJ
@misc{pith2026241117562,
  author       = {Pith},
  title        = {Pith review of: Chemically Self-Consistent Modeling of the Globular Cluster NGC 2808 and its Effects on the Inferred Helium Abundance of Multiple Stellar Populations},
  year         = {2026},
  howpublished = {\url{https://pith.science/paper/YYNGBYYJ}},
  note         = {Machine review of arXiv:2411.17562}
}
abstract
The helium abundances in the multiple populations that are now known to comprise all closely studied Milky Way globular clusters are often inferred by fitting isochrones generated from stellar evolutionary models to globular cluster photometry. It is therefore important to build stellar models that are chemically self-consistent in terms of their structure, atmosphere, and opacity. In this work we present the first chemically self-consistent stellar models of the Milky Way globular cluster NGC 2808 using MARCS model atmospheres, OPLIB high-temperature radiative opacities, and AESOPUS low-temperature radiative opacities. These stellar models were fit to the NGC 2808 photometry using Fidanka , a new software tool that was developed to optimally fit cluster photometry to isochrones and for population synthesis. Fidanka can determine, in a relatively unbiased way, the ideal number of distinct populations that exist within a dataset and then fit isochrones to each population. We achieve this outcome through a combination of Bayesian Gaussian Mixture Modeling and a novel number density estimation algorithm. Using Fidanka and F275W-F814W photometry from the Hubble UV Globular Cluster Survey we find that the helium abundance of the second generation of stars in NGC 2808 is higher than the first generation by $15\pm3\%$. This is in agreement with previous studies of NGC 2808. This work, along with previous work by Dotter et al. (2015) focused on NGC 6752, demonstrates that chemically self-consistent models of globular clusters do not significantly alter inferred helium abundances, and are therefore unlikely to be worth the significant additional time investment.
Figures


Figures from the paper (5 more)


Reference graph
Works this paper leans on
- [1]
-
[2]
Anderson, J., Sarajedini, A., Bedin, L. R., et al. 2008, AJ, 135, 2055, doi: 10.1088/0004-6256/135/6/2055
-
[3]
B., Dobkin, D
Barber, C. B., Dobkin, D. P., & Huhdanpaa, H. 1996, ACM Transactions on Mathematical Software (TOMS), 22, 469
1996
-
[4]
2015, MNRAS, 453, 357, doi: 10.1093/mnras/stv1661
Bastian, N., & Lardo, C. 2015, MNRAS, 453, 357, doi: 10.1093/mnras/stv1661
-
[5]
2018, Annual Review of Astronomy and Astrophysics, 56, 83
Bastian, N., & Lardo, C. 2018, Annual Review of Astronomy and Astrophysics, 56, 83
2018
-
[6]
2002, The Astrophysical Journal, 566, 245, doi: 10.1086/337984 12 Boudreaux et al
Bekki, K., & Chiba, M. 2002, The Astrophysical Journal, 566, 245, doi: 10.1086/337984 12 Boudreaux et al
-
[7]
Boudreaux, E. M., & Chaboyer, B. C. 2023, ApJ, 944, 129, doi: 10.3847/1538-4357/acb685
-
[8]
2018, MNRAS, 1423, doi: 10.1093/mnras/sty1490
Boylan-Kolchin, M. 2018, MNRAS, 1423, doi: 10.1093/mnras/sty1490
Show all 65 references
-
[9]
P., & Strader, J
Brodie, J. P., & Strader, J. 2006, Annu. Rev. Astron. Astrophys., 44, 193
2006
-
[10]
H., Burkert, A., & Truran, J
Brown, J. H., Burkert, A., & Truran, J. W. 1991, ApJ, 376, 115, doi: 10.1086/170260 —. 1995, ApJ, 440, 666, doi: 10.1086/175304
1991 doi
-
[11]
2022, ApJL, 924, L2, doi: 10.3847/2041-8213/ac424a
Cadelano, M., Dalessandro, E., Salaris, M., et al. 2022, ApJL, 924, L2, doi: 10.3847/2041-8213/ac424a
2022 doi
-
[12]
2006, AJ, 131, 1766, doi: 10.1086/499565 —
Carretta, E. 2006, AJ, 131, 1766, doi: 10.1086/499565 —. 2013, A&A, 557, A128, doi: 10.1051/0004-6361/201322103 —. 2015, ApJ, 810, 148, doi: 10.1088/0004-637X/810/2/148
2006 doi
-
[13]
2004, ApJL, 610, L25, doi: 10.1086/423034
Carretta, E., Bragaglia, A., & Cacciari, C. 2004, ApJL, 610, L25, doi: 10.1086/423034
2004 doi
-
[14]
G., et al
Carretta, E., Bragaglia, A., Gratton, R. G., et al. 2010, Astronomy & Astrophysics, 516, A55
2010
-
[15]
P., Magee, N
Colgan, J., Kilcrease, D. P., Magee, N. H., et al. 2016, in APS Meeting Abstracts, Vol. 2016, APS Division of
2016
-
[16]
E., Pols, O
Abstracts, D1.008 de Mink, S. E., Pols, O. R., Langer, N., & Izzard, R. G. 2009, A&A, 507, L1, doi: 10.1051/0004-6361/200913205
2009 doi
-
[17]
2007, A&A, 464, 1029, doi: 10.1051/0004-6361:20066013
Decressin, T., Meynet, G., Charbonnel, C., Prantzos, N., & Ekstr¨ om, S. 2007, A&A, 464, 1029, doi: 10.1051/0004-6361:20066013
2007 doi
-
[18]
A., & Hartwick, F
Denissenkov, P. A., & Hartwick, F. D. A. 2014, MNRAS, 437, L21, doi: 10.1093/mnrasl/slt133 D’Ercole, A., D’Antona, F., Ventura, P., Vesperini, E., &
2014 doi
-
[19]
McMillan, S. L. W. 2010, MNRAS, 407, 854, doi: 10.1111/j.1365-2966.2010.16996.x D’Ercole, A., Vesperini, E., D’Antona, F., McMillan, S. L. W., & Recchi, S. 2008, MNRAS, 391, 825, doi: 10.1111/j.1365-2966.2008.13915.x
2010
-
[20]
2016, ApJS, 222, 8, doi: 10.3847/0067-0049/222/1/8
Dotter, A. 2016, ApJS, 222, 8, doi: 10.3847/0067-0049/222/1/8
2016 doi
-
[21]
2008, The Astrophysical Journal Supplement Series, 178, 89
Dotter, A., Chaboyer, B., Jevremovi´ c, D., et al. 2008, The Astrophysical Journal Supplement Series, 178, 89
2008
-
[22]
W., Conroy, C., et al
Dotter, A., Ferguson, J. W., Conroy, C., et al. 2015, MNRAS, 446, 1641, doi: 10.1093/mnras/stu2170
2015 doi
-
[23]
Ferguson, T. S. 1973, The annals of statistics, 209
1973
-
[24]
2004, ARA&A, 42, 385, doi: 10.1146/annurev.astro.42.053102.133945
Gratton, R., Sneden, C., & Carretta, E. 2004, ARA&A, 42, 385, doi: 10.1146/annurev.astro.42.053102.133945
2004
-
[25]
G., Carretta, E., & Bragaglia, A
Gratton, R. G., Carretta, E., & Bragaglia, A. 2012, Astronomy and Astrophysics Reviews, 20, 50, doi: 10.1007/s00159-012-0050-3
2012 doi
-
[26]
G., Lucatello, S., Carretta, E., et al
Gratton, R. G., Lucatello, S., Carretta, E., et al. 2011, A&A, 534, A123, doi: 10.1051/0004-6361/201117690
2011 doi
-
[27]
Grevesse, N., Asplund, M., & Sauval, A. J. 2007, SSRv, 130, 105, doi: 10.1007/s11214-007-9173-7
2007 doi
-
[28]
2008, A&A, 486, 951, doi: 10.1051/0004-6361:200809724
Gustafsson, B., Edvardsson, B., Eriksson, K., et al. 2008, A&A, 486, 951, doi: 10.1051/0004-6361:200809724
2008 doi
-
[29]
2021, AJ, 162, 130, doi: 10.3847/1538-3881/ac0ce6
Hong, S., Lim, D., Chung, C., et al. 2021, AJ, 162, 130, doi: 10.3847/1538-3881/ac0ce6
2021 doi
-
[30]
J., & Robison, B
Hudson, M. J., & Robison, B. 2018, Monthly Notices of the Royal Astronomical Society, 477, 3869, doi: 10.1093/mnras/sty844
2018 doi
-
[31]
O., Wende-von Berg, S., Dreizler, S., et al
Husser, T. O., Wende-von Berg, S., Dreizler, S., et al. 2013, A&A, 553, A6, doi: 10.1051/0004-6361/201219058 Jord´ an, A., Cˆ ot´ e, P., West, M. J., & Marzke, R. O. 2002, ApJL, 576, L113, doi: 10.1086/343759
2013 doi
-
[32]
S., & Richer, H
Kalirai, J. S., & Richer, H. B. 2010, Philosophical Transactions of the Royal Society of London Series A, 368, 755, doi: 10.1098/rsta.2009.0257
2010
-
[33]
I., Witzke, V., et al
Kostogryz, N., Shapiro, A. I., Witzke, V., et al. 2023, Research Notes of the AAS, 7, 39, doi: 10.3847/2515-5172/acc180
2023 doi
-
[34]
V., & Gnedin, O
Kravtsov, A. V., & Gnedin, O. Y. 2005, The Astrophysical Journal, 623, 650
2005
-
[35]
1993, Kurucz CD-Rom, 13
Kurucz, R.-L. 1993, Kurucz CD-Rom, 13
1993
-
[36]
O., Giesers, B., et al
Latour, M., Husser, T. O., Giesers, B., et al. 2019, A&A, 631, A14, doi: 10.1051/0004-6361/201936242
2019 doi
-
[37]
2009, A&A, 508, 1539, doi: 10.1051/0004-6361/200912598
Marigo, P., & Aringer, B. 2009, A&A, 508, 1539, doi: 10.1051/0004-6361/200912598
2009 doi
-
[38]
2022, ApJ, 940, 129, doi: 10.3847/1538-4357/ac9b40
Marigo, P., Aringer, B., Girardi, L., & Bressan, A. 2022, ApJ, 940, 129, doi: 10.3847/1538-4357/ac9b40
2022 doi
-
[39]
F., Milone, A
Marino, A. F., Milone, A. P., Karakas, A. I., et al. 2015, Monthly Notices of the Royal Astronomical Society, 450, 815, doi: 10.1093/mnras/stv420
2015 doi
-
[40]
2019, Monthly Notices of the Royal Astronomical Society, 487, 5324, doi: 10.1093/mnras/stz1596
Martocchia, S., Dalessandro, E., Lardo, C., et al. 2019, Monthly Notices of the Royal Astronomical Society, 487, 5324, doi: 10.1093/mnras/stz1596
2019 doi
-
[41]
P., Piotto, G., Bedin, L
Milone, A. P., Piotto, G., Bedin, L. R., et al. 2012, ApJ, 744, 58, doi: 10.1088/0004-637X/744/1/58
2012 doi
-
[42]
P., Marino, A
Milone, A. P., Marino, A. F., Piotto, G., et al. 2015a, ApJ, 808, 51, doi: 10.1088/0004-637X/808/1/51 —. 2015b, MNRAS, 447, 927, doi: 10.1093/mnras/stu2446
-
[43]
P., Piotto, G., Renzini, A., et al
Milone, A. P., Piotto, G., Renzini, A., et al. 2017, MNRAS, 464, 3636, doi: 10.1093/mnras/stw2531
2017 doi
-
[44]
P., Marino, A
Milone, A. P., Marino, A. F., Renzini, A., et al. 2018, MNRAS, 481, 5098, doi: 10.1093/mnras/sty2573
2018 doi
- [45]
-
[46]
2011, Journal of Machine Learning Research, 12, 2825
Pedregosa, F., Varoquaux, G., Gramfort, A., et al. 2011, Journal of Machine Learning Research, 12, 2825
2011
-
[47]
Peebles, P. J. E., & Dicke, R. H. 1968, ApJ, 154, 891, doi: 10.1086/149811 Self Consistently Modeling NGC 2808 13
1968 doi
-
[48]
W., Ferguson, H
Peng, E. W., Ferguson, H. C., Goudfrooij, P., et al. 2011, The Astrophysical Journal, 730, 23
2011
-
[49]
2018, HST UV Globular Cluster Survey (”HUGS”), STScI/MAST, doi: 10.17909/T9810F
Piotto, G. 2018, HST UV Globular Cluster Survey (”HUGS”), STScI/MAST, doi: 10.17909/T9810F
2018 doi
-
[50]
R., Anderson, J., et al
Piotto, G., Bedin, L. R., Anderson, J., et al. 2007, The Astrophysical Journal Letters, 661, L53, doi: 10.1086/518503
2007 doi
-
[51]
P., Bedin, L
Piotto, G., Milone, A. P., Bedin, L. R., et al. 2015, AJ, 149, 91, doi: 10.1088/0004-6256/149/3/91
2015 doi
-
[52]
2008, Physica Scripta Volume T, 133, 014003, doi: 10.1088/0031-8949/2008/T133/014003
Plez, B. 2008, Physica Scripta Volume T, 133, 014003, doi: 10.1088/0031-8949/2008/T133/014003
2008 doi
-
[53]
2007, A&A, 470, 179, doi: 10.1051/0004-6361:20077205
Prantzos, N., Charbonnel, C., & Iliadis, C. 2007, A&A, 470, 179, doi: 10.1051/0004-6361:20077205
2007 doi
-
[54]
2008, Monthly Notices of the Royal Astronomical Society, 391, 354, doi: 10.1111/j.1365-2966.2008.13892.x
Renzini, A. 2008, Monthly Notices of the Royal Astronomical Society, 391, 354, doi: 10.1111/j.1365-2966.2008.13892.x
2008
-
[55]
B., Fahlman, G
Richer, H. B., Fahlman, G. G., Buonanno, R., et al. 1991, ApJ, 381, 147, doi: 10.1086/170637
1991 doi
-
[56]
Rousseeuw, P. J. 1987, Journal of Computational and Applied Mathematics, 20, 53, doi: https://doi.org/10.1016/0377-0427(87)90125-7
1987 doi
-
[57]
2005, Evolution of stars and stellar populations (John Wiley & Sons)
Salaris, M., & Cassisi, S. 2005, Evolution of stars and stellar populations (John Wiley & Sons)
2005
-
[58]
Sandage, A. R. 1953, AJ, 58, 61, doi: 10.1086/106822
1953 doi
-
[59]
R., & Nicholas, C
Shahapure, K. R., & Nicholas, C. 2020, in 2020 IEEE 7th International Conference on Data Science and Advanced Analytics (DSAA), 747–748, doi: 10.1109/DSAA49011.2020.00096
2020
-
[60]
Smith, G. H. 1987, Publications of the Astronomical Society of the Pacific, 99, 67, doi: 10.1086/131958
1987 doi
-
[61]
P., Prosser, C
Sneden, C., Kraft, R. P., Prosser, C. F., & Langer, G. 1992, The Astronomical Journal, 104, 2121
1992
- [62]
-
[63]
2022, A&A, 658, A141, doi: 10.1051/0004-6361/202142454 van den Bergh, S
Valle, G., Dell’Omodarme, M., & Tognelli, E. 2022, A&A, 658, A141, doi: 10.1051/0004-6361/202142454 van den Bergh, S. 2010, The Astronomical Journal, 140, 1043, doi: 10.1088/0004-6256/140/4/1043
2022 doi
-
[64]
2009, A&A, 499, 835, doi: 10.1051/0004-6361/200811139
Ventura, P., & D’Antona, F. 2009, A&A, 499, 835, doi: 10.1051/0004-6361/200811139
2009 doi
-
[65]
2001, ApJL, 550, L65, doi: 10.1086/319496
Ventura, P., D’Antona, F., Mazzitelli, I., & Gratton, R. 2001, ApJL, 550, L65, doi: 10.1086/319496
2001 doi
Reviewed August 12, 2026 · model on record in the stance chip above.
Discussion (0). Continue with ORCID to comment.