REVIEW 4 major objections 5 minor 29 references
Utilizing Low-Cost Sensors to Monitor Indoor Air Quality in Mongolian Gers
T0 review · 4 major / 5 minor · reviewed 2026-08-12 · deepseek-v4-flash
Pith's one-line read Deploying low-cost particulate sensors across Ulaanbaatar gers, this field study concludes that an NGO insulation retrofit lowered indoor PM2.5 by 17.5% in coal-heated gers, by 19.1% in hybrid coal-electric gers, and by 48.9% in fully…
desk verdict Solid calibration and a useful field deployment, but the headline 17.5% insulation benefit is a single-sensor cross-sectional contrast that does not support the causal claim. read the letter →
The pith
A machine-rendered reading of the paper's core claim, the machinery that carries it, and where it could break.
The reading
What carries the argument
The argument is carried by a network of custom low-cost sensors, each built around a Sensirion SPS30 optical particle counter and an SCD30 CO2/temperature/humidity sensor with cellular upload and SD-card backup, at a cost near USD 200 per unit. Because optical particle counters undercount at high concentrations—a 'coincidence' effect where one particle shadows another—the authors calibrated the sensors against a TSI Optical Particle Sizer (model 3300) with a 10:1 diluter, burning anthracite coal in a stove similar to Mongolian stoves and fitting a second-order polynomial transfer function to correct the field data. The comparison design then sorts the gers into four classes (unmodified coal, modified coal, modified hybrid, modified electric-only), averages minute-level data over the deployment, and splits daytime (5 am–8 pm) from nighttime to separate cooking spikes from heating emissions.
What would settle it
Give every ger a sensor and weigh every bag of coal for one winter before and one winter after the insulation retrofit, with door-open events logged; if PM2.5 falls no more than the drop in coal burned would predict, the insulation's direct effect is not established.
Extended reading notes
Core claim
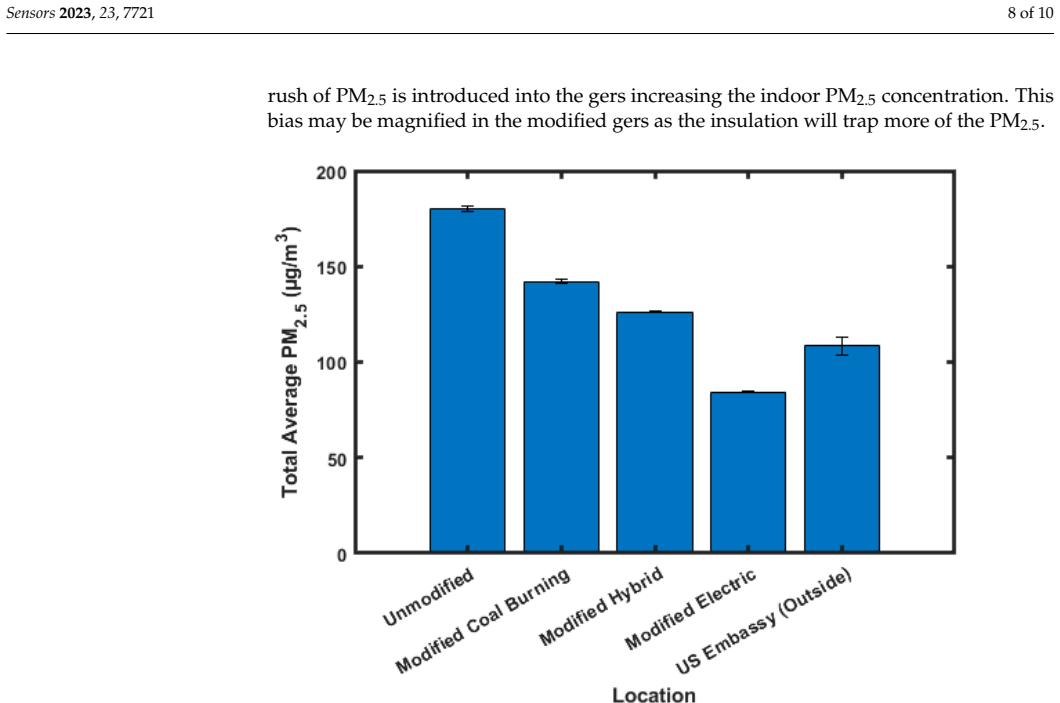
The paper's central claim is that insulating gers is favorable to indoor air quality despite also reducing ventilation. Averaged over the full study period, PM2.5 was 187.0 µg/m3 in unmodified coal-burning gers, 154.3 µg/m3 in insulated coal-burning gers, 151.4 µg/m3 in insulated hybrid coal-electric gers, and 95.5 µg/m3 in insulated electric-only gers, corresponding to drops of 17.5%, 19.1%, and 48.9% respectively. The authors attribute the reductions to lower coal consumption made possible by better heat retention, and they note that the added insulation can trap smoke for longer, an effect they consider outweighed by the emissions cut. They also report that fully electric gers still sit at 6.4 times the 15 µg/m3 health guideline and propose that smoke infiltrating from neighboring coal-burning gers is the reason. At night, outdoor PM2.5 averaged 229.0 µg/m3, higher than indoor levels in all but the modified coal-burning gers, which the paper reads as evidence that door openings pull in polluted air and cause indoor spikes.
Load-bearing premise
The reductions come from comparing different households (unmodified versus modified gers) rather than measuring the same gers before and after insulation, so any unmeasured difference between households—fuel amount, stove habits, occupancy, door-opening—could produce part or all of the reported drop.
Editorial extensions
If this is right
- Insulation alone appears to cut indoor PM2.5 by about a sixth even when coal remains the heat source, a gain worth having for health even though it leaves residents above safe levels.
- Pairing insulation with electricity for heating and cooking cut indoor PM2.5 about 2.8 times more than insulation alone (48.9% vs 17.5%), making electrification the strongest measured lever.
- Because nighttime outdoor PM2.5 exceeds indoor levels in most gers, opening doors pulls polluted air in; insulation cannot lock out neighborhood pollution.
- Residual pollution in fully electric gers points to infiltration from neighboring coal-burning households, so district-wide fuel switching may be needed to reach health guidelines.
- The monitoring design—inexpensive sensors calibrated once against a reference—can be replicated to evaluate home-energy interventions in other polluted cities.
Reading between the lines
- A fair extension of the single-sensor coal-only result is that the 17.5% estimate is the least secure of the three; a randomized pre/post deployment with fuel diaries would either confirm it or show household differences drove the gap.
- The nighttime indoor–outdoor gradient implies a testable prediction: if neighboring gers stop burning coal, indoor PM2.5 in the electric gers should fall even without further household changes.
- The calibration correction is static; one could extend the method by modeling relative humidity and sensor aging continuously, which would make long-running low-cost sensor networks more trustworthy for policy.
- A cost-effectiveness comparison with mechanical filtration or clean-fuel district heating is a natural next step, since even the best-performing gers remain far above the health guideline.
Editorial analysis
A structured set of objections, weighed in public.
Referee Report
Summary. The paper reports the deployment of custom low-cost PM2.5 sensors in Mongolian gers in Ulaanbaatar over the winter of 2019–2020, including gers that received an NGO insulation retrofit and unmodified control gers. Sensors were calibrated against a TSI optical particle sizer with a diluter. The authors report mean PM2.5 reductions of 17.5% in insulated coal-burning gers, 19.1% in insulated hybrid coal/electric gers, and 48.9% in insulated electric-only gers relative to unmodified gers, while noting that all groups remain far above WHO guidelines. They also analyze daytime/nighttime patterns and conclude that outdoor PM2.5 enters gers when doors are opened. The paper's central claim is that the insulation retrofit reduces indoor PM2.5 concentrations.
Significance. If the causal claim were supported, the results would provide valuable field evidence that low-cost sensor networks can quantify indoor air quality interventions in low-resource settings, and that insulation plus electrification can reduce PM2.5 exposure in Ulaanbaatar gers. The study has concrete strengths: a low-cost sensor network with cellular data transmission, calibration against a reference optical particle sizer using locally relevant coal smoke, and a clearly stated data availability link. However, the headline reduction rests on a very small, non-randomized cross-sectional comparison, and the reported precision is not appropriate for the study design. As an observational pilot with hypothesis-generating conclusions, the manuscript has merit, but the current phrasing overstates causal support.
major comments (4)
- [Section 3.1] The headline claim that insulation reduces PM2.5 by 17.5% is based on a comparison of one modified coal-burning ger against five unmodified gers. There is no pre-insulation baseline in the same gers, no randomization, and no measurement of coal type or quantity, stove model, occupancy, or door-opening frequency. The reported difference of 32.7 µg/m3 therefore cannot be separated from pre-existing household differences. The authors should either reframe this result as an observational, hypothesis-generating finding with explicit caveats, or provide an analysis that accounts for household-level confounding (e.g., mixed-effects models with ger as a random effect and a sensitivity analysis excluding the single modified coal-burning ger).
- [Table 1 and Section 2.4] The standard errors and confidence intervals reported in Section 3.1 (e.g., 154.3 ± 0.5 µg/m3 for the modified coal-burning group) are calculated from hundreds of thousands of minute-level averaged data points. Consecutive 1-minute readings within a ger are strongly autocorrelated, so the effective sample size for between-group comparison is at most the number of gers, which is 1 for the modified coal-burning group and 5 or 6 for the unmodified group. No between-group statistical test is reported. The paper should report between-ger variability, use cluster-robust inference or a mixed-effects model, and avoid presenting minute-level standard errors as evidence of precision for the group comparison.
- [Section 2.5.2 and Table 1] The data processing step described as 'baseline corrected, where necessary' is underspecified and directly affects all reported concentrations and reduction percentages. The authors need to state which sensors were baseline corrected, what the baseline offset was, how 'necessary' was determined, and how the Grubbs' test outlier removal (Section 2.5.2) influenced the dataset. Without this information, the reproducibility of the main numerical results is not established.
- [Section 3.2] The nighttime data contradict the overall favorable conclusion for the modified coal-burning ger: nighttime PM2.5 in the modified coal-burning ger (200.5 ± 0.7 µg/m3) is slightly higher than in the unmodified ger (198.3 ± 1.3 µg/m3). The claimed 17.5% reduction is therefore driven entirely by the daytime window, yet the conclusion 'it does appear to be favorable to insulate the gers' is stated unconditionally. The paper should explicitly condition its recommendation on this daytime/nighttime asymmetry and on the fact that the modified coal-burning comparison is based on a single sensor.
minor comments (5)
- [Section 2.2 and Table 1] The number of unmodified gers is given as 5 in Section 2.2 but as 6 in Table 1, and the number of modified hybrid gers is given as 19 in Section 2.2 but as 20 in Table 1; these counts should be reconciled.
- [Abstract and full text] The spelling of the city name is inconsistent: the abstract uses 'Ulaanbataar' while the main text uses 'Ulaanbaatar'; standardize to the conventional spelling.
- [Section 2.5.2] 'Grubb's Test' should be spelled 'Grubbs' test' for the outlier test.
- [Section 4] The phrase 'third-world countries' is dated and imprecise; consider replacing it with a more specific descriptor such as 'low- and middle-income countries'.
- [Figures 5–7] The figures do not show any measure of between-ger variability or statistical comparison; adding cluster-level error bars or annotation would help readers assess the strength of the group differences.
Circularity Check
No significant circularity: the reported PM2.5 reductions are externally calibrated measurements, not fitted or self-referential outputs.
full rationale
The paper's central comparisons are direct averages of low-cost sensor (LCS) measurements grouped by ger type. The LCS calibration is anchored to an external TSI Optical Particle Sizer reference, and the transfer function is derived from a separate chamber experiment, so the measured PM2.5 values are not fitted outputs of the insulation hypothesis. The 17.5%, 19.1%, and 48.9% reductions are arithmetic differences between group means, not parameters estimated from a model that already assumes insulation works. No step in the derivation chain defines the intervention effect in terms of itself. The unspecified 'baseline corrected, where necessary' step and the aging corrections are data-cleaning procedures; without a specific equation showing that they enforce the reported reduction, they cannot be identified as circular. The cited prior work by the same group supports deployment logistics and LCS methodology, not the insulation conclusion. The single-sensor modified-coal group and the lack of randomization are validity and confounding concerns, but they are not circularity under the stated criteria. Therefore, no significant circularity is present.
Assumptions & free parameters
free parameters (4)
- LCS calibration polynomial coefficients (second-order) =
not specified in paper
- Aging correction polynomial coefficients =
not specified
- Baseline correction offsets =
not specified
- Daytime window (5 am to 8 pm local) =
5 am to 8 pm
assumptions (5)
- domain assumption The single laboratory calibration transfer function, measured in a 55-gallon drum with anthracite smoke, applies to all 28 field sensors over 8 months of outdoor winter conditions.
- domain assumption Unmodified coal-burning gers serve as a valid control group for the modified gers, so differences in PM2.5 are attributable to insulation and fuel type.
- domain assumption A single outdoor PM2.5 record from the U.S. Embassy monitor represents outdoor concentrations at all dispersed ger sites.
- domain assumption A sensor placed on a center support beam of each ger captures occupant-relevant PM2.5 exposure.
- domain assumption The Sensirion SPS30's internal assumption of particle refractive index and density is valid for Mongolian coal smoke.
Cite this review
Pith. "Pith review of Utilizing Low-Cost Sensors to Monitor Indoor Air Quality in Mongolian Gers." pith.science (2026). https://pith.science/paper/TRDQ7RRF
@misc{pith2026241117627,
  author       = {Pith},
  title        = {Pith review of: Utilizing Low-Cost Sensors to Monitor Indoor Air Quality in Mongolian Gers},
  year         = {2026},
  howpublished = {\url{https://pith.science/paper/TRDQ7RRF}},
  note         = {Machine review of arXiv:2411.17627}
}
abstract
Air quality has important climate and health effects. There is a need, therefore, to monitor air quality both indoors and outdoors. Methods of measuring air quality should be cost-effective if they are to be used widely, and one such method is low-cost sensors (LCS). This study reports on the use of LCSs in Ulaanbaatar, Mongolia, to measure $\mathrm{PM_{2.5}}$ concentrations inside yurts or "gers." Some of these gers were part of a non-government agency (NGO) initiative to improve the insulating properties of these housing structures. The goal of the NGO was to decrease particulate emissions inside the gers; a secondary result was to lower the use of coal and other biomass material. LCSs were installed in gers heated primarily by coal, and interior air quality was measured. Gers that were modified by increasing their insulating capacities showed a 17.5% reduction in $\mathrm{PM_{2.5}}$ concentrations, but these concentrations remained higher than levels recommended by health organizations. Gers that were insulated and used a combination of both coal and electricity showed a 19.1% reduction in $\mathrm{PM_{2.5}}$ concentrations. Insulated gers that used electricity for both heating and cooking showed a 48% reduction in $\mathrm{PM_{2.5}}$, though concentrations were still 6.4 times higher than those recommended by the World Health Organization (WHO). Nighttime and daytime trends followed similar patterns in $\mathrm{PM_{2.5}}$ concentrations with slight variations. It was found that, at nighttime, the outside $\mathrm{PM_{2.5}}$ concentrations were generally higher than the inside concentrations of the gers in this study. This suggests that $\mathrm{PM_{2.5}}$ would flow into the gers whenever the doors were opened, causing spikes in $\mathrm{PM_{2.5}}$ concentrations.
Figures


Figures from the paper (4 more)



Reference graph
Works this paper leans on
-
[1]
State of Global Air 2020; Special Report; Health Effects Institute: Boston, MA, USA, 2020
Institute, H.E. State of Global Air 2020; Special Report; Health Effects Institute: Boston, MA, USA, 2020
work page 2020
-
[2]
The Impact of the Environment on Health in Mongolia: A Systematic Review
Jadambaa, A.; Spickett, J.; Badrakh, B.; Norman, R.E. The Impact of the Environment on Health in Mongolia: A Systematic Review. Asia-Pac. J. Public Health 2015, 27, 45–75. [CrossRef]
work page 2015
-
[3]
The Index-Pm Project: Health Risks from Exposure to Indoor Particulate Matter
Arvanitis, A.; Kotzias, D.; Kephalopoulos, S.; Carrer, P .; Cavallo, D.; Cesaroni, G.; De Brouwere, K.; de Oliveira-Fernandes, E.; Forastiere, F.; Fossati, S.; et al. The Index-Pm Project: Health Risks from Exposure to Indoor Particulate Matter. Fresenius Environ. Bull. 2010, 19, 2458–2471
work page 2010
-
[4]
Hill, L.D.; Edwards, R.; Turner, J.R.; Argo, Y.D.; Olkhanud, P .B.; Odsuren, M.; Guttikunda, S.; Ochir, C.; Smith, K.R. Health assessment of future PM2.5 exposures from indoor, outdoor, and secondhand tobacco smoke concentrations under alternative policy pathways in Ulaanbaatar, Mongolia. PLoS ONE 2017, 12, e0186834. [CrossRef] [PubMed]
work page 2017
-
[5]
World Bank. Mongolia—Energy Efficient and Cleaner Heating in Poor, Peri-Urban Areas of Ilaanbaatar: Summary Report on Activies ; World Bank: Washington, DC, USA, 2008
work page 2008
-
[6]
Guttikunda, S. Urban Air Pollution Analysis for Ulaanbaatar; Ministry of the Environment and Green Development: Ulaanbaatar, Mongolia, 2007
work page 2007
-
[7]
Davy, P .K.; Gunchin, G.; Markwitz, A.; Trompetter, W.J.; Barry, B.J.; Shagjjamba, D.; Lodoysamba, S. Air particulate matter pollution in Ulaanbaatar, Mongolia: Determination of composition, source contributions and source locations. Atmos. Pollut. Res. 2011, 2, 126–137. [CrossRef] Sensors 2023, 23, 7721 10 of 10
work page 2011
-
[8]
Nakao, M.; Yamauchi, K.; Ishihara, Y.; Omori, H.; Ichinnorov, D.; Solongo, B. Effects of air pollution and seasons on health-related quality of life of Mongolian adults living in Ulaanbaatar: Cross-sectional studies. BMC Public Health 2017, 17, 594. [CrossRef] [PubMed]
work page 2017
Show all 29 references
-
[9]
Air Pollution in Ulaanbaatar: Initial Assessment of Current Situation and Effects of Aabatement Measures; World Bank: Washington, DC, USA, 2009
World Bank. Air Pollution in Ulaanbaatar: Initial Assessment of Current Situation and Effects of Aabatement Measures; World Bank: Washington, DC, USA, 2009
2009
-
[10]
Mitigation of Ulaanbaatar city’s air pollution—From source apportionment to ultra-low emission lignite burning stoves
Lodoyasamba, S.; Pemberton-Pigott, C. Mitigation of Ulaanbaatar city’s air pollution—From source apportionment to ultra-low emission lignite burning stoves. New Dawn Eng. 2011
2011
-
[11]
Impact Evaluation Results of the MCA Mongolia Energy and Environment Project Energy-Efficient Stove Subsidy Program; Milleniumn Challenge Corporation: Washington, DC, USA, 2014
Greene, L.; Turner, J.; Edwards, R.; Cutler, N.; Duthie, M.; Rostapshova, O. Impact Evaluation Results of the MCA Mongolia Energy and Environment Project Energy-Efficient Stove Subsidy Program; Milleniumn Challenge Corporation: Washington, DC, USA, 2014
2014
-
[12]
Impact of Improved Stoves on Indoor Air Quality in Ulaanbaatart, Mongolia; World Bank: Washington, DC, USA, 2005
Cowlin, S.; Kaufmann, R.B.; Edwards, R.; Smith, K.R. Impact of Improved Stoves on Indoor Air Quality in Ulaanbaatart, Mongolia; World Bank: Washington, DC, USA, 2005
2005
-
[13]
Characteristics of Indoor PM2.5 Concentration in Gers Using Coal Stoves in Ulaanbaatar, Mongolia
Lim, M.; Myagmarchuluun, S.; Ban, H.; Hwang, Y.; Ochir, C.; Lodoisamba, D.; Lee, K. Characteristics of Indoor PM2.5 Concentration in Gers Using Coal Stoves in Ulaanbaatar, Mongolia. Int. J. Environ. Res. Public Health 2018, 15, 2524. [CrossRef] [PubMed]
2018
-
[14]
The health impacts of exposure to indoor air pollution from solid fuels in developing countries: Knowledge, gaps, and data needs
Ezzati, M.; Kammen, D.M. The health impacts of exposure to indoor air pollution from solid fuels in developing countries: Knowledge, gaps, and data needs. Environ. Health Perspect. 2002, 110, 1057–1068. [CrossRef] [PubMed]
2002
-
[15]
Urban Air Quality Studies in Mongolia: Pollution Characteristics and Future Research Needs
Soyol-Erdene, T.O.; Ganbat, G.; Baldorj, B. Urban Air Quality Studies in Mongolia: Pollution Characteristics and Future Research Needs. Aerosol Air Qual. Res. 2021, 21, 210163. [CrossRef]
2021
-
[16]
Meteorological Factors Affecting Winter Particulate Air Pollution in Ulaanbaatar from 2008 to 2016
Wang, M.R.; Kai, K.; Sugimoto, N.; Enkhmaa, S. Meteorological Factors Affecting Winter Particulate Air Pollution in Ulaanbaatar from 2008 to 2016. Asian J. Atmos. Environ. 2018, 12, 244–254. [CrossRef]
2008
-
[17]
Ulaanbaatar—Historical Data
US Embassy Ulaanbaatar Mongolia. Ulaanbaatar—Historical Data. 2023. Available online: https://stateair.mn/history.php (accessed on 6 July 2023)
2023
-
[18]
A Network of Field-Calibrated Low-Cost Sensor Measurements of PM2.5 in Lomé, Togo, Over One to Two Years
Raheja, G.; Sabi, K.; Sonla, H.; Gbedjangni, E.K.; McFarlane, C.M.; Hodoli, C.G.; Westervelt, D.M. A Network of Field-Calibrated Low-Cost Sensor Measurements of PM2.5 in Lomé, Togo, Over One to Two Years. ACS Earth Space Chem. 2022, 6, 1011–1021. [CrossRef] [PubMed]
2022
-
[19]
Indoor Household Particulate Matter Measurements Using a Network of Low-cost Sensors
Hegde, S.; Min, K.T.; Moore, J.; Lundrigan, P .; Patwari, N.; Collingwood, S.; Balch, A.; Kelly, K.E. Indoor Household Particulate Matter Measurements Using a Network of Low-cost Sensors. Aerosol Air Qual. Res. 2020, 20, 381–394. [CrossRef]
2020
-
[20]
IASA—Indoor air quality sensing and automation: Demo abstract
Min, K.T.; Lundrigan, P .; Patwari, N. IASA—Indoor air quality sensing and automation: Demo abstract. In Proceedings of the 16th ACM/IEEE International Conference on Information Processing in Sensor Networks, Pittsburgh, PA, USA, 18–21 April 2017; Association for Computing Mac...
2017
-
[21]
Managing In-home Environments through Sensing, Annotating, and Visualizing Air Quality Data
Moore, J.; Goffin, P .; Meyer, M.; Lundrigan, P .; Patwari, N.; Sward, K.; Wiese, J. Managing In-home Environments through Sensing, Annotating, and Visualizing Air Quality Data. Proc. ACM Interact. Mob. Wearable Ubiquitous Technol. 2018, 2, 128. [CrossRef]
2018
-
[22]
PurpleAir: Real-Time Air Quality Monitoring
PurpleAir. PurpleAir: Real-Time Air Quality Monitoring. 2022. Available online: https://www2.purpleair.com/ (accessed on 6 July 2023)
2022
-
[23]
AirU at the University of Utah
AirU. AirU at the University of Utah. 2017. Available online: https://airu.coe.utah.edu/about/ (accessed on 6 July 2023)
2017
-
[24]
The Hitchhiker’s Guide to Successful Remote Sensing Deployments in Mongolia
Alcantara, L.; Miera, J.; Ariun-Erdene, B.; Teng, C.C.; Lundrigan, P . The Hitchhiker’s Guide to Successful Remote Sensing Deployments in Mongolia. In Proceedings of the 2020 Intermountain Engineering, Technology and Computing (IETC), Orem, UT, USA, 2–3 October 2020; pp. 1–6
2020
-
[25]
A Low-Cost Calibration Method for Temperature, Relative Humidity, and Carbon Dioxide Sensors Used in Air Quality Monitoring Systems
RoRivero, A.G.; Rivero, R.A.G.; Schalm, O.; Rodr íguez, E.H.; Rodr íguez, E.H.; P érez, M.C.M.; Caraballo, V .N.; Jacobs, W.; Laguardia, A.M. A Low-Cost Calibration Method for Temperature, Relative Humidity, and Carbon Dioxide Sensors Used in Air Quality Monitoring Systems. At...
2023
-
[26]
New Calibration System for Low-Cost Suspended Particulate Matter Sensors with Controlled Air Speed, Temperature and Humidity.Sensors 2021, 21, 5845
Nieckarz, Z.; Zoladz, J.A. New Calibration System for Low-Cost Suspended Particulate Matter Sensors with Controlled Air Speed, Temperature and Humidity.Sensors 2021, 21, 5845. [CrossRef] [PubMed]
2021
-
[27]
Long-Term Evaluation and Calibration of Low-Cost Particulate Matter (PM) Sensor
Lee, H.; Kang, J.; Kim, S.; Im, Y.; Yoo, S.; Lee, D. Long-Term Evaluation and Calibration of Low-Cost Particulate Matter (PM) Sensor. Sensors 2020, 20, 3617. [CrossRef]
2020
-
[28]
Effects of aerosol type and simulated aging on performance of low-cost PM sensors
Tryner, J.; Mehaffy, J.; Miller-Lionberg, D.; Volckens, J. Effects of aerosol type and simulated aging on performance of low-cost PM sensors. J. Aerosol Sci. 2020, 150, 105654. [CrossRef]
2020
-
[29]
What Are the WHO Air Quality Guidelines? 2021
WHO. What Are the WHO Air Quality Guidelines? 2021. Available online: https://www.who.int/news-room/feature-stories/ detail/what-are-the-who-air-quality-guidelines (accessed on 6 April 2023). Disclaimer/Publisher’s Note: The statements, opinions and data contained in all publi...
2021
Reviewed August 12, 2026 · model on record in the stance chip above.
Discussion (0). Continue with ORCID to comment.