REVIEW 1 major objections 6 minor 33 references
The VELOCE modulation zoo II. Humps and splitting patterns in spectral lines of classical Cepheids
T0 review · 1 major / 6 minor · reviewed 2026-08-12 · deepseek-v4-flash
Pith's one-line read In two classical Cepheids, X Sgr and BG Cru, spectral line splitting recurs on periods of 12.317 d and 3.008 d—not their pulsation periods—ruling out pulsation-induced shocks and pointing to non-radial modes.
desk verdict A solid, honest VELOCE study of Cepheid line splitting whose central shock-ruling-out claim leans on an unresolved frequency identification for X Sgr, but whose cycle-to-cycle phase comparison stands on its own. read the letter →
The pith
A machine-rendered reading of the paper's core claim, the machinery that carries it, and where it could break.
The reading
What carries the argument
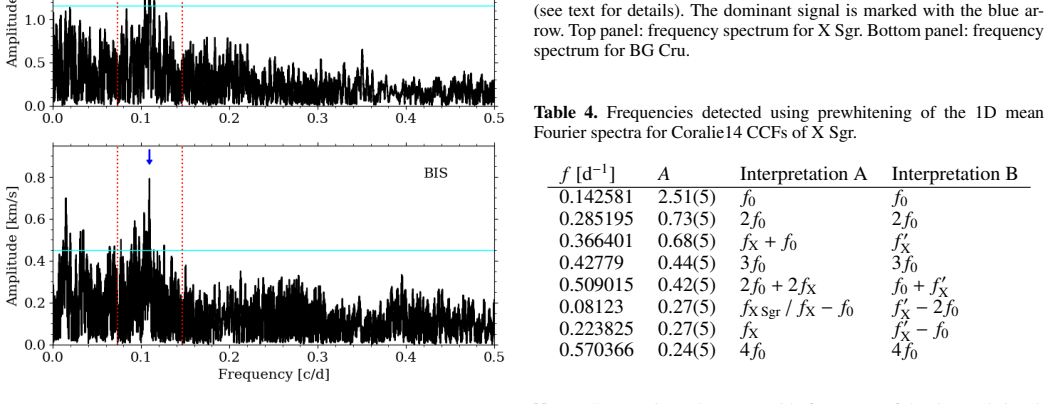
The central object is the cross-correlation function (CCF) hump and the time series built from it. Each CCF is fitted with a single Gaussian to define the star's radial velocity, and the hump created by line splitting is located as the maximum of the residuals; the hump's velocity relative to the Gaussian center is then analyzed with standard Fourier techniques, converting a qualitative profile distortion into a measurable periodic signal. For X Sgr that signal is $0.08190\,\mathrm{d}^{-1}$ and for BG Cru $0.33243\,\mathrm{d}^{-1}$. Supporting machinery includes a triple-Gaussian decomposition of the split profile into blue, middle, and red components (following Mathias et al. 2006) and two-dimensional FAMIAS Fourier spectra, which confirm the same frequency in the hump position, in CCF shape indicators (FWHM, BIS, contrast, EW), and in the depths and centroids of the fitted components.
What would settle it
A dense, alias-free spectroscopic campaign on X Sgr tracking the hump position over several seasons could settle whether the $0.08190\,\mathrm{d}^{-1}$ signal is an independent frequency or a combination of the 7.0-day pulsation with another frequency; if the signal dissolves into combination frequencies, the independent-periodicity premise fails and the shock-ruling-out conclusion weakens, whereas a stable, independent peak would support the non-radial mode interpretation.
Extended reading notes
Core claim
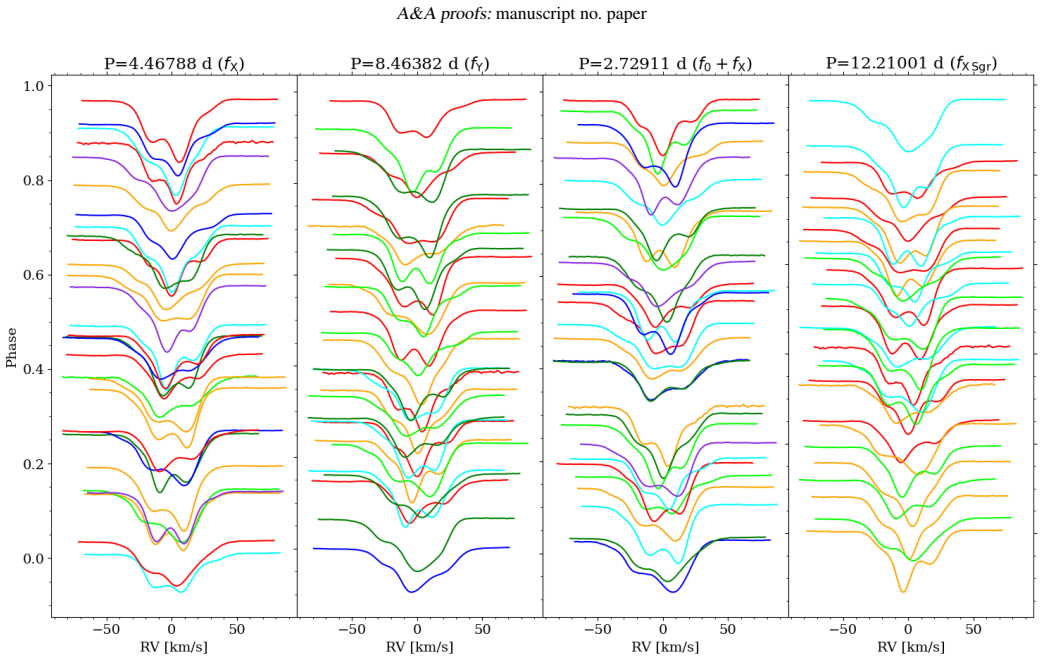
The central discovery is that the recurring line-splitting hump in X Sgr and BG Cru is tied to periods that differ significantly from the stars' dominant pulsation periods: in X Sgr the hump repeats with $P = 12.317(4)$ d (frequency $0.08190\,\mathrm{d}^{-1}$) against a 7.01 d pulsation, and in BG Cru with $P = 3.00813(9)$ d against a first-overtone period near 3.34 d. Because pulsation-induced shocks would lock splitting to specific pulsation phases and repeat every cycle, the observed cycle-to-cycle differences at the same pulsation phase (shown for X Sgr in Fig. 3) rule out the shock interpretation. The paper concludes that non-radial modes are the most likely origin, notes that the periods are too short for rotation, and, by visually inspecting all 258 VELOCE Cepheids, finds humps in six further stars (LR TrA, V0411 Lac, V1334 Cyg, SZ Cas, V1019 Cas, ASAS J174603-3528.1), giving an incidence of about 3%. The hump stars tend to have broader CCFs, lower radial-velocity amplitudes, and lower CCF contrast than typical Cepheids.
Load-bearing premise
The argument rests on the claim that the 12.317-day hump periodicity in X Sgr is an independent physical periodicity rather than a combination or beat with the 7.0-day pulsation frequency; the paper itself flags this ambiguity in its Section 3.5, so if the 12.317-day signal turned out to be a combination, the conclusion that the splitting period differs from the pulsation period would be weakened.
Editorial extensions
If this is right
- The shock-wave interpretation for line splitting in X Sgr and BG Cru is ruled out; the splitting recurs on periods that are not the pulsation period and CCFs at the same pulsation phase differ between cycles.
- The splitting hump in each of the two stars carries a measurable periodicity that also appears in CCF shape indicators, meaning the phenomenon is detectable in standard radial-velocity and profile-shape diagnostics.
- Among 258 VELOCE Cepheids, 8 show line splitting or humps (about 3%), and these stars preferentially have high average FWHM, low radial-velocity amplitude, and low CCF contrast.
- The splitting is much more visible in weak metallic lines than in strong lines and is absent from Balmer lines, indicating that the phenomenon is confined to a narrow range of atmospheric depths.
- For X Sgr, the 4.47-day signal seen in shape indicators is close to the combination of the pulsation frequency with the 12.317-day hump period, suggesting that the two periodicities trace the same underlying feature through different diagnostics.
Reading between the lines
- A testable extension of the non-radial mode interpretation: mapping the hump's phase and amplitude across lines formed at different atmospheric depths would constrain the horizontal and vertical structure of the suspected mode, since the paper finds the splitting strongest in weak metallic lines and absent in Balmer lines.
- The paper's 3% incidence rests on visual classification; an automated screen using FWHM, BIS, and contrast outliers across a larger Cepheid sample would turn this into a statistical measurement and test whether the association with broad CCFs is a detection bias or a physical correlation.
- If the 12.317-day signal in X Sgr were shown to be a combination frequency rather than an independent periodicity, the shock-ruling-out argument would lose its main pillar for that star; the cycle-to-cycle CCF differences shown in Fig. 3 would remain as secondary evidence against phase-locked shocks.
- If the 3.008-day signal in BG Cru is indeed a non-radial mode, then BG Cru hosts at least two independent additional modes beyond its radial first overtone, making it a promising testbed for mode-interaction and mode-identification studies that go beyond the present paper.
Editorial analysis
A structured set of objections, weighed in public.
Referee Report
Summary. The paper uses high-resolution CCF time series from the VELOCE project to study line splitting in the classical Cepheids X Sgr and BG Cru. It develops three approaches: tracing the position of the hump in the CCF residual after a single-Gaussian fit, fitting triple-Gaussian components, and computing 2D/1D Fourier spectra with FAMIAS. The authors report a 12.317 d periodicity for the X Sgr hump and a 3.008 d periodicity for the BG Cru hump, both differing from the respective pulsation periods. They conclude that pulsation-induced shocks are ruled out and that non-radial modes are the most likely explanation, also reporting unresolved splitting humps in six additional Cepheids for an incidence rate of about 3% in the VELOCE sample.
Significance. If the conclusions hold, this work is significant for the interpretation of line-profile variability in classical Cepheids: it challenges the common assumption that line splitting in these stars is caused by pulsation-driven shocks and provides new evidence for additional low-amplitude phenomena, likely non-radial modes. The analysis benefits from high signal-to-noise CCFs, a long (multi-year) baseline, and a large sample of 258 Cepheids. A notable strength is the internal cross-checking of periodicities across different diagnostics (RV, FWHM, BIS, contrast, EW, hump tracing, triple-Gaussian fits, and FAMIAS), and for BG Cru the hump periodicity matches an independently detected signal fZ in multiple indicators. The identification of seven additional Cepheids with hump-like CCF distortions is a useful observational resource. However, the X Sgr frequency identification has an unresolved ambiguity that needs to be addressed before the specific 12.317 d periodicity can be quoted as the physical periodicity of the line splitting.
major comments (1)
- [Sec. 3.5 and Table 4] The claim that X Sgr's line-splitting hump has a distinct 12.317 d periodicity is not yet secure because the manuscript explicitly states it is unclear which signal is the independent periodicity. Table 4 shows that the 0.081 d^-1 signal detected in the FAMIAS 1D mean spectra is consistent with the combination frequency fX - f0 = 0.08122 d^-1, and the hump-tracing value 0.08190(3) d^-1 differs from this by about 2-3 frequency-resolution elements over the ~10-year baseline. Since the abstract and Sec. 4.3 use this periodicity to argue against pulsation-induced shocks and against rotation, the authors should perform an explicit combination-frequency test: fit a model containing f0 and its harmonics together with fX, fX-f0, and fX+f0 to the hump time series and to the RV residuals, then examine the residual periodogram at 0.0819 d^-1 and quantify the significance of any remaining signal. Until this test is done, the conclusions should be phrased with the ambiguity stated in Sec. 3.5 rather than asserting the 12.317 d period as the independent line-splitting periodicity.
minor comments (6)
- [Sec. 3.1 and Sec. 4.2] The sample size is inconsistently reported as 258 in Sec. 3.1 and the abstract but as 285 in Sec. 4.2. The incidence rate of 3% should be computed with the correct denominator.
- [Sec. 4.3] The rotational velocity estimates contain numerical errors. For X Sgr with R=53 R_sun, a rotation period of 4.47 d gives v_eq ≈ 600 km/s (not 96 km/s), and the hump period of 12.317 d gives ≈ 218 km/s (not 35.8 km/s); for BG Cru with R=41 R_sun and P=3.008 d, v_eq ≈ 690 km/s (not 110 km/s). These corrections strengthen the argument against rotation, but the quoted values and the undefined symbol f1 should be corrected.
- [Fig. 10 caption] The caption "Frequency spectra for the time-series of RV of the hump in LPV" appears to contain a typo; LPV should likely read CCF or hump.
- [Sec. 3.4] The additional signals found from the triple-Gaussian component time series are all below the 5σ detection level. The text should clearly state that these results are tentative and only corroborate the other methods, which it does in part, but the phrasing "revealed" is too strong for 3σ detections.
- [Sec. 2.3] The visual classification of humps in six additional stars is subjective; a quantitative criterion (e.g., a threshold on the residual amplitude after Gaussian subtraction) would improve reproducibility.
- [Sec. 4.2] There is a typo: "unkown" should be "unknown".
Circularity Check
No circular derivation: the splitting periodicities are measured directly from CCF time series, and the paper explicitly flags the X Sgr combination-frequency ambiguity.
full rationale
The central claim that the line-splitting periodicity differs from the pulsation period rests on measured frequencies, not on a model parameter fitted to the conclusion. For X Sgr, the hump-tracing time series yields f_X,Sgr = 0.08190(3) d^-1 (Sec. 3.3), and for BG Cru the hump periodicity matches the independently reported f_Z signal. The paper explicitly flags the alternative that the 0.081 d^-1 signal could be f_X - f_0: "Unfortunately, it is not clear which scenario is correct and which signal is the independent periodicity" (Sec. 3.5), and Table 4 lists both interpretations. That is an acknowledged physical ambiguity, not a derivation that assumes its own conclusion. The direct cycle-to-cycle CCF comparison in Fig. 3 provides independent evidence against phase-locked shock features. The self-citations to VELOCE data (Anderson et al. 2024) and to Netzel et al. (2024) for BG Cru's f_Z supply context and cross-checks but are not used as a uniqueness argument or as a substitute for the present measurements. No fitted parameter is relabeled as a prediction, and no ansatz is imported via citation. The paper therefore shows no significant circularity; the noted ambiguity is a correctness and interpretation risk rather than a circular step.
Assumptions & free parameters
free parameters (1)
- Fourier series coefficients of the pulsation signal removed in prewhitening =
varies per star (see Tables 3-5)
assumptions (5)
- domain assumption The CCF is a faithful weighted average of the metallic line profiles; line splitting visible in the CCF reflects splitting in individual lines.
- standard math The pulsation signal can be removed by a Fourier series (Eq. 1) with the dominant frequency and its harmonics.
- domain assumption Frequencies detected after prewhitening above the 3-sigma noise level are real stellar signals rather than aliases (daily/yearly) or artifacts of irregular sampling.
- ad hoc to paper The hump can be traced as the maximum of residuals after a single-Gaussian fit to the CCF.
- domain assumption The literature radii and v sin i values used for rotation estimates are correct.
Cite this review
Pith. "Pith review of The VELOCE modulation zoo II. Humps and splitting patterns in spectral lines of classical Cepheids." pith.science (2026). https://pith.science/paper/2XRGPKMD
@misc{pith2026241117851,
  author       = {Pith},
  title        = {Pith review of: The VELOCE modulation zoo II. Humps and splitting patterns in spectral lines of classical Cepheids},
  year         = {2026},
  howpublished = {\url{https://pith.science/paper/2XRGPKMD}},
  note         = {Machine review of arXiv:2411.17851}
}
read the original abstract
Line splitting in spectral lines is observed in various types of stars due to phenomena such as shocks, spectroscopic binaries, magnetic fields, spots, and non-radial modes. In pulsating stars, line splitting is often attributed to pulsation-induced shocks. However, this is rarely observed in classical Cepheids, with only a few reports, including X Sagittarii and BG Crucis, where it has been linked to atmospheric shocks. We investigate line splitting in X Sgr and BG Cru using spectroscopic time series, and search for similar phenomena in other classical Cepheids. High signal-to-noise cross-correlation function (CCF) time series from the VELOcities of CEpheids (VELOCE) project are analyzed. This dataset spans several years, allowing us to study the periodicities and evolution of CCF features. For X Sgr and BG Cru, we perform a detailed analysis of the individual components of the split CCFs. Additionally, we search for periodicities in CCF variations and examine other classical Cepheids for distortions resembling unresolved line splitting. We confirm line splitting in X Sgr and BG Cru, trace the features over time, and uncover the periodicity behind them. Several other Cepheids also exhibit CCF humps, suggesting unresolved or marginally resolved line splitting. We discuss the incidence and characteristics of these stars. The periodicity of line splitting in X Sgr and BG Cru differs significantly from the dominant pulsation period, ruling out pulsation-induced shocks. The periodicities are too short for rotation-related phenomena, suggesting non-radial modes as the most likely explanation, though their exact nature remains unknown. We also identify humps in six additional stars, indicating an incidence rate of 3% in the VELOCE sample.
Figures


Figures from the paper (15 more)





Reference graph
Works this paper leans on
-
[1]
2001, A&A, 379, 305 Ammler-von Eiff, M
Alvarez, R., Jorissen, A., Plez, B., et al. 2001, A&A, 379, 305 Ammler-von Eiff, M. & Reiners, A. 2012, A&A, 542, A116
work page 2001
-
[2]
Anderson, R. I. 2013, PhD thesis, University of Geneva, Astronomical Observa- tory
work page 2013
-
[3]
Anderson, R. I. 2016, MNRAS, 463, 1707
work page 2016
-
[4]
Anderson, R. I. 2019, A&A, 623, A146
work page 2019
-
[5]
I., Ekström, S., Georgy, C., et al
Anderson, R. I., Ekström, S., Georgy, C., et al. 2014, A&A, 564, A100
work page 2014
-
[6]
VELOcities of CEpheids (VELOCE) I. High-precision radial velocities of Cepheids
Anderson, R. I., Viviani, G., Shetye, S. S., et al. 2024, arXiv e-prints, arXiv:2404.12280
work page Pith review arXiv 2024
-
[7]
A., Catanzaro, G., Crause, L., et al
Balona, L. A., Catanzaro, G., Crause, L., et al. 2013, MNRAS, 432, 2808
work page 2013
-
[8]
1996, A&AS, 119, 373 Benk˝o, J
Baranne, A., Queloz, D., Mayor, M., et al. 1996, A&AS, 119, 373 Benk˝o, J. M. & Kovács, G. B. 2023, A&A, 680, L6
work page 1996
Show all 33 references
-
[9]
2000, ApJ, 529, 293
Bono, G., Castellani, V ., & Marconi, M. 2000, ApJ, 529, 293
2000
-
[10]
Dziembowski, W. A. 2016, Commmunications of the Konkoly Observatory Hun- gary, 105, 23
2016
-
[11]
Fokin, A. B. & Gillet, D. 1994, A&A, 290, 875
1994
-
[12]
Fokin, A. B. & Gillet, D. 1997, A&A, 325, 1013 Gaia Collaboration, Vallenari, A., Brown, A. G. A., et al. 2023, A&A, 674, A1 Hocdé, V ., Moskalik, P., Gorynya, N. A., et al. 2023, arXiv e-prints, arXiv:2312.11407
1997 arXiv
-
[13]
V ., Andrievsky, S
Kovtyukh, V . V ., Andrievsky, S. M., Luck, R. E., & Gorlova, N. I. 2003, A&A, 401, 661
2003
-
[14]
Kraft, R. P. 1956, PASP, 68, 137
1956
-
[15]
W., Shibahashi, H., Murphy, S
Kurtz, D. W., Shibahashi, H., Murphy, S. J., Bedding, T. R., & Bowman, D. M. 2015, MNRAS, 450, 3015
2015
-
[16]
Leavitt, H. S. 1908, Annals of Harvard College Observatory, 60, 87
1908
-
[17]
Leavitt, H. S. & Pickering, E. C. 1912, Harvard College Observatory Circular, 173, 1 Li Causi, G., Antoniucci, S., Bono, G., et al. 2013, A&A, 549, A64
1912
-
[18]
2005, ApJ, 632, 590
Marconi, M., Musella, I., & Fiorentino, G. 2005, ApJ, 632, 590
2005
-
[19]
B., et al
Mathias, P., Gillet, D., Fokin, A. B., et al. 2006, A&A, 457, 575
2006
-
[20]
R., & Marom, A
Moskalik, P., Buchler, J. R., & Marom, A. 1992, ApJ, 385, 685
1992
-
[21]
Neilson, H. R. & Lester, J. B. 2008, ApJ, 684, 569
2008
- [22]
-
[23]
I., & Viviani, G
Netzel, H., Anderson, R. I., & Viviani, G. 2024, arXiv e-prints, arXiv:2403.13796
2024 arXiv
-
[24]
2002, A&A, 388, 632
Pepe, F., Mayor, M., Galland, F., et al. 2002, A&A, 388, 632
2002
-
[25]
2001, The Messenger, 105, 1
Queloz, D., Mayor, M., Udry, S., et al. 2001, The Messenger, 105, 1
2001
-
[26]
2011, A&A, 526, A69
Raskin, G., van Winckel, H., Hensberge, H., et al. 2011, A&A, 526, A69
2011
-
[27]
G., Casertano, S., Yuan, W., et al
Riess, A. G., Casertano, S., Yuan, W., et al. 2021, ApJ, 908, L6
2021
-
[28]
Sasselov, D. D. & Lester, J. B. 1990, ApJ, 362, 333
1990
-
[29]
1952, in Transactions of the IAU, ed
Schwarzschild, M. 1952, in Transactions of the IAU, ed. P. T. Oosterho ff, V ol. VIII (Cambridge University Press), 811
1952
-
[30]
2006, PhD thesis, -
Semenova, A. 2006, PhD thesis, -
2006
-
[31]
2017, MNRAS, 468, 4299
Smolec, R. 2017, MNRAS, 468, 4299
2017
-
[32]
R., Moffat, A
Smolec, R., Moskalik, P., Evans, N. R., Moffat, A. F. J., & Wade, G. A. 2018, in 3rd BRITE Science Conference, ed. G. A. Wade, D. Baade, J. A. Guzik, & R. Smolec, V ol. 8, 88–93 Soszy´nski, I., Udalski, A., Szyma´nski, M. K., et al. 2015, Acta Astron., 65, 297 Süveges, M. & An...
2018
-
[33]
2008, Communications in Asteroseismology, 157, 387 Article number, page 15 of 15
Zima, W. 2008, Communications in Asteroseismology, 157, 387 Article number, page 15 of 15
2008
Reviewed August 12, 2026 · model on record in the stance chip above.
Discussion (0). Continue with ORCID to comment.