REVIEW 4 major objections 5 minor 9 references
Calibrating DRAMPower Model for HPC: A Runtime Perspective from Real-Time Measurements
T0 review · 4 major / 5 minor · reviewed 2026-08-12 · deepseek-v4-flash
Pith's one-line read Calibrating DRAMPower's five supply currents against real HPC power measurements brings average memory-energy estimation error below 5%.
desk verdict A practical DRAM power calibration on a real HPC server, but the headline 5% error is a training residual and the external validation is unquantified. read the letter →
The pith
A machine-rendered reading of the paper's core claim, the machinery that carries it, and where it could break.
The reading
What carries the argument
The load-bearing machinery is the reformulation of DRAMPower's energy accounting as a linear model in the unknown supply currents, $$E_{\mathrm{total}}^{(k)} = \sum_i \mathrm{Coeff}$_i^{{(k)}}$ \cdot \mathrm{IDD}_i + b,$$ where $\mathrm{Coeff}_i^{(k)}$ aggregates timing specifications, rank/bank counts, and command statistics from the Ramulator-generated trace, and $b$ absorbs non-IDD baseline bias such as I/O energy. Measured energy under 24-thread parallel execution becomes the ground-truth vector, and the currents are recovered by bounded least squares ($\ell \le \mathrm{IDD} \le u$, with datasheet bounds) using a trust-region reflective solver, which keeps weakly observable currents near their datasheet values while correcting the strongly excited ones. Supporting this are the 64-byte-strided STREAM-like benchmarks, Pin-generated CPU traces, Ramulator's command translation, the reverse-engineered channel/rank/bank/row/column mapping, and HDEEM's per-DIMM-pair power sensors.
What would settle it
Re-run the identical calibration on a second Haswell compute node with the same DIMM part number and compare the fitted IDD values plus the error on a held-out benchmark; if the error rises above 5% or the currents shift beyond measurement noise, the regression captured trace- or node-specific artifacts rather than the DRAM's electrical behavior.
Extended reading notes
Core claim
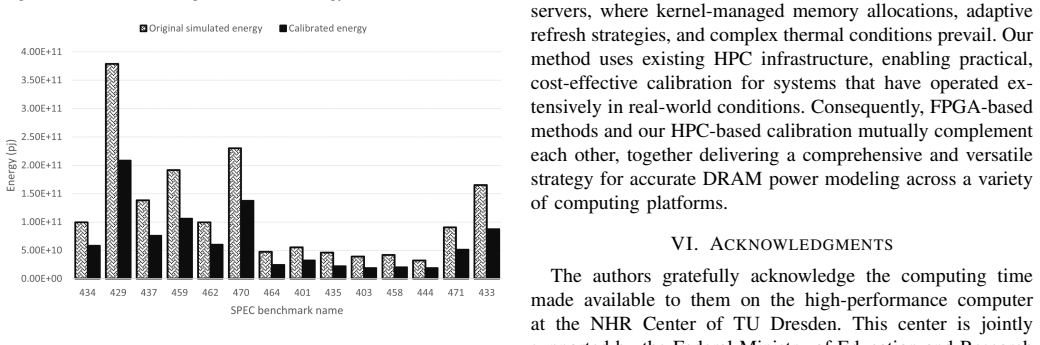
The paper's central claim is that the gap between DRAMPower's predicted DRAM energy and real server measurements is not a structural flaw in the model but a parameter problem: the IDD currents from the datasheet are too pessimistic for a deployed HPC system. Using measured energy as ground truth and expressing total benchmark energy as a linear combination of the unknown currents, a bounded least-squares fit over five strongly excited currents (activation, pre-charge, active-standby, read, write) yields calibrated values that reduce average estimation error to under 5%. The paper further claims these fitted currents generalize: applied to SPEC2006 workloads, they move simulated energy onto the measured scale, typically cutting the pre-calibration estimate by about half. The authors position this as complementary to FPGA-based calibration such as Vampire, which offers fine control but not the real-world thermal, aging, and kernel-management conditions of an HPC cluster.
Load-bearing premise
The calibration treats the simulated memory command stream, built from instrumented traces and a reverse-engineered address mapping, as a faithful stand-in for the real memory controller's behavior; if that stream is inaccurate, the fitted current values absorb the mismatch as if it were DRAM physics.
Editorial extensions
If this is right
- On the target Haswell server, DRAMPower with the fitted currents matches HDEEM measurements within 5% average error across the calibration benchmarks.
- On SPEC2006 workloads, the calibrated model cuts the previous estimate roughly in half, moving simulated energy onto the measured scale without changing the model structure.
- The calibration can be repeated on other HPC clusters using their existing power-monitoring infrastructure, with no extra FPGA or bench hardware required.
- The five calibrated currents absorb most of the datasheet gap, while weakly excited currents such as refresh remain at datasheet values because they are poorly observable under full-load streaming.
- Datasheet-driven estimates, from uncalibrated DRAMPower or the vendor calculator, systematically overestimate real memory energy, so calibration closes a modeling gap caused by worst-case and idealized vendor conditions.
Reading between the lines
- Because the procedure needs only an existing power monitor and a simulator trace, it could be re-run on a schedule to track how DRAM aging and temperature drift change the fitted currents over the lifetime of a cluster.
- The reverse-engineered address mapping is the least portable component; on systems with documented memory-controller interleaving, the same bounded least-squares recipe could be applied with less uncertainty and could even separate trace fidelity from true current values.
- A natural extension is to add a temperature or refresh-rate sweep to the benchmark set, which would test whether refresh and I/O currents can be identified or whether the active-standby current is silently absorbing thermal drift.
Editorial analysis
A structured set of objections, weighed in public.
Referee Report
Summary. The paper proposes a runtime calibration methodology for the DRAMPower model, using energy measurements from the HDEEM instrumentation on the Taurus HPC cluster. The authors run custom STREAM-based memory benchmarks, generate memory command traces with Pin and Ramulator, reverse-engineer the address mapping, and solve a bounded least-squares problem in Eq. (4) to fit five IDD current parameters. They report that calibration reduces the average energy estimation error to less than 5% compared with HDEEM measurements, and they discuss generalization using a qualitative SPEC2006 comparison. The paper also documents limitations: only five currents are calibrated, measurement noise remains, and the simulators use simplified representations of system-level behavior.
Significance. If the claimed accuracy held out-of-sample, this would be a useful engineering contribution: it offers a low-cost, infrastructure-based alternative to FPGA-style DRAM current calibration that can be applied directly to production HPC nodes, and it explicitly targets the gap between datasheet-based modeling and real-system measurements. The paper's strengths include the use of real HDEEM measurements, a bounded and physically constrained regression formulation, and a candid discussion of observability and collinearity limitations in Section IV and Section V. However, the central quantitative claim currently rests on in-sample fitting error, and the only external evidence is qualitative, so the significance of the result as a predictive calibration method is not yet established.
major comments (4)
- [Section IV, Eq. (4) and Fig. 4(a)] The headline claim that calibration 'reduces the average energy estimation error to less than 5%' is computed on the same custom benchmarks that were used to fit the five IDD currents in Eq. (4). Because the regression has five free parameters, a low residual on the fitting data is expected and does not demonstrate predictive accuracy. The paper should report the number of calibration benchmarks K, the per-benchmark training residuals, and, crucially, a held-out evaluation such as leave-one-benchmark-out cross-validation with mean, median, and maximum absolute error. Without this, the abstract's '<5%' figure is an in-sample training residual rather than evidence of model accuracy.
- [Section IV, Fig. 6] The SPEC2006 generalization check is described only qualitatively: 'typically reducing pre-calibration estimates by roughly half' and 'stable accuracy gains across diverse workloads.' No per-benchmark measured and simulated energy values, no aggregate error metrics, and no confidence intervals are provided. Since this is the only out-of-sample evidence in the paper, the authors should add a table or figure with per-workload measured, uncalibrated, and calibrated energy values, along with the resulting absolute and relative errors, so that the predictive claim can be assessed quantitatively.
- [Section IV, discussion of collinearity and Eq. (3)] The paper acknowledges in Section IV that some columns of the coefficient matrix A are 'nearly linear combinations of dominant ones' and that solutions may be non-unique unless bounded, but it does not quantify the conditioning of A for the calibration workloads. If activation, precharge, read, write, and active-standby columns are strongly collinear in the calibration set, the fitted IDD values are not uniquely identified even under a perfect trace, and predictions on workloads with different command mixes become sensitive to the chosen bounds and solver. The authors should report the condition number of A (or the correlation matrix of its columns) for the benchmarks used, and ideally a sensitivity analysis showing how perturbing the fitted IDDs within their bounds changes predicted energy across the calibration and validation sets.
- [Section II-C and Section III] The load-bearing premise of the calibration is that the Pin/Ramulator command trace, configured with the reverse-engineered address mapping, faithfully represents the real memory controller behavior on the Taurus node. The paper itself states in Section II-C that these tools 'use simplified representations of system-level pipelining and concurrency,' so a biased command mix would cause the regression coefficients to absorb trace mismatch rather than true IDD currents. The authors should validate trace fidelity directly, for example by comparing Ramulator-predicted DRAM command counts, bank-level activity, or memory bandwidth against hardware performance counters or HDEEM-derived activity on the calibration benchmarks, and report any discrepancies. This would provide a concrete test of the central assumption rather than leaving it implicit.
minor comments (5)
- [Section II, opening sentence] The sentence 'This session outlines the methodology' appears to contain a typo; 'session' should likely be 'section.'
- [Section II-B, Table I and Listing 1] Table I would be easier to interpret if it specified the array size, stride, and kernel structure for every benchmark, since Listing 1 shows a stride of 8 but the table lists only kernel expressions without these parameters.
- [Section II-D, Eq. (1)] Equation (1) defines Ecmd = Vdd x Top x Nbank x Iop x Ncmd but does not clearly state the units of Top and whether Nbank counts banks per rank or across ranks; please clarify the notation so the equation is self-contained.
- [Section IV, Fig. 4 and Fig. 6] The figures would benefit from explicit per-benchmark labels and error bars or shaded confidence regions for the measured values, especially because Section V emphasizes that residual measurement noise is non-negligible.
- [Section IV, calibration code listing] The Python pseudocode defines 'b = E_meas - E_const' while Eq. (4) uses y, and the relationship between E_const and the intercept term b in Eq. (3) is not defined; please align the notation between the pseudocode and the equations.
Circularity Check
The headline '<5% average energy estimation error' is an in-sample training residual of the least-squares fit in Eq. (4), so the central accuracy claim reduces by construction to the fitted data.
-
fitted input called prediction
[Section IV, Eq. (4), Fig. 4(a), and the sentence following Fig. 4(b)]
"Using measured energy under 24-thread parallel execution as the ground truth, we solve for the IDDs that best fit the observations ... Applying these currents to DRAMPower yields post-calibration simulations that closely align with measurements, reducing the average error to less than 5%."
The IDD values are obtained by minimizing ||A IDD - y||_2 over the same custom benchmarks whose measured energy is y. Eq. (3) defines total energy as a linear combination of the IDD parameters plus an intercept, and Eq. (4) solves for those parameters to best reproduce the measured totals on those very benchmarks. Reporting the post-fit error on the same points is a training-error report by construction. The only held-out evidence, the SPEC2006 comparison in Fig. 6, is described qualitatively ('roughly half') without per-benchmark numbers, error bars, or confidence intervals, so the quantified headline cannot be attributed to generalization.
full rationale
The calibration methodology itself is not circular: it uses independent HDEEM measurements, Pin/Ramulator traces, reverse-engineered address mapping, and an explicit least-squares formulation in Eq. (4). The circularity is confined to the central quantitative claim. The paper fits five IDD currents (plus a residual baseline intercept b) to measured energy on custom STREAM-like benchmarks and then reports that applying the fitted currents gives '<5%' error. Because the same measurements that define y in Eq. (4) are the ones used to judge the post-calibration error in Fig. 4(a), the 5% figure is an in-sample fitting residual, not a prediction. The paper's own limitations section and the list in Section IV acknowledge weak observability, collinearity, and noise; those admissions strengthen the point that the regression can absorb trace/simulator mismatch and measurement bias rather than recovering the true physical IDD currents. The SPEC2006 comparison is genuinely out-of-sample and could have supported generalization, but it is presented only qualitatively ('roughly half') with no numbers, error bars, or confidence intervals, so it does not rescue the quantified 5% claim from being a training residual. Overall, the paper has independent content and an honest limitations discussion, but the headline accuracy statement reduces by construction to the fitted data; score 6, not higher, because the method itself is a legitimate external calibration procedure and the SPEC2006 check provides partial, if unquantified, external evidence.
Assumptions & free parameters
free parameters (5)
- IDD activation current =
see Fig. 4(b)
- IDD precharge current =
see Fig. 4(b)
- IDD active-standby current =
see Fig. 4(b)
- IDD read current =
see Fig. 4(b)
- IDD write current =
see Fig. 4(b)
assumptions (5)
- domain assumption DRAMPower's energy equations (Eq. 1-3) correctly decompose command energy into a linear combination of IDD currents.
- domain assumption Pin and Ramulator traces faithfully capture the real memory access pattern, including timing and address mapping.
- domain assumption HDEEM power measurements isolate DRAM power without significant contamination from other components.
- domain assumption The reverse-engineered channel/rank/bank address mapping is correct.
- domain assumption The 24-thread parallel execution provides a sustained, representative high-load operating point.
Cite this review
Pith. "Pith review of Calibrating DRAMPower Model for HPC: A Runtime Perspective from Real-Time Measurements." pith.science (2026). https://pith.science/paper/LC4ZHFMA
@misc{pith2026241117960,
  author       = {Pith},
  title        = {Pith review of: Calibrating DRAMPower Model for HPC: A Runtime Perspective from Real-Time Measurements},
  year         = {2026},
  howpublished = {\url{https://pith.science/paper/LC4ZHFMA}},
  note         = {Machine review of arXiv:2411.17960}
}
read the original abstract
Main memory's rising energy consumption has emerged as a critical challenge in modern computing architectures, particularly in large-scale systems, driven by frequent access patterns, growing data volumes, and insufficient power management strategies. Accurate modeling of DRAM power consumption is essential to address this challenge and optimize energy efficiency. However, existing modeling tools often rely on vendor-provided datasheet values that are obtained under worst-case or idealized conditions. As a result, they fail to capture important system-level factors, such as temperature variations, chip aging, and workload-induced variability, which leads to significant discrepancies between estimated and actual power consumption observed in real deployments. In this work, we propose a runtime calibration methodology for the DRAMPower model using energy measurements collected from real-system experiments. By applying custom memory benchmarks on an HPC cluster and leveraging fine-grained power monitoring infrastructure, we refine key current parameters (IDD values) in the model. Our calibration reduces the average energy estimation error to less than 5%, substantially improving modeling accuracy and making DRAMPower a more reliable tool for power-aware system design and optimization on the target server platform.
Figures


Figures from the paper (3 more)


Reference graph
Works this paper leans on
-
[1]
Understanding the energy consumption of dynamic ran- dom access memories,
T. V ogelsang, “Understanding the energy consumption of dynamic ran- dom access memories,” in Proc. 43rd Annu. IEEE/ACM Int. Symp. Mi- croarchitecture (MICRO-43), Atlanta, GA, USA, Dec. 2010, pp. 363–374
work page 2010
-
[2]
Micron Technology, Inc., “DRAM power calculator.” [Online]. Available: https://www.micron.com/products/support/power-calc
-
[3]
DRAMPower: A tool to model and estimate power consumption of DRAMs,
M. Lansbergen, K. De Bosschere, and A. Awan, “DRAMPower: A tool to model and estimate power consumption of DRAMs,” in Proc. Int. Symp. Memory Systems (MEMSYS), 2015, pp. 334–341
work page 2015
-
[4]
What your DRAM power models are not telling you: Lessons from a detailed experimental study,
S. Ghose et al., “What your DRAM power models are not telling you: Lessons from a detailed experimental study,” Proc. ACM Meas. Anal. Comput. Syst., vol. 2, no. 3, Art. 38, pp. 1–41, Dec. 2018
work page 2018
-
[5]
Sectored DRAM: A practical energy-efficient and high- performance fine-grained DRAM architecture,
A. Olgun et al., “Sectored DRAM: A practical energy-efficient and high- performance fine-grained DRAM architecture,” ACM Trans. Archit. Code Optim., vol. 21, no. 3, Art. 60, Sep. 2024
work page 2024
-
[6]
HDEEM: High definition energy efficiency mon- itoring,
D. Hackenberg, et al., “HDEEM: High definition energy efficiency mon- itoring,” in Proc. Energy Efficient Supercomputing Workshop (E2SC), Nov. 2014, pp. 1–10. 6
work page 2014
-
[7]
STREAM: Sustainable memory bandwidth in high performance computers,
J. D. McCalpin, “STREAM: Sustainable memory bandwidth in high performance computers,” Tech. Rep., Univ. of Virginia, Charlottesville, V A, USA, 1995. [Online]. Available: https://www.cs.virginia.edu/stream/
work page 1995
-
[8]
Pin: building customized program analysis tools with dynamic instrumentation,
C. Luk et al., “Pin: building customized program analysis tools with dynamic instrumentation,” SIGPLAN Not. 40, 6 (June 2005), 190–200
work page 2005
Show all 9 references
-
[9]
Ramulator: A fast and extensible DRAM simulator,
Y . Kim, W. Yang, and O. Mutlu, “Ramulator: A fast and extensible DRAM simulator,” IEEE Comput. Archit. Lett., vol. 15, no. 1, pp. 45–49, Jan.–Jun. 2016
2016
Reviewed August 12, 2026 · model on record in the stance chip above.
Discussion (0). Continue with ORCID to comment.