REVIEW 3 major objections 6 minor 63 references
Microcirculatory blood flow with aberrant levels of red blood cell aggregation
T0 review · 3 major / 6 minor · reviewed 2026-08-12 · deepseek-v4-flash
Pith's one-line read Simulations show that red blood cell aggregation alone can create damaging wall shear stress fluctuations in small blood vessels, a mechanical pathway for vascular injury.
desk verdict A careful simulation study that gives the aggregation-to-WSS-fluctuation mechanism a plausible physical footing, though the load-bearing parameter Kagg=1 is uncalibrated and the statistics are single-run. read the letter →
The pith
A machine-rendered reading of the paper's core claim, the machinery that carries it, and where it could break.
The reading
What carries the argument
The load-bearing object is a phenomenological Morse potential between surface nodes of neighboring RBCs, with interaction parameters r0=0.49 micrometers and beta=3.84 per micrometer, and a dimensionless aggregation number Kagg=De*beta/(eta*gamma_w) that sets the balance between cell-cell attraction and viscous drag. At Kagg=1 the attraction roughly balances flow-induced separation, and this is the regime studied. The cells themselves are deformable fluid-filled capsules with biconcave resting shapes, while sickle cells are stiffer, smaller, curved-prolate capsules; the suspensions are solved with an immersed boundary method in pressure-driven straight and curved tubes. The analysis then rests on two diagnostics: the local cell-free layer thickness measured from the center of mass of the nearest cell, and wall shear stress sampled at fixed wall points, whose fluctuations are characterized by probability densities and power spectral densities.
What would settle it
Measure wall shear stress fluctuations in a roughly 32 micrometer microfluidic tube at 20 percent hematocrit and a wall shear rate near 100 per second, with dextran- or fibrinogen-induced aggregation tuned to Kagg approximately 1: the power spectral density should show the predicted peak at f approximately 0.04, about 4 per second dimensional, and an enhanced high-stress tail; if no such peak appears while aggregation is present, the proposed cluster-passage mechanism is not supported.
Extended reading notes
Core claim
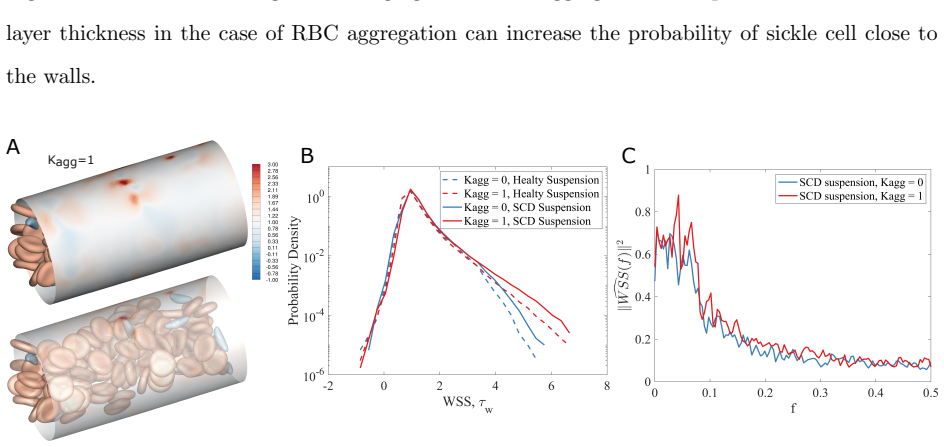
The central claim is that RBC aggregation alone, even without biochemical signaling, can create a damaging hemodynamic environment in the microcirculation. In the simulations, setting the aggregation strength to Kagg=1, where intercellular attraction balances the viscous stress of the roughly 100 per second flow, transforms a fairly uniform suspension into a heterogeneous one: rouleaux and clusters form, the mean cell-free layer thickness increases, and yet the probability of a very thin cell-free layer and of cells nearly touching the wall also rises. Passing aggregates generate wall shear stress excursions whose high-stress tail is orders of magnitude more probable than without aggregation, and the power spectral density develops a distinct peak near f=0.04, corresponding to clusters travelling close to the wall; the frequency of these events scales with hematocrit times shear rate. Adding 10 percent stiff sickle cells deepens margination, so the sickled cells sit closer to the wall and produce an additional higher-frequency peak near f=0.07. Curved vessels accentuate clustering and increase wall shear stress fluctuations, especially on the outer curve.
Load-bearing premise
The simulations rely on a single adjustable attraction strength between red blood cells, chosen so that aggregation and flow forces are balanced; if the real pathological stickiness is weaker than this choice, the predicted wall-stress fluctuations and their frequency peak would be smaller or absent.
Editorial extensions
If this is right
- If aggregation is strong enough to reach the Kagg approximately 1 balance, microvessel walls experience intermittent high shear stress events even when the mean cell-free layer is thicker, so average cell-free layer measurements can mask a more dangerous fluctuation environment.
- The reported peak at f approximately 0.04, about 4 per second at a 100 per second wall shear rate, gives a quantitative, testable signature of aggregation-induced wall stress fluctuations in straight vessels.
- In sickle cell disease, aggregation and margination act synergistically: the same aggregation that pulls normal cells together pushes stiff sickled cells closer to the wall, raising the chance of wall contact and high stress.
- Vessel curvature, as found in capillary networks, promotes RBC clustering and moves the largest shear stress fluctuations to the outer wall of the curve, indicating that geometry should be considered when assessing vascular injury risk.
- Higher hematocrit, 30 percent versus 20 percent, shifts the wall shear stress fluctuation peak from f approximately 0.04 to f approximately 0.06, consistent with a linear scaling of passage frequency with volume fraction.
Reading between the lines
- If the f approximately 0.04 peak is confirmed experimentally, wall-shear-stress spectral analysis could become a non-invasive indicator of pathological aggregation and endothelial risk in microfluidic or in vivo settings.
- The model implicitly predicts that interventions that reduce aggregation strength should suppress the low-frequency wall stress peak before the mean cell-free layer thickness changes much, because the peak is driven by near-wall cluster passage rather than by average cell-free layer thickness.
- The Kagg=1 choice is a single operating point; real aberrant aggregation varies with fibrinogen level and shear rate, so the quantitative threshold for endothelial damage likely depends on both, and mapping Kagg across disease states would test clinical relevance.
- Because the same Morse potential is applied to sickle-normal and sickle-sickle pairs, the model isolates mechanical margination; adding specific sickle-cell adhesion could modulate the results and is a natural next step.
Editorial analysis
A structured set of objections, weighed in public.
Referee Report
Summary. This manuscript presents immersed-boundary simulations of deformable red blood cell capsules in straight and curved cylindrical tubes, with a Morse potential describing cell-cell aggregation. It compares Kagg=0 and Kagg=1 for suspensions of normal RBCs, binary suspensions containing 10% stiff sickle cells, and variations in capillary number and hematocrit. The paper reports that aggregation thickens but destabilizes the cell-free layer, produces large wall shear stress fluctuations, and yields a distinct power spectral density peak near f = 0.04, an effect that is amplified by stiff sickle cells and by vessel curvature. The authors propose that this aggregation-induced wall shear stress environment explains glycocalyx disruption and endothelial damage in disorders with aberrant erythrocyte aggregation.
Significance. If the quantitative claims are robust, the paper provides a plausible mechanical pathway linking pathological RBC aggregation to endothelial injury, complementing recent microfluidic experiments by Druzak et al. and extending the authors' prior work on margination of aberrant RBCs. The model is physically detailed, using the Skalak membrane law, Canham-Helfrich bending energy, and an immersed boundary method, and the paper explicitly tests the effect of hematocrit and capillary number on the aggregation-driven phenomena. The scaling argument f ~ phi*gamma_dot and the observed shift of the PSD peak from f = 0.04 at phi = 0.2 to f = 0.06 at phi = 0.3 is a useful internal consistency check. The main caveats are that the aggregation strength is not calibrated to a pathological condition and that the headline spectral peak and high-stress tail lack statistical uncertainty estimates; these limit the strength of the quantitative conclusions but not the value of the qualitative findings.
major comments (3)
- [Section II, Eqs. (1)-(2), and the definition of Kagg] The central comparison is between Kagg = 0 and Kagg = 1, but Kagg = 1 is set by the dimensionless balance condition Kagg = De*beta/(eta*gamma_dot) = 1 rather than calibrated to a fibrinogen concentration or to an aggregation energy measured under pathological conditions. Since the near-wall clusters and the f = 0.04 PSD peak arise only at Kagg = 1, the magnitude and even the existence of the predicted wall shear stress fluctuations are not robustly tied to 'aberrant' aggregation. A sweep over Kagg (e.g., 0.5, 1, 2) or a calibration to measured aggregation energies such as those in refs. [46] or [50] is needed to support the quantitative claims.
- [Section III.A, Figs. 3(D) and 3(E)] The high-stress tail in Fig. 3(D) and the PSD peak in Fig. 3(E) are computed from what appears to be a single simulation. The text says the spectrum is 'averaged over many points' but does not state the number of independent samples, provide error bars, or report ensemble averaging over independent initial conditions. The accompanying consistency check (18 events with WSS > 2 over 500 time units) is a rough count, not an estimate of spectral uncertainty. Given that the abstract advertises a distinct peak at f = 0.04, the paper should report confidence intervals or replicate simulations to demonstrate that the peak is not a statistical fluctuation.
- [Section III.A, scaling argument for f_w] The text estimates f_w ~ phi*gamma_dot and then interprets the PSD rise below f ~ 0.3 as the effect of individual cells moving past the sampling point. With phi = 0.2 and gamma_dot = 1, this estimate gives f ~ 0.2, yet the claimed aggregation peak is at f = 0.04, a factor of five lower. The paper does not explain this discrepancy; if the peak is attributed to large aggregated regions rather than single cells, the relationship between cluster size or wavelength and the scaling argument should be made explicit. The relative shift from 0.04 to 0.06 with phi = 0.2 to 0.3 is consistent with f ~ phi, but the absolute frequency of the peak remains unexplained.
minor comments (6)
- [Section I.A] There is a typo in 'substntial' in the sentence about marginated aberrant cells playing a substantial role.
- [Section II, membrane energy equation] The two bending moduli in the energy expression are both written as K_B, and the text also says 'KB and KB'; the Gaussian curvature term should have its own modulus, e.g., K_G, to avoid ambiguity.
- [Figure 3(D) caption] The statement that 'the wall shear stress is dimensionless using gamma_dot ~ 100 s^-1' is dimensionally incomplete; presumably tau_w is normalized by eta*gamma_dot, and this should be stated.
- [Section III.C] There is a typo 'peak frequenct', and the claim that at Ca = 1 the aggregation effect on wall shear stress 'remains limited' is made by visual inspection of PDFs; a quantitative measure such as the variance or tail probability would be more convincing.
- [Section III.B] The same Morse potential is applied to sickle-sickle and sickle-normal pairs; the authors acknowledge this simplification, but a brief discussion of how a stronger sickle-specific adhesion would affect the margination and wall stress conclusions would help the reader assess the robustness of the SCD-specific claims.
- [Section II] The statement that a verification run at Rep = 0.05 produced no changes in conclusions is not documented; please show the comparison or specify where it appears in the Supplementary Materials.
Circularity Check
No significant circularity: simulated WSS/CFL peaks are emergent outputs, not fitted or defined into existence.
full rationale
Walking the derivation chain, the central claims (rouleaux formation, CFL thickening plus fluctuations, high-WSS tails, PSD peak near f = 0.04) are measured outputs of a direct cell-level simulation, not quantities reconstructed from the model inputs. The aggregation model is a Morse potential (Eqs. 1-2) with r0 and beta taken from Zhang et al. [46]; the dimensionless strength Kagg = De*beta/(eta*gamma_w) is set by hand to 1 at the nominal balance between attraction and viscous stress. No parameter is fitted to the reported CFL thickness statistics, WSS distributions, or PSD peak, so the peak is emergent rather than imposed. The scaling f ~ phi*gamma_dot is derived from a flux argument (j_w ~ n*v, f_w ~ j_w*a^2) before it is compared with the phi = 30% case; the shift from f ~ 0.04 to f ~ 0.06 is a genuine consistency test of that derivation, not a fitted prediction. The corroborating event count (18 events per 500 time units) uses the same simulation time series as the PSD, but only as an internal check of the identified peak, not as the origin of the claimed frequency. Self-citations to [29] and [59] supply methodology and prior margination results, but those are supported by external experiments and do not function as an unverified uniqueness premise or as the sole justification for the paper's conclusions. The main substantive risk, that Kagg = 1 may not faithfully represent pathologically elevated aggregation, is a parameterization and robustness concern rather than circularity.
Assumptions & free parameters
free parameters (1)
- Kagg =
1
assumptions (5)
- domain assumption RBCs can be modeled as deformable fluid-filled elastic capsules with Skalak membrane and Canham-Helfrich bending energy.
- domain assumption A simple Morse potential captures RBC aggregation sufficiently for studying hemodynamics.
- domain assumption Viscosity ratio of 1 between internal and external fluids gives qualitatively correct suspension dynamics.
- ad hoc to paper The same aggregation model applies to sickle cell-to-sickle and sickle-to-normal interactions.
- domain assumption Wall shear stress fluctuations are a mechanical cause of glycocalyx disruption and endothelial damage.
Cite this review
Pith. "Pith review of Microcirculatory blood flow with aberrant levels of red blood cell aggregation." pith.science (2026). https://pith.science/paper/FDMK27SD
@misc{pith2026241118703,
  author       = {Pith},
  title        = {Pith review of: Microcirculatory blood flow with aberrant levels of red blood cell aggregation},
  year         = {2026},
  howpublished = {\url{https://pith.science/paper/FDMK27SD}},
  note         = {Machine review of arXiv:2411.18703}
}
read the original abstract
Recent clinical results indicate that aberrant erythrocyte aggregation in hematological disorders is accompanied by endothelial damage and glycocalyx disruption, but the underlying biophysical mechanisms remain unclear. This study uses direct computational modeling to explore how red blood cell (RBC) aggregation impacts shear stress in small blood vessels, highlighting the increased risk of vascular damage. RBC aggregation creates a heterogeneous distribution, leading to variations in the cell-free layer thickness and fluctuating wall shear stress, especially near vessel walls. This effect aligns with experimental findings on endothelial disruption linked to RBC clustering near the wall, potentially reducing the protective glycocalyx layer. The power spectral density analysis of wall shear stress fluctuations reveals that, with RBC aggregation, there is a distinct peak near frequency f = 0.04, indicating increased fluctuations due to aggregated RBC clusters traveling close to the vessel wall. The presence of aberrant cells in blood disorders, modeled here by sickle cells, further amplifies these effects, as aggregation-enhanced margination drives sickle cells closer to vessel walls, exacerbating shear stress fluctuations and increasing the likelihood of vascular injury and inflammation. Simulations show that curved vascular geometry, with curvature accentuating RBC clustering near vessel walls, intensifies aggregation-induced wall shear stress fluctuations and increases the risk of vascular damage, particularly in sickle cell disease where sickle cells marginate closer to the wall.
Figures


Figures from the paper (9 more)




Reference graph
Works this paper leans on
- [46]
-
[50]
Y. Deng, D. P. Papageorgiou, X. Li, N. Perakakis, C. S. Mantzoros, M. Dao, and G. E. Kar- niadakis, Quantifying fibrinogen-dependent aggregation of red blood cells in type 2 diabetes mellitus, Biophysical journal 119, 900 (2020)
work page 2020
-
[1]
S. Druzak, E. Iffrig, B. R. Roberts, T. Zhang, K. S. Fibben, Y. Sakurai, H. P. Verkerke, C. A. Rostad, A. Chahroudi, F. Schneider, A. K. H. Wong, A. M. Roberts, J. D. Chandler, S. O. Kim, M. Mosunjac, M. Mosunjac, R. Geller, I. Albizua, S. R. Stowell, C. M. Arthur, E. J. Anderson, A. A. Ivanova, J. Ahn, X. Liu, K. Maner-Smith, T. Bowen, M. Paiardini, S. E...
work page 2023
-
[2]
C. Ince, P. R. Mayeux, T. Nguyen, H. Gomez, J. A. Kellum, G. A. Ospina-Tasc´ on, G. Her- nandez, P. Murray, D. D. Backer, and A. X. Workgroup, The Endothelium in Sepsis, SHOCK 45, 259 (2016)
work page 2016
- [3]
-
[4]
C. Hahn and M. A. Schwartz, Mechanotransduction in vascular physiology and atherogenesis, Nature Reviews Molecular Cell Biology 10, 53 (2009)
work page 2009
-
[5]
B. K. Walther, N. K. R. Pandian, K. A. Gold, E. S. Kili¸ c, V. Sama, J. Gu, A. K. Gaharwar, A. Guiseppi-Elie, J. P. Cooke, and A. Jain, Mechanotransduction-on-chip: vessel-chip model of endothelial yap mechanobiology reveals matrix stiffness impedes shear response, Lab on a Chip 21, 1738 (2021)
work page 2021
-
[6]
K.-C. Wang, Y.-T. Yeh, P. Nguyen, E. Limqueco, J. Lopez, S. Thorossian, K.-L. Guan, Y.- S. J. Li, and S. Chien, Flow-dependent yap/taz activities regulate endothelial phenotypes and atherosclerosis, Proceedings of the National Academy of Sciences 113, 11525 (2016)
work page 2016
Show all 63 references
-
[7]
M. He, M. Martin, T. Marin, Z. Chen, and B. Gongol, Endothelial mechanobiology, APL Bioengineering 4, 010904 (2020)
2020
-
[8]
Panciera, L
T. Panciera, L. Azzolin, M. Cordenonsi, and S. Piccolo, Mechanobiology of yap and taz in physiology and disease, Nature Reviews Molecular Cell Biology 18, 758 (2017)
2017
-
[9]
Harrison, J
D. Harrison, J. Widder, I. Grumbach, W. Chen, M. Weber, and C. Searles, Endothelial mechanotransduction, nitric oxide and vascular inflammation, Journal of Internal Medicine 259, 351 (2006). 26
2006
-
[10]
Chien, Mechanotransduction and endothelial cell homeostasis: The wisdom of the cell, Am
S. Chien, Mechanotransduction and endothelial cell homeostasis: The wisdom of the cell, Am. J. Physiol. Heart Circ. Physiol. 292, H1209 (2007)
2007
-
[11]
Abe and B
J.-i. Abe and B. C. Berk, Novel mechanisms of endothelial mechanotransduction, Arterioscle- rosis, Thrombosis, and Vascular Biology 34, 2378 (2014)
2014
-
[12]
X. Bao, C. Lu, and J. A. Frangos, Temporal gradient in shear but not steady shear stress induces PDGF-A and MCP-1 expression in endothelial cells: role of NO, NF kappa B, and egr-1, Arterioscler. Thromb. Vasc. Biol. 19, 996 (1999)
1999
-
[13]
P. F. Davies, Overview: Temporal and spatial relationships in shear stress-mediated endothe- lial signalling, J. Vasc. Res. 34, 208 (1997)
1997
-
[14]
G. W. De Keulenaer, D. C. Chappell, N. Ishizaka, R. M. Nerem, R. W. Alexander, and K. K. Griendling, Oscillatory and steady laminar shear stress differentially affect human endothelial redox state: role of a superoxide-producing NADH oxidase, Circ. Res. 82, 1094 (1998)
1998
-
[15]
K. D. Chen, Y. S. Li, M. Kim, S. Li, S. Yuan, S. Chien, and J. Y. Shyy, Mechanotransduction in response to shear stress. Roles of receptor tyrosine kinases, integrins, and Shc, J. Biol. Chem. 274, 18393 (1999)
1999
-
[16]
Akimoto, M
S. Akimoto, M. Mitsumata, T. Sasaguri, and Y. Yoshida, Laminar shear stress in- hibits vascular endothelial cell proliferation by inducing cyclin-dependent kinase inhibitor p21(Sdi1/Cip1/Waf1), Circ. Res. 86, 185 (2000)
2000
-
[17]
M. E. Davis, H. Cai, G. R. Drummond, and D. G. Harrison, Shear stress regulates endothelial nitric oxide synthase expression through c-Src by divergent signaling pathways, Circ. Res. 89, 1073 (2001)
2001
-
[18]
R. J. Dekker, S. van Soest, R. D. Fontijn, S. Salamanca, P. G. de Groot, E. VanBavel, H. Pannekoek, and A. J. G. Horrevoets, Prolonged fluid shear stress induces a distinct set of endothelial cell genes, most specifically lung Kruppel-like factor (KLF2), Blood 100, 1689 (2002)
2002
-
[19]
T. K. Hsiai, S. K. Cho, P. K. Wong, M. Ing, A. Salazar, A. Sevanian, M. Navab, L. L. Demer, and C.-M. Ho, Monocyte recruitment to endothelial cells in response to oscillatory shear stress, F ASEB J.17, 1648 (2003)
2003
-
[20]
G. P. Sorescu, H. Song, S. L. Tressel, J. Hwang, S. Dikalov, D. A. Smith, N. L. Boyd, M. O. Platt, B. Lassegue, K. K. Griendling, and H. Jo, Bone morphogenic protein 4 produced in endothelial cells by oscillatory shear stress induces monocyte adhesion by stimulating reactive 2...
2004
-
[21]
Y.-S. J. Li, J. H. Haga, and S. Chien, Molecular basis of the effects of shear stress on vascular endothelial cells, J. Biomech. 38, 1949 (2005)
2005
-
[22]
Caruso, X
C. Caruso, X. Zhang, Y. Sakurai, W. Li, M. E. Fay, M. A. Carden, D. R. Myers, R. G. Mannino, C. H. Joiner, M. D. Graham, et al., Stiff erythrocyte subpopulations biomechanically induce endothelial inflammation in sickle cell disease, Blood 134, 3560 (2019)
2019
-
[23]
Caruso, M
C. Caruso, M. E. Fay, X. Cheng, A. Y. Liu, S. I. Park, T. A. Sulchek, M. D. Graham, and W. A. Lam, Pathologic mechanobiological interactions between red blood cells and endothelial cells directly induce vasculopathy in iron deficiency anemia, iScience 25, 104606 (2022)
2022
-
[24]
Kumar and M
A. Kumar and M. D. Graham, Mechanism of Margination in Confined Flows of Blood and Other Multicomponent Suspensions, Physical Review Letters 109, 108102 (2012), 1208.0943
2012 arXiv
-
[25]
R. G. H. Henr ´ ıquez Rivera, K. Sinha, and M. D. Graham, Margination Regimes and Drainage Transition in Confined Multicomponent Suspensions, Physical Review Letters 114, 188101 (2015), 1504.03736
2015 arXiv
-
[26]
R. G. Henr ´ ıquez Rivera, X. Zhang, and M. D. Graham, Mechanistic theory of margination and flow-induced segregation in confined multicomponent suspensions: Simple shear and Poiseuille flows*, Physical Review Fluids 1, 060501 (2016)
2016
-
[27]
Zhang, C
X. Zhang, C. Caruso, W. A. Lam, and M. D. Graham, Flow-induced segregation and dynamics of red blood cells in sickle cell disease, Physical Review Fluids 5, 053101 (2020)
2020
-
[28]
Caruso, M
C. Caruso, M. E. Fay, S. I. Park, T. A. Sulchek, M. D. Graham, and W. A. Lam, Assessing the Physiologic Relevance of Red Blood Cell Deformability in Iron Deficiency Anemia, Blood 138, 4153 (2021)
2021
-
[29]
Cheng, C
X. Cheng, C. Caruso, W. A. Lam, and M. D. Graham, Marginated aberrant red blood cells induce pathologic vascular stress fluctuations in a computational model of hematologic disor- ders, Science Advances 9, eadj6423 (2023)
2023
-
[30]
Armstrong, A
M. Armstrong, A. Pincot, S. Jariwala, J. Horner, N. Wagner, and A. Beris, Tensorial formu- lations for improved thixotropic viscoelastic modeling of human blood, Journal of Rheology 66, 327 (2022)
2022
-
[31]
W. B. Russel, D. A. Saville, and W. R. Schowalter, Colloidal Dispersions (Cambridge Uni- versity Press, Cambridge, 1989)
1989
-
[32]
Neu and H
B. Neu and H. J. Meiselman, Depletion-mediated red blood cell aggregation in polymer solu- 28 tions, Biophysical Journal 83, 2482 2490 (2002)
2002
-
[33]
Rampling, H
M. Rampling, H. Meiselman, B. Neu, and O. Baskurt, Influence of cell-specific factors on red blood cell aggregation, Biorheology 41, 91 112 (2004)
2004
-
[34]
P. K. Ong, B. Namgung, P. C. Johnson, and S. Kim, Effect of erythrocyte aggregation and flow rate on cell-free layer formation in arterioles, American Journal of Physiology-Heart and Circulatory Physiology 298, H1870 (2010)
2010
-
[35]
P. K. Ong, S. Jain, B. Namgung, Y. I. Woo, and S. Kim, Cell-free layer formation in small arterioles at pathological levels of erythrocyte aggregation, Microcirculation 18, 541 (2011)
2011
-
[36]
Sherwood, J
J. Sherwood, J. Dusting, E. Kaliviotis, and S. Balabani, The effect of red blood cell aggregation on velocity and cell-depleted layer characteristics of blood in a bifurcating microchannel, Biomicrofluidics 6 (2012)
2012
-
[37]
Claver ´ ıa, P
V. Claver ´ ıa, P. Connes, L. Lanotte, C. Renoux, P. Joly, R. Fort, A. Gauthier, C. Wagner, and M. Abkarian, In vitro red blood cell segregation in sickle cell anemia, Frontiers in Physics 9, 712 (2021)
2021
-
[38]
A. D. Truong, S. C. Auld, N. A. Barker, S. Friend, A. T. Wynn, J. Cobb, R. M. Sniecinski, C.- L. Tanksley, D. M. Polly, M. Gaddh, M. Connor, H. Nakahara, H. C. Sullivan, C. Kempton, J. Guarner, A. Duncan, C. D. Josephson, J. D. Roback, S. R. Stowell, and C. L. Maier, Therapeut...
2021
-
[39]
Nader, C
E. Nader, C. Nougier, C. Boisson, S. Poutrel, J. Catella, F. Martin, J. Charvet, S. Girard, S. Havard-Guibert, M. Martin, H. Rezigue, H. Desmurs-Clavel, C. Renoux, P. Joly, N. Guillot, Y. Bertrand, A. Hot, Y. Dargaud, and P. Connes, Increased blood viscosity and red blood cell...
2022
-
[40]
Dynar, H
M. Dynar, H. Ez-Zahraouy, C. Misbah, and M. Abbasi, Platelet margination dynamics in blood flow: The role of lift forces and red blood cells aggregation, Physical Review Fluids 9, 083603 (2024)
2024
-
[41]
A. K. Dasanna, A. Darras, T. John, G. Gompper, L. Kaestner, C. Wagner, and D. A. Fedosov, Erythrocyte sedimentation: Effect of aggregation energy on gel structure during collapse, Physical Review E 105, 024610 (2022)
2022
-
[42]
Puthumana Melepattu, G
M. Puthumana Melepattu, G. Ma ˆ ıtrejean, and T. Podgorski, Dissociation of red blood cell aggregates in extensional flow, Physical Review Fluids 9, L071101 (2024). 29
2024
-
[43]
Y. Liu, L. Zhang, X. Wang, and W. K. Liu, Coupling of navier–stokes equations with protein molecular dynamics and its application to hemodynamics, International Journal for Numerical Methods in Fluids 46, 1237 (2004)
2004
-
[44]
Liu and W
Y. Liu and W. K. Liu, Rheology of red blood cell aggregation by computer simulation, Journal of Computational Physics 220, 139 (2006)
2006
-
[45]
Bagchi, P
P. Bagchi, P. C. Johnson, and A. S. Popel, Computational fluid dynamic simulation of aggre- gation of deformable cells in a shear flow, Journal of Biomechanical Engineering 127, 1070 (2005)
2005
-
[47]
D. A. Fedosov, W. Pan, B. Caswell, G. Gompper, and G. E. Karniadakis, Predicting human blood viscosity in silico, Proceedings of the National Academy of Sciences 108, 11772 (2011)
2011
-
[48]
D. Xu, E. Kaliviotis, A. Munjiza, E. Avital, C. Ji, and J. Williams, Large scale simulation of red blood cell aggregation in shear flows, Journal of Biomechanics 46, 1810 (2013)
2013
-
[49]
Yoon and D
D. Yoon and D. You, Continuum modeling of deformation and aggregation of red blood cells, Journal of Biomechanics 49, 2267 (2016)
2016
-
[51]
Klitzman and B
B. Klitzman and B. R. Duling, Microvascular hematocrit and red cell flow in resting and contracting striated muscle, American Journal of Physiology-Heart and Circulatory Physiology 237, H481 (1979)
1979
-
[52]
I. H. Sarelius and B. R. Duling, Direct measurement of microvessel hematocrit, red cell flux, velocity, and transit time, American Journal of Physiology-Heart and Circulatory Physiology 243, H1018 (1982)
1982
-
[53]
S. M. Recktenwald, K. Graessel, F. M. Maurer, T. John, S. Gekle, and C. Wagner, Red blood cell shape transitions and dynamics in time-dependent capillary flows, Biophysical Journal 121, 23 (2022)
2022
-
[54]
Zhang, W
X. Zhang, W. A. Lam, and M. D. Graham, Dynamics of deformable straight and curved prolate capsules in simple shear flow, Physical Review Fluids 4, 043103 (2019)
2019
-
[55]
D. A. Reasor, M. Mehrabadi, D. N. Ku, and C. K. Aidun, Determination of Critical Parameters 30 in Platelet Margination, Annals of Biomedical Engineering 41, 238 249 (2013)
2013
-
[56]
P. B. Canham, The minimum energy of bending as a possible explanation of the biconcave shape of the human red blood cell, Journal of theoretical biology 26, 61 (1970)
1970
-
[57]
Helfrich, Elastic properties of lipid bilayers: theory and possible experiments, Zeitschrift f¨ ur Naturforschung c28, 693 (1973)
W. Helfrich, Elastic properties of lipid bilayers: theory and possible experiments, Zeitschrift f¨ ur Naturforschung c28, 693 (1973)
1973
-
[58]
Skalak, A
R. Skalak, A. Tozeren, R. Zarda, and S. Chien, Strain energy function of red blood cell membranes, Biophysical journal 13, 245 (1973)
1973
-
[59]
Sinha and M
K. Sinha and M. D. Graham, Dynamics of a single red blood cell in simple shear flow, Physical Review E 92, 042710 (2015)
2015
-
[60]
Evans and Y.-C
E. Evans and Y.-C. Fung, Improved measurements of the erythrocyte geometry, Microvascular Research 4, 335 (1972)
1972
-
[61]
J. F. Bertles, P. F. Milner, et al., Irreversibly sickled erythrocytes: a consequence of the heterogeneous distribution of hemoglobin types in sickle-cell anemia, The Journal of Clinical Investigation 47, 1731 (1968)
1968
-
[62]
Balogh and P
P. Balogh and P. Bagchi, A computational approach to modeling cellular-scale blood flow in complex geometry, Journal of Computational Physics 334, 280 (2017)
2017
-
[63]
Mittal, H
R. Mittal, H. Dong, M. Bozkurttas, F. Najjar, A. Vargas, and A. Von Loebbecke, A versatile sharp interface immersed boundary method for incompressible flows with complex boundaries, Journal of Computational Physics 227, 4825 (2008). 31
2008
Reviewed August 12, 2026 · model on record in the stance chip above.
Discussion (0). Continue with ORCID to comment.