REVIEW 4 major objections 4 minor 42 references
Tracing the origins of galaxy lopsidedness across cosmic time
T0 review · 4 major / 4 minor · reviewed 2026-08-12 · deepseek-v4-flash
Pith's one-line read This paper claims that the high fraction of lopsided galaxies observed at 1.5<z<2 is reproduced by the TNG50 simulations, that lopsidedness declines toward z=0, and that the decline reflects tidal interactions and gas accretion being more…
desk verdict Useful TNG50 result on the redshift evolution of lopsidedness, but the 'more effective mechanisms at high-z' claim is overstated: the comparisons are not matched and reverse causality remains a live possibility. read the letter →
The pith
A machine-rendered reading of the paper's core claim, the machinery that carries it, and where it could break.
The reading
What carries the argument
The measurement engine is the azimuthal Fourier decomposition of the face-on stellar mass distribution of TNG50 disk galaxies. The first-mode amplitude, $A_1$, is computed in concentric annuli of width 0.1 kpc and averaged over $R_h < r < 1.4 R_{90}$, inside $|h_z| < 2 h_{90}$, with $A_1 > 0.1$ defining a lopsided galaxy. The sample is built at each redshift with the $\lambda_R$-$\epsilon$ diagram ($\lambda_R > 0.31\sqrt{\epsilon}$, $\epsilon > 0.4$, $R_{90} > 3$ kpc), so each redshift is an independently selected population of disk-like galaxies. The redshift-resolved sample is what allows the authors to separate internal susceptibility from the efficiency of external triggers.
What would settle it
A concrete check: measure the lopsided fraction of a JWST sample at 1.5<z<2 using the same first-mode amplitude metric on mock images of TNG50 galaxies; if the recovered fraction is well below the stated ~60% because the selected disks are systematically different at high z, the redshift trend would be shown to be a selection artifact. Alternatively, running the same selection on a larger TNG volume and finding the high-redshift fraction consistent with ~30% rather than ~60% would falsify the claim.
Extended reading notes
Core claim
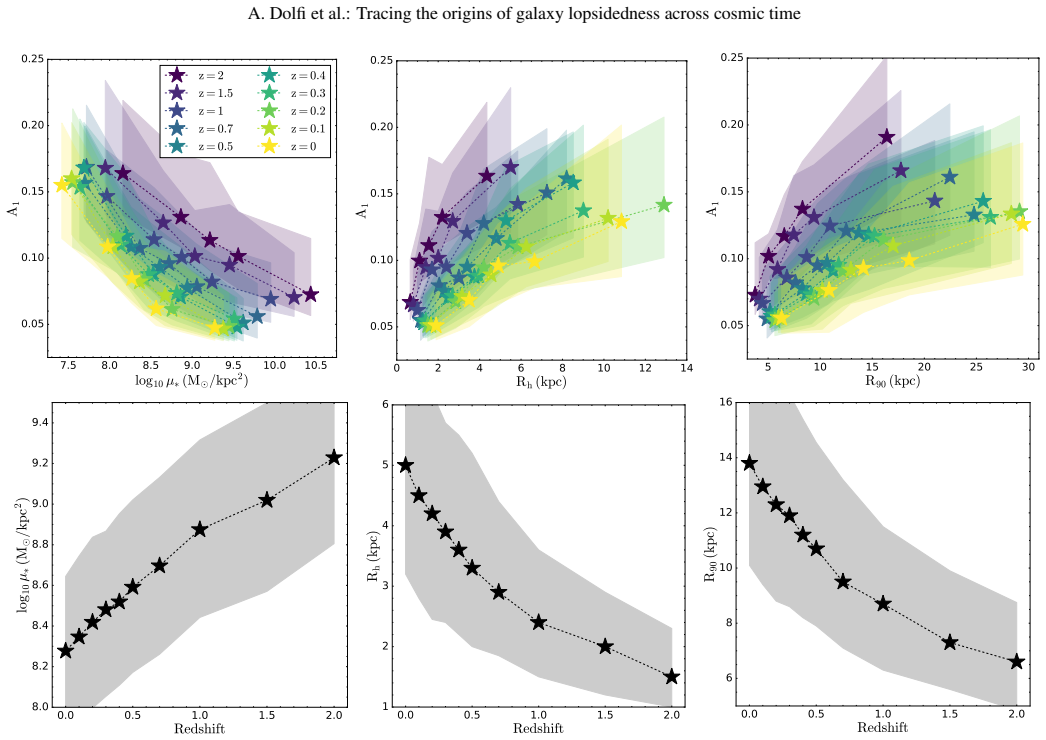
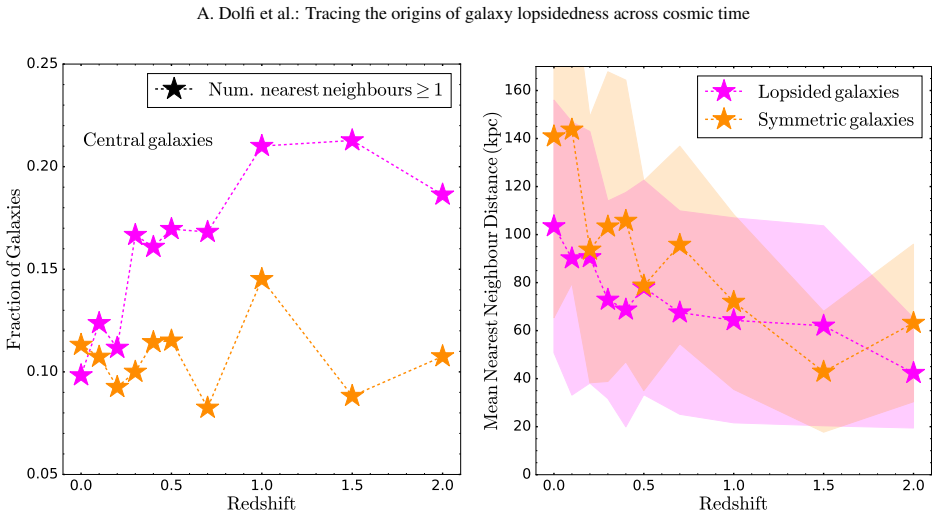
On the paper's own terms, the central discovery is that the redshift trend in lopsidedness is driven by the efficiency of perturbation mechanisms, not by sample selection. In TNG50, the fraction of lopsided disk galaxies (first Fourier mode amplitude $A_1$ averaged over $R_h < r < 1.4 R_{90}$ exceeding 0.1) reaches ~60% at 1.5<z<2, matching the JWST fraction of 64% reported for 22 dusty star-forming galaxies, and falls toward z=0. The same internal-property correlation seen locally holds at every redshift: low central stellar mass density and larger disk size make a galaxy more prone to strong lopsidedness. Yet since high-redshift disks are actually denser and more compact, the observed decrease in lopsidedness toward low redshift cannot come from internal properties alone; it implies the triggering mechanisms are different or more efficient at high redshift. The paper identifies recent close tidal interactions (mass ratio >1:10 within $R_{200}$) and net gas accretion with subsequent star formation as the two mechanisms, finding both act at all redshifts but with greater effect at $z \gtrsim 1$.
Load-bearing premise
The analysis assumes the local-universe disk-selection criteria ($\lambda_R > 0.31\sqrt{\epsilon}$, $\epsilon > 0.4$, $R_{90} > 3$ kpc) and the fixed lopsided threshold $A_1=0.1$ remain valid at all redshifts up to $z=2$, so that the independently selected samples are comparable in what they represent.
Editorial extensions
If this is right
- The ~60% lopsided fraction at 1.5<z<2 in simulations supports the interpretation that JWST's 64% lopsided galaxies are not mostly observational bias.
- Because high-redshift disks are denser and more compact, the strong internal-property correlation would predict less lopsidedness at high z if triggers were equally efficient; the opposite trend is evidence for more efficient early-universe perturbation mechanisms.
- Local environment (10th-nearest-neighbor density) does not set lopsidedness; at all redshifts the susceptibility is set by internal structure, so environment acts only through the frequency of encounters.
- Gas accretion followed by star formation is a viable lopsidedness trigger at all redshifts, and at z>1 it is strong enough to also explain the elevated lopsidedness of central galaxies, not just satellites.
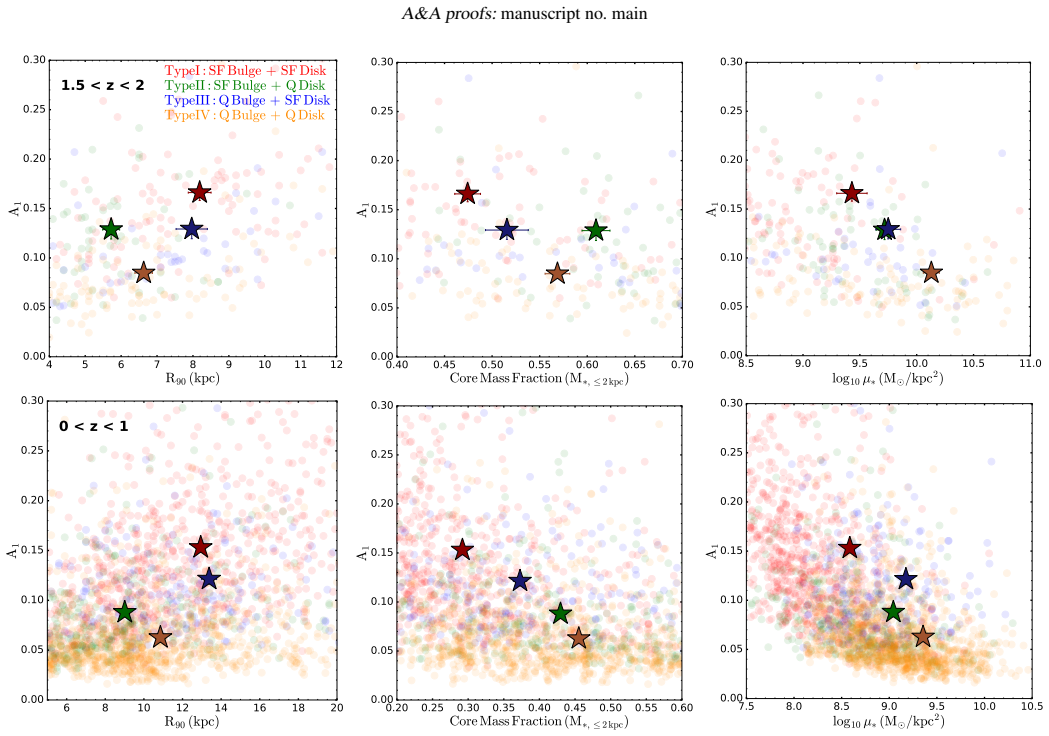
- The outside-in quenching scenario, in which lopsidedness funnels gas to the center and quenches the disk, is consistent with TypeII galaxies' star-forming cores embedded in quenched lopsided disks at high redshift.
Reading between the lines
- Editorial: if the redshift dependence of $A_1$ is as strong as TNG50 suggests, lopsidedness could serve as a cheap, high-redshift proxy for the merger and accretion rate, applicable to large JWST samples without spectroscopy.
- Editorial: the claim that gas accretion with subsequent star formation triggers lopsidedness could be tested directly in the simulation by checking whether the accreted gas has an asymmetric angular momentum distribution and whether the $m=1$ mode grows right after accretion events, a step the authors leave to follow-up work.
- Editorial: the fixed $A_1=0.1$ threshold may mix genuinely different perturbation states across redshift; re-deriving the threshold from the simulated amplitude distribution at each z would show whether part of the trend is threshold-driven.
- Editorial: applying the same analysis to a larger-volume, lower-resolution TNG box would check whether cosmic variance in the small TNG50 volume affects the claimed ~60% high-redshift fraction.
Signed reviews
Editorial analysis
A structured set of objections, weighed in public.
Referee Report
Summary. This paper uses the TNG50 cosmological simulation to study stellar lopsidedness (the m=1 Fourier amplitude A1) in disk-like galaxies at ten redshifts between z=0 and z=2. At each redshift the authors independently select rotation-dominated, flattened, extended galaxies (Secs. 2.2-2.5), measure A1 in the radial range Rh<r<1.4R90, and classify galaxies with A1>0.1 as lopsided (Secs. 3-4.1). They report a lopsided fraction of ~60% at 1.5<z<2, a decrease of fraction and amplitude toward z=0, no strong dependence on local environmental density, and a strong correlation of A1 with central stellar mass density and disk size at all redshifts (Secs. 4.2-4.3, Figs. 3-5). Using a neighbor-count interaction proxy and a 1 Gyr net accretion rate (Secs. 4.4.1-4.4.2, Figs. 6-7), they argue that tidal interactions and gas accretion with subsequent star formation are significantly more effective at high redshift. The final sections compare the simulation sample with the JWST sample of Le Bail et al. (2023) using a four-type classification based on central and disk sSFR (Sec. 5).
Significance. This is a timely and useful paper. The main quantitative results—the high lopsided fraction at 1.5<z<2 and the redshift decline—provide the first direct cosmological-simulation comparison to the JWST lopsidedness excess of Le Bail et al. (2023), and the structural correlation (low central stellar mass density, large disk size) is a robust, physically plausible finding that connects high-redshift and local studies. The paper is transparent about several limitations, including that it does not directly measure asymmetric gas accretion and that lopsidedness itself may funnel gas inward (Secs. 4.4.2 and 5.4). The strengths are the systematic Fourier analysis applied uniformly over redshift, the use of a well-established simulation with public data, and the explicit discussion of differences from observations. The main weakness is that the causal interpretation—higher efficiency of interactions and accretion at high redshift—rests on uncontrolled comparisons and a snapshot-based interaction proxy, so the abstract's strongest claim is not yet supported.
major comments (4)
- [Sec. 2.5 and Sec. 4.1] The sample selection and the lopsided threshold are both inherited from z=0 analyses and are not tested for redshift validity. The lambda_R>0.31*sqrt(epsilon), epsilon>0.4, and R90>3 kpc criteria are calibrated at z=0, and the A1=0.1 threshold is fixed at all redshifts; yet the manuscript itself notes that high-redshift disks are strongly perturbed (Sec. 2.2) and that the z=0 outer-radius definition is not appropriate at z>0.5 (Sec. 3). Because the headline claim is the redshift evolution of the lopsided fraction, the authors need to show the trend is not an artifact of these choices—for example by varying the lambda_R/R90 cuts and the A1 threshold, or by calibrating A1 to the noise level at each redshift.
- [Sec. 4.4.1 and Fig. 6] The interaction proxy counts neighbors with stellar mass ratio >1:10 within R200 at the output snapshot; this is not a measurement of recent tidal interactions. Stable neighbors can be counted while recent fly-bys are missed, as the text itself acknowledges: 'we are not considering the role of recent fly-bys.' Furthermore, Fig. 6 excludes satellite galaxies by construction, although satellites are the population whose environments differ most strongly with redshift. This proxy can support a statement about the presence of potential perturbers, but not the conclusion that 'close tidal interactions are significantly more effective at high-redshift' (Abstract). Merger-tree-based encounter histories or time-resolved orbit classification are needed.
- [Sec. 4.4.2, Eq. 8, Fig. 7, Sec. 5.4] The lopsided and symmetric samples are not matched in the structural properties that Sec. 4.3 (Fig. 5) shows are strongly correlated with A1. The bottom panels of Fig. 5 show that the redshift-dependent samples have different mu*, Rh, and R90 distributions, so the larger net accretion rates and neighbor fractions of lopsided galaxies could reflect these structural differences rather than a redshift-dependent efficiency of the proposed mechanisms. In addition, the net accretion rate in Eq. (8) is measured over the preceding 1 Gyr, and Sec. 5.4 explicitly entertains the reverse channel, in which lopsidedness funnels gas inward. Without matched control samples or time-resolved event ordering (accretion/interaction preceding the onset of lopsidedness), the statement that gas accretion and interactions are 'significantly more effective at high-redshift' is an overstatement; the data as presented support a correlation, not a causal mechanism.
- [Sec. 3 and Fig. 3] Because A1 is averaged over Rh<r<1.4R90 and R90 decreases with redshift (Fig. 5), the measurement region changes systematically with redshift. The paper states in Sec. 3 that the trends are not significantly affected by the radial range, but no supporting figure or test is shown. A robustness test fixing the radial range in physical units (or in units of Rh) should be provided, since the radial range is known to change the fraction of lopsided galaxies.
minor comments (4)
- [Sec. 6] In the first bullet list, 'Fig. 4.4.1' should be 'Fig. 6'.
- [Sec. 5.3] The phrase 'as previously discussed in Sec. 5.4' is a forward reference; the gas-accretion discussion appears in the following subsection.
- [Eq. 8] The abstract and Sec. 4.4.2 use 'net accretion rate' for Eq. (8), which also includes stars formed in the disk; the text should clarify that this is a net gas input plus newly formed stellar mass, not a direct inflow measurement.
- [Fig. 3] The right panel would benefit from error bars or confidence intervals; the TNG50 volume is small and the sample sizes at z=2 are limited, so the ~60% fraction should be accompanied by an estimate of cosmic variance.
Circularity Check
No significant circularity: the central claims are direct measurements from TNG50 compared with external observations, with only minor methodological self-citation that is not load-bearing.
full rationale
The paper's main results (the ~60% lopsided fraction at 1.5<z<2, the decline of lopsidedness toward z=0, and the correlations with internal structure) are computed directly from TNG50 snapshots via Fourier decomposition of the stellar mass distribution, then compared with independent JWST and local-Universe observations. No parameter is fitted to the observed lopsided fraction, and the A1=0.1 threshold is inherited from prior z=0 work by the same group (Varela-Lavin et al. 2023; Dolfi et al. 2023) as a classification convention, not derived from the target high-redshift result. The paper explicitly tests the sensitivity of its trends to the radial averaging range, so the redshift trend is not an artifact of a single definitional choice. The only self-referential elements are methodological (threshold, Fourier method, radial-range choices), and these do not by construction force the predicted fraction or amplitude evolution. The causal interpretation of interactions and gas accretion is not tightly controlled (lopsided and symmetric samples are not matched in structural properties), and the paper itself notes the possible reverse channel where lopsidedness funnels gas inward, but this is a robustness/causal-inference limitation rather than circular reasoning. The derivation chain is therefore essentially self-contained against the TNG50 data, with no load-bearing step that reduces to its own input.
Assumptions & free parameters
free parameters (6)
- A1 threshold =
0.1
- Radial range for A1 =
Rh < r < 1.4 R90
- Central region radius =
2 kpc
- Neighbor mass threshold =
M_tot > 1e9 M_sun
- Mass-ratio cut for interactions =
>1:10
- Net accretion time window =
1 Gyr
assumptions (4)
- domain assumption The lambda_R-epsilon disk selection criteria calibrated at z=0 are valid at all redshifts up to z=2.
- domain assumption The TNG50 subgrid physics (feedback, star formation) accurately reproduces disk structure and lopsidedness across cosmic time.
- domain assumption The A1=0.1 threshold separates lopsided from symmetric galaxies equivalently at all redshifts.
- domain assumption The number of massive neighbors within R200 with mass-ratio >1:10 is a valid proxy for recent tidal interactions that can trigger lopsidedness.
Cite this review
Pith. "Pith review of Tracing the origins of galaxy lopsidedness across cosmic time." pith.science (2026). https://pith.science/paper/INQY2MZL
@misc{pith2026241119426,
  author       = {Pith},
  title        = {Pith review of: Tracing the origins of galaxy lopsidedness across cosmic time},
  year         = {2026},
  howpublished = {\url{https://pith.science/paper/INQY2MZL}},
  note         = {Machine review of arXiv:2411.19426}
}
abstract
Current studies of large-scale asymmetries (i.e. lopsidedness) in the stellar density distribution of disk galaxies have mainly focused on the local Universe. Recent observations have found a significant fraction (over 60%) of lopsided galaxies at high-redshift ($1.5 < z < 3$), which is significantly larger than the fraction (~30%) observed in the nearby Universe. We aim to understand whether the more widespread lopsidedness at high- than low-redshift can be associated to environmental mechanisms being more effective in producing lopsided perturbations at high-redshift. At each redshift between $0 < z < 2$, we independently select a sample of disk-like galaxies from the IllustrisTNG simulations. We then characterize lopsidedness in the disks of galaxies at each redshift, study the relevant mechanisms generating lopsidedness, as well as the correlation between such perturbation, the local environment and the galaxy internal properties as a function of redshift. Consistent with previous and new observational results, we find that: 1) simulations predict a significant fraction (~60%) of lopsided galaxies at high-redshift ($1.5 < z < 2$), 2) the fraction of lopsided galaxies, as well as the lopsided amplitude, decreases from high- to low-redshift, and 3) there is not a significant dependence of lopsidedness on the local environment, but there is a strong correlation between the lopsided amplitude and basic galaxies' structural properties at all redshift between $0 < z < 2$. This means that, independent of the mechanisms on-setting lopsidedness, galaxies with low central stellar mass density and more extended disks are more susceptible of developing strong lopsidedness. We find that both recent interactions with mass-ratio >1:10 and gas accretion with subsequent star formation can produce lopsided perturbations at all redshift, but they are both significantly more effective at high-redshift.
Figures


Figures from the paper (8 more)




Reference graph
Works this paper leans on
-
[1]
E., Lynden-Bell, D., & Sancisi, R
Baldwin, J. E., Lynden-Bell, D., & Sancisi, R. 1980, MNRAS, 193, 313
1980
-
[2]
Beale, J. S. & Davies, R. D. 1969, Nature, 221, 531
work page 1969
-
[3]
L., Bertin, G., Stockton, A., et al
Block, D. L., Bertin, G., Stockton, A., et al. 1994, A&A, 288, 365
work page 1994
-
[4]
Bournaud, F., Combes, F., & Jog, C. J. 2004, A&A, 418, L27
work page 2004
-
[5]
J., & Puerari, I
Bournaud, F., Combes, F., Jog, C. J., & Puerari, I. 2005, A&A, 438, 507
2005
-
[6]
J., Bershady, M
Conselice, C. J., Bershady, M. A., & Jangren, A. 2000, ApJ, 529, 886
2000
-
[7]
J., Bluck, A
Conselice, C. J., Bluck, A. F. L., Mortlock, A., Palamara, D., & Benson, A. J. 2014, MNRAS, 444, 1125
2014
-
[8]
A., Monachesi, A., et al
Dolfi, A., Gómez, F. A., Monachesi, A., et al. 2023, MNRAS, 526, 567
2023
Show all 42 references
-
[9]
1980, ApJ, 236, 351
Dressler, A. 1980, ApJ, 236, 351
1980
-
[10]
J., et al
Dressler, A., Oemler, Augustus, J., Couch, W. J., et al. 1997, ApJ, 490, 577
1997
-
[11]
2007, MNRAS, 379, 401
Emsellem, E., Cappellari, M., Krajnovi´c, D., et al. 2007, MNRAS, 379, 401
2007
-
[12]
2011, Monthly Notices of the Royal Astronomical Society, 414, 888
Emsellem, E., Cappellari, M., Krajnovi´c, D., et al. 2011, Monthly Notices of the Royal Astronomical Society, 414, 888
2011
-
[13]
D., Monachesi, A., Gómez, F
Gargiulo, I. D., Monachesi, A., Gómez, F. A., et al. 2022, MNRAS, 512, 2537
2022
-
[14]
M., Hernquist, L., et al
Genel, S., Fall, S. M., Hernquist, L., et al. 2015, ApJ, 804, L40
2015
-
[15]
2014, MNRAS, 445, 175 Gómez, F
Genel, S., V ogelsberger, M., Springel, V ., et al. 2014, MNRAS, 445, 175 Gómez, F. A., White, S. D. M., Grand, R. J. J., et al. 2017, MNRAS, 465, 3446
2014
-
[16]
Grand, R. J. J., Gómez, F. A., Marinacci, F., et al. 2017, MNRAS, 467, 179
2017
-
[17]
P., Hogg, D
Haynes, M. P., Hogg, D. E., Maddalena, R. J., Roberts, M. S., & van Zee, L. 1998, The Astronomical Journal, 115, 62
1998
-
[18]
2015, A&A, 579, A2
Ilbert, O., Arnouts, S., Le Floc’h, E., et al. 2015, A&A, 579, A2
2015
-
[19]
2022, MNRAS, 513, 3768
Irodotou, D., Fragkoudi, F., Pakmor, R., et al. 2022, MNRAS, 513, 3768
2022
-
[20]
G., Scannapieco, C., Nuza, S
Iza, F. G., Scannapieco, C., Nuza, S. E., et al. 2022, MNRAS, 517, 832
2022
-
[21]
Jog, C. J. 1997, The Astrophysical Journal, 488, 642
1997
-
[22]
S., Daddi, E., Bournaud, F., et al
Kalita, B. S., Daddi, E., Bournaud, F., et al. 2022, A&A, 666, A44
2022
-
[23]
2020, Monthly Notices of the Royal Astronomical Society, 498, 1080
Kipper, R., Benito, M., Tenjes, P., Tempel, E., & de Propris, R. 2020, Monthly Notices of the Royal Astronomical Society, 498, 1080
2020
-
[24]
Lagos, C. d. P., Theuns, T., Stevens, A. R. H., et al. 2016, Monthly Notices of the Royal Astronomical Society, 464, 3850 Le Bail, A., Daddi, E., Elbaz, D., et al. 2023, arXiv e-prints, arXiv:2307.07599 Łokas, E. L. 2022, A&A, 662, A53
2016 arXiv
-
[25]
& Tagger, M
Masset, F. & Tagger, M. 1997, A&A, 322, 442
1997
-
[26]
2015, Astronomy and Computing, 13, 12
Nelson, D., Pillepich, A., Genel, S., et al. 2015, Astronomy and Computing, 13, 12
2015
-
[27]
2019, Computational Astrophysics and Cosmology, 6, 2
Nelson, D., Springel, V ., Pillepich, A., et al. 2019, Computational Astrophysics and Cosmology, 6, 2
2019
-
[28]
S., & Levine, S
Noordermeer, E., Sparke, L. S., & Levine, S. E. 2001, Monthly Notices of the Royal Astronomical Society, 328, 1064
2001
-
[29]
2018, MNRAS, 473, 4077
Pillepich, A., Springel, V ., Nelson, D., et al. 2018, MNRAS, 473, 4077
2018
-
[30]
A., Heckman, T
Reichard, T. A., Heckman, T. M., Rudnick, G., Brinchmann, J., & Kau ffmann, G. 2008, The Astrophysical Journal, 677, 186
2008
-
[31]
Richter, O. G. & Sancisi, R. 1994, A&A, 290, L9
1994
-
[32]
& Zaritsky, D
Rix, H.-W. & Zaritsky, D. 1995, ApJ, 447, 82
1995
-
[33]
Saha, K., Combes, F., & Jog, C. J. 2007, MNRAS, 382, 419
2007
-
[34]
2015, MNRAS, 452, 575
Sijacki, D., V ogelsberger, M., Genel, S., et al. 2015, MNRAS, 452, 575
2015
-
[35]
2010, MNRAS, 401, 791
Springel, V . 2010, MNRAS, 401, 791
2010
-
[36]
A., Schoenmakers, R
Swaters, R. A., Schoenmakers, R. H. M., Sancisi, R., & van Albada, T. S. 1999, MNRAS, 304, 330
1999
-
[37]
A., Tissera, P
Varela-Lavin, S., Gómez, F. A., Tissera, P. B., et al. 2023, MNRAS, 523, 5853 V ogelsberger, M., Genel, S., Springel, V ., et al. 2014, Nature, 509, 177
2023
-
[38]
R., Mihos, J
Walker, I. R., Mihos, J. C., & Hernquist, L. 1996, ApJ, 460, 121
1996
-
[39]
Weinberg, M. D. 1995, The Astrophysical Journal, 455, L31
1995
-
[40]
2017, MNRAS, 465, 3291
Weinberger, R., Springel, V ., Hernquist, L., et al. 2017, MNRAS, 465, 3291
2017
-
[41]
Wilcots, E. M. 2010, in Astronomical Society of the Pacific Conference Se- ries, V ol. 421, Galaxies in Isolation: Exploring Nature Versus Nurture, ed. L. Verdes-Montenegro, A. Del Olmo, & J. Sulentic, 149
2010
-
[42]
& Rix, H.-W
Zaritsky, D. & Rix, H.-W. 1997, The Astrophysical Journal, 477, 118 Article number, page 15 of 15
1997
Reviewed August 12, 2026 · model on record in the stance chip above.
Discussion (0). Continue with ORCID to comment.