REVIEW 4 major objections 5 minor 40 references
Observed Steep and Shallow Spectra, Narrow and Broadband Spectra, Multi-frequency Simultaneous Spectra, and Statistical Fringe Spectra in Fast Radio Bursts: Various Faces of Intrinsic Quasi-periodic Spectra?
T0 review · 4 major / 5 minor · reviewed 2026-08-12 · deepseek-v4-flash
Pith's one-line read FRB spectra, whether steep or shallow, narrow or broadband, simultaneous at two frequencies or statistically fringed, may all be views of one intrinsically quasi-periodic spectrum produced by coherent curvature radiation from…
desk verdict A plausible but not yet convincing unification of FRB spectral phenomena; the fringe simulation's support is weaker than it looks. read the letter →
The pith
A machine-rendered reading of the paper's core claim, the machinery that carries it, and where it could break.
The reading
What carries the argument
The load-bearing object is the quasi-periodic structured bunch: $N_b$ electron–positron pair clumps (each pair separated by distance $\Delta$) spaced with period $P_m = 1/\omega_m$ and moving along the same curved trajectory with curvature radius $\rho$, Lorentz factor $\gamma$, and characteristic curvature frequency $\omega_c = 3c\gamma^3/(2\rho)$. Coherent curvature radiation from this configuration has power spectrum $$ \frac{dI_{\rm tot}}{d\omega d\$\Omega$} = 2N\left(1-\cos\frac{\omega\$\Delta$}{c}\right)|E_1(\omega)|^2 \frac{\$sin^{2}$(N_b\omega/2\omega_m)}{\$sin^{2}$(\omega/2\omega_m)}, $$ where $N = N_c N_p^2$ and $|E_1(\omega)|^2$ is the single-charge curvature spectrum. The multi-bunch coherence factor $\sin^2(N_b\omega/2\omega_m)/\sin^2(\omega/2\omega_m)$ is what creates the harmonic comb at $\omega = 2n\pi\omega_m$, and $N_b$ sets the slenderness of each peak; the separation $\Delta$ between the electron and positron clumps supplies the rising slope of the comb envelope. This single identity carries the argument for all four observed spectral phenomena.
What would settle it
Take a single bright burst and observe it simultaneously across a continuous band wide enough to cover at least two predicted comb peaks—for the parameters favored here, that means roughly 1.0–2.5 GHz with $\omega_m \approx 1.7\times10^9$ rad s$^{-1}$. If the spectrum shows only one smooth peak with no second maximum at roughly 2 times the first peak frequency, that burst does not have the quasi-periodic comb, and the model's claim that all FRB spectral features are faces of such combs would be contradicted.
Extended reading notes
Core claim
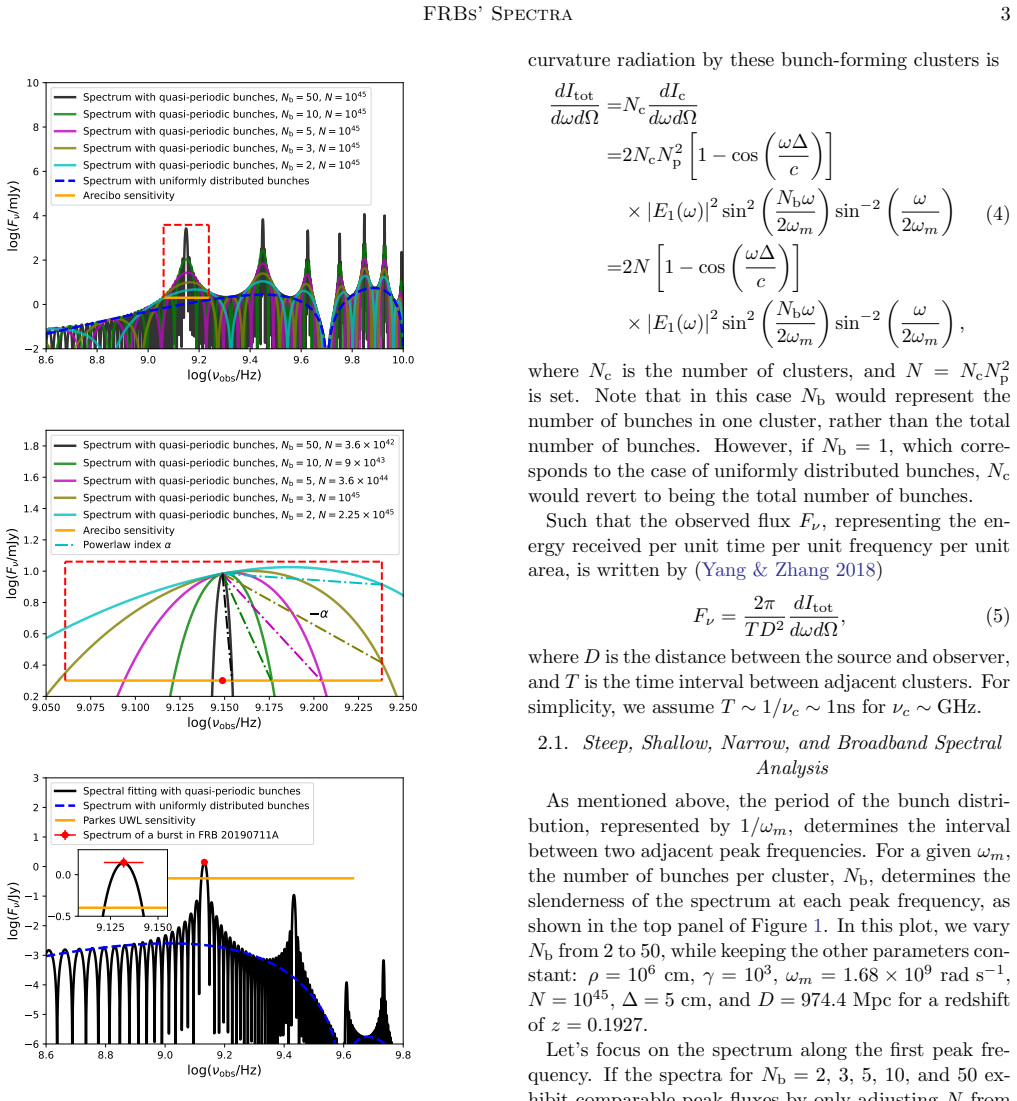
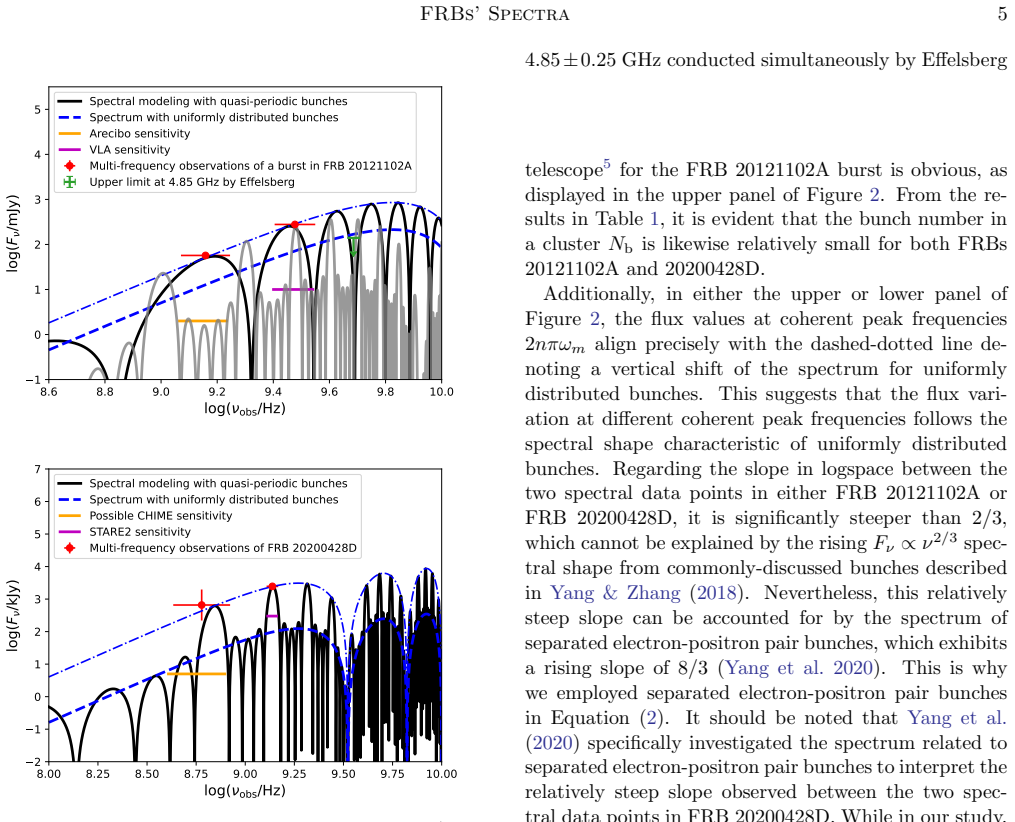
On this model, the intrinsic spectrum of an FRB is a comb of narrow peaks at angular frequencies $\omega = 2n\pi \omega_m$ in the source frame, set by the period $P_m = 1/\omega_m$ of the quasi-periodic bunch distribution, with the width of each peak controlled by $N_b$, the number of bunches per cluster. Small $N_b$ (about 2–5) produces peaks broad enough that a telescope sees a smooth, broadband, shallow spectrum—matching the majority of FRB bursts—while large $N_b$ yields narrow, steep peaks; the extreme narrow band of FRB 20190711A is fit with $N_b = 25$. The model fits the multi-frequency simultaneous spectra of a burst in FRB 20121102A (Arecibo at 1.4 GHz and VLA at 3 GHz, with an Effelsberg non-detection at 4.85 GHz) and of FRB 20200428D (STARE2 and CHIME) as different harmonics of the same comb, and the flux ratio between harmonics follows the spectrum of separated electron–positron pair bunches, which gives the steep rising slope of $8/3$ between the two bands. Monte Carlo simulations reproduce the observed fringe patterns in the peak-frequency distributions of FRB 20121102A and FRB 20190520B when $\omega_m$ follows a narrow Gaussian with dispersion $\sigma_s \approx 0.05\times10^9$ and $0.14\times10^9$ rad s$^{-1}$, respectively. The paper concludes that the observed steep and shallow spectra, narrow and broadband spectra, multi-frequency simultaneous spectra, and statistical fringe spectra are all various manifestations of the intrinsic quasi-periodic spectra.
Load-bearing premise
The central premise is that within a single FRB source, the bunch period $\omega_m$ is nearly universal, varying only through a small Gaussian spread; the statistical fringe patterns would wash out if different bursts had substantially different $\omega_m$ values, and the paper itself needs a second $\omega_m$ to explain the VLA-only bursts of FRB 20121102A.
Editorial extensions
If this is right
- FRB spectral index and bandwidth become functions of a single parameter, $N_b$: sources that usually emit broadband, shallow bursts should rarely produce extremely narrow ones, and the anticorrelation between spectral index and bandwidth is a direct prediction.
- A burst detected simultaneously in two well-separated bands should show fluxes matching two harmonics of one comb; the slope between bands should fall on the comb-envelope spectrum (rising like $\nu^{8/3}$ for separated pair bunches), not on an arbitrary power law.
- The quasi-universal $\omega_m$ inferred for FRB 20121102A ($1.68\times10^9$ rad s$^{-1}$) and FRB 20190520B ($2.0\times10^9$ rad s$^{-1}$), if produced by pair cascades in a charge-starvation region, implies surface magnetic fields near $10^{17}$ G for a spin period of about 1 s, supporting a magnetar interpretation.
- If the bunches instead arise from a two-stream instability, $\omega_m$ equals the Langmuir-wave frequency at the breakdown of the linear regime, giving a direct measurement of the local plasma conditions in the emission region.
Reading between the lines
- A cleaner test than peak-frequency catalogs is to stack many bursts from one repeater in frequency space: the model predicts a stable harmonic comb at $\nu = n\omega_m/2\pi$ across bursts, which a blind period search on summed spectra could reveal even with marginal per-burst detections.
- The near-universality of $\omega_m$ within a source could reflect the local plasma frequency near the emission altitude rather than global stellar parameters; if so, the derived magnetar field strengths would be upper limits, and a measurement of $\omega_m$ for different sub-bursts or epochs would separate the two possibilities.
- The same comb mechanism may apply beyond FRBs—the authors mention the Crab pulsar's zebra-pattern interpulse as a candidate—so searching for harmonic combs in other coherent radio emitters would be a direct extension of the model's scope.
Editorial analysis
A structured set of objections, weighed in public.
Referee Report
Summary. The paper proposes that the diverse observed spectral properties of fast radio bursts (FRBs)—steep and shallow spectra, narrow and broadband spectra, multi-frequency simultaneous spectra, and statistical fringe patterns in peak-frequency distributions—can all be understood as manifestations of an intrinsically quasi-periodic spectrum produced by coherent curvature radiation from quasi-periodic structured bunches composed of separated electron and positron clumps. Section 2.1 uses the number of bunches per cluster, Nb, to control spectral slenderness and fits the narrow-banded burst of FRB 20190711A; Section 2.2 models the multi-frequency simultaneous spectra of FRB 20121102A and FRB 20200428D; Section 2.3 performs Monte Carlo simulations to reproduce the observed peak-frequency fringe distributions of FRBs 20121102A and 20190520B under the assumption that the bunch-distribution period ωm is quasi-universal within a given source. The paper concludes that these observed spectral features may be various faces of intrinsic quasi-periodic spectra, and it discusses possible formation mechanisms for the structured bunches.
Significance. If established, the model would offer a single physical framework connecting the observed spectral morphology of FRBs to the bunch structure in their emission regions, and it would link the inferred bunch periods to pair-cascade or two-stream-instability timescales. The paper has concrete strengths: the spectral formulas in Eqs. (1)–(5) are explicit, the Monte Carlo procedure in Section 2.3 is described step by step, and the FRB 20190711A narrow-band case study is a falsifiable application of the model. However, the quantitative support for the central claim is currently limited: only one of the two fringe simulations passes a Kolmogorov–Smirnov test, the multi-frequency fits rely on sparse data and a guessed sensitivity, and the key quasi-universality assumption is not independently motivated. The significance of the paper will depend on whether the ωm universality can be justified or tested, and on whether the FRB 20121102A fringe failure can be addressed rather than excused post hoc.
major comments (4)
- [Section 2.3, Eq. (7)] The Monte Carlo reproduction of the statistical fringe patterns rests on the assumption that ωm for bursts in a given FRB follows a single Gaussian distribution with a small spread σs. This premise is what allows randomly chosen harmonic integers n ∈ I(1,10) to stack into a stable harmonic comb. The paper provides no independent physical argument for this quasi-universality; the fitted σs values are inferred from the same data the model is claimed to explain. Moreover, Section 3 explicitly invokes a second ωm,c = 1.2×10^9 rad/s for FRB 20121102A to explain VLA-only bursts, which is inconsistent with the single-Gaussian ωm assumption used in the fringe simulation. The fringe-spectra result therefore rests on an unverified premise that is, for at least one source, contradicted by the authors' own modeling.
- [Section 2.3.1 and Table 1] For FRB 20121102A, the best-fitting simulation yields pKS < 10^-2, meaning the model does not statistically reproduce the observed peak-frequency distribution. The statement that the main peaks align is not a quantitative substitute for passing the KS test. The attributed sample incompleteness, the 2–5 GHz gap, and other observational selection effects are plausible, but they are not incorporated into the test. Since this source is one of only two used to demonstrate the statistical fringe result, the evidence for the central claim reduces to one good realization (pKS = 0.8 for FRB 20190520B) and one quantitative failure.
- [Section 2.2 and Figure 2] The multi-frequency simultaneous-spectrum fit for FRB 20200428D uses a CHIME sensitivity that the authors state was 'picked' from CHIME/FRB non-detections of high-energy bursts from SGR 1935+2154, an approach they acknowledge is not rigorous. Because the visibility of model peaks above the sensitivity threshold is central to judging the fit in the lower panel of Figure 2, the agreement shown there cannot be evaluated quantitatively. The fit for FRB 20121102A also relies on a single detected burst with two flux measurements and an upper limit. The parameter values in Table 1 are therefore not tightly constrained by the data, weakening the multi-frequency simultaneous-spectra pillar of the paper.
- [Section 2.3, MC priors and circularity] The Monte Carlo priors for ωm,c, σs, Nb, N, and Δ are stated in Section 2.3 to be based on the fits in Sections 2.1 and 2.2. Combined with the fact that the simulated peak frequencies are generated from the same quasi-periodic formula, with coherent peaks at νp = nωm (Eqs. 1 and 4), the pKS = 0.8 result for FRB 20190520B is not an out-of-sample validation. It is a consistency check of whether a model with parameters in the fitted range can produce a peak-frequency distribution similar to the observed one. The result is encouraging, but the paper should describe it as such and avoid the summary claim that the model has been 'demonstrated' to explain the observed spectral phenomena.
minor comments (5)
- [Title and header] The title and running header contain 'F ringe' with an erroneous space; it should read 'Fringe'.
- [Section 2.3, Eq. (7)] The text after Eq. (7) says 'standard derivation'; this should be 'standard deviation'.
- [Figure 1] The main text refers to a 'red dashed rectangle' along the first peak in the top panel, but this rectangle is not visible in the figure as rendered and is not described in the caption; please clarify or add it.
- [Section 2.2, Figure 2] The gray line in the upper panel of Figure 2 is described in the caption but not in the main text; the authors should describe its parameter values and purpose in the body of the paper.
- [Section 2.3, footnote 7] The relation νp = nωm is correct only if the factor 2π is explicitly tracked; please state that ν = ω/(2π) and show the derivation, since ωm is given in rad/s while νp is in Hz, to avoid confusion.
Circularity Check
No significant circularity: the spectral matches are explicit fits, and the one independent MC check (FRB 20190520B fringe simulation) reports pKS=0.8 against external data.
full rationale
The paper's central argument is explicitly conditional: it argues that if FRB spectra are intrinsically quasi-periodic, then several observed features can be seen as manifestations. The spectra in Figures 1 and 2 are produced by choosing the free parameters of the external radiation formula (Eq. 4, from Yang 2023 and Yang et al. 2020) to match the observed shapes, and the paper labels these as 'modeling' rather than independent prediction. Matching a model to data by adjusting parameters is ordinary fitting, not a circular reduction, because the parameters are free and the target quantities are not used to define the equations. The statistical fringe simulation in Section 2.3 also does not set the fringe spacing from the observed peaks by construction: for FRB 20190520B, parameters are drawn from broad uniform priors and the best set is selected by a K-S test against external peak-frequency data, giving pKS=0.8. The analogous run for FRB 20121102A gives pKS<0.01 and is openly reported. The main self-referential element is the statement that the MC priors for omega_m,c, sigma_s, Nb, N, and Delta are 'based on our results in Sections 2.1 and 2.2', and the citation of Xie et al. (2020) for the MC procedure; these affect the search range for FRB 20121102A but do not make the final values equal to the data by construction. No equation is defined in terms of the quantity it claims to predict, and no fitted parameter is renamed as an independent prediction. The assumption of quasi-universal omega_m in Eq. (7) is a stated premise, not a conclusion derived from itself; the paper even discusses a second omega_m,c for FRB 20121102A, which weakens the premise but does not make the derivation circular.
Assumptions & free parameters
free parameters (8)
- omega_m (bunch distribution period) =
1.67e9, 0.69e9, 1.68e9, 2.0e9 rad/s (per source)
- Nb (bunches per cluster) =
2, 5, 25, 4 +/- 1, 4 +/- 2
- gamma (Lorentz factor) =
214, 1e3, 1e2, 214 +/- 15, (4.9 +/- 2.2)e3
- rho (curvature radius) =
log10(rho/cm) = 6.5, 6, 7, 6.5 +/- 0.1, 6.2 +/- 0.7
- N = Nc Np^2 (normalization) =
log10 N = 46.45, 42.85, 46.5 +/- 1.4, 45.8 +/- 0.9
- Delta (clump separation) =
2, 9, 5, 3.5 +/- 0.5, 2.0 +/- 1.5 cm
- sigma_s (Gaussian width of omega_m) =
0.05e9, 0.14e9 rad/s
- n (harmonic integer) =
not reported; chosen per observed frequency
assumptions (8)
- domain assumption Curvature radiation spectrum of a single charge follows Eq. 3, |E1(omega)|^2, from Yang & Zhang 2018
- domain assumption The emitting bunch is a separated electron-positron pair with clump separation Delta, giving the (1 - cos(omega*Delta/c)) factor in Eq. 2 (Yang et al. 2020)
- domain assumption Bunches are strictly periodically distributed and form coherent clusters so the total spectrum is Eq. 4 (based on Yang 2023)
- domain assumption Observed flux is related to intrinsic power via Eq. 5 with T ~ 1/nu_c ~ 1 ns
- ad hoc to paper omega_m values across bursts in one FRB follow a Gaussian distribution (Eq. 7)
- ad hoc to paper The harmonic number n for each burst is an integer drawn uniformly from I(1,10) and the detection condition is Fmin < Fnu < 1e5 Fmin
- ad hoc to paper MC priors for omega_m,c, sigma_s, Nb, N, and Delta are based on the paper's own earlier results
- domain assumption The bunch period corresponds to the pair cascade period (Eq. 8) or the Langmuir wavelength (Eq. 9)
invented entities (1)
-
Coherent clusters of bunches
Cite this review
Pith. "Pith review of Observed Steep and Shallow Spectra, Narrow and Broadband Spectra, Multi-frequency Simultaneous Spectra, and Statistical Fringe Spectra in Fast Radio Bursts: Various Faces of Intrinsic Quasi-periodic Spectra?." pith.science (2026). https://pith.science/paper/KIAHHCRU
@misc{pith2026241200321,
  author       = {Pith},
  title        = {Pith review of: Observed Steep and Shallow Spectra, Narrow and Broadband Spectra, Multi-frequency Simultaneous Spectra, and Statistical Fringe Spectra in Fast Radio Bursts: Various Faces of Intrinsic Quasi-periodic Spectra?},
  year         = {2026},
  howpublished = {\url{https://pith.science/paper/KIAHHCRU}},
  note         = {Machine review of arXiv:2412.00321}
}
read the original abstract
In this paper, through analysis, modelings, and simulations, we show that if the spectra of fast radio bursts (FRBs) are intrinsically quasi-periodic spectra, likely produced by coherent curvature radiation from quasi-periodic structured bunches, then the observed steep and shallow spectra, narrow and broadband spectra, multi-frequency simultaneous spectra, as well as possible statistical fringe spectra in FRBs, could all be various manifestations of these intrinsically quasi-periodic spectra. If so, the period properties of the structured bunches, as inferred from the observed multi-frequency simultaneous spectra and potential statistical fringe spectra, may provide valuable insights into the mechanisms behind the formation of such structured bunches.
Figures

Reference graph
Works this paper leans on
-
[1]
2023, Science, 380, 599, doi: 10.1126/science.abo6526
Anna-Thomas, R., Connor, L., Dai, S., et al. 2023, Science, 380, 599, doi: 10.1126/science.abo6526
-
[2]
Bochenek, C. D., Ravi, V., Belov, K. V., et al. 2020, Nature, 587, 59, doi: 10.1038/s41586-020-2872-x
-
[3]
Chawla, P., Andersen, B. C., Bhardwaj, M., et al. 2020, ApJL, 896, L41, doi: 10.3847/2041-8213/ab96bf CHIME/FRB Collaboration, Andersen, B. C., Bandura, K. M., et al. 2020, Nature, 587, 54, doi: 10.1038/s41586-020-2863-y CHIME/FRB Collaboration, Amiri, M., Andersen, B. C., et al. 2021, ApJS, 257, 59, doi: 10.3847/1538-4365/ac33ab
-
[4]
Cordes, J. M., & Chatterjee, S. 2019, ARA&A, 57, 417, doi: 10.1146/annurev-astro-091918-104501
-
[5]
Dai, S., Feng, Y., Yang, Y. P., et al. 2022, arXiv e-prints, arXiv:2203.08151, doi: 10.48550/arXiv.2203.08151
-
[6]
Eilek, J. A., & Hankins, T. H. 2016, Journal of Plasma Physics, 82, 635820302, doi: 10.1017/S002237781600043X
-
[7]
2022, Science, 375, 1266, doi: 10.1126/science.abl7759
Feng, Y., Li, D., Yang, Y.-P., et al. 2022, Science, 375, 1266, doi: 10.1126/science.abl7759
-
[8]
Gajjar, V., Siemion, A. P. V., Price, D. C., et al. 2018, ApJ, 863, 2, doi: 10.3847/1538-4357/aad005 FRBs’ Spectra 9
Show all 40 references
- [9]
- [10]
-
[11]
H., Eilek, J
Hankins, T. H., Eilek, J. A., & Jones, G. 2016, ApJ, 833, 47, doi: 10.3847/1538-4357/833/1/47
2016 doi
-
[12]
M., Snelders, M
Hewitt, D. M., Snelders, M. P., Hessels, J. W. T., et al. 2022, MNRAS, 515, 3577, doi: 10.1093/mnras/stac1960
2022 doi
-
[13]
N., Spitler, L
Jahns, J. N., Spitler, L. G., Nimmo, K., et al. 2023, MNRAS, 519, 666, doi: 10.1093/mnras/stac3446
2023 doi
- [14]
-
[15]
2017, MNRAS, 468, 2726, doi: 10.1093/mnras/stx665
Kumar, P., Lu, W., & Bhattacharya, M. 2017, MNRAS, 468, 2726, doi: 10.1093/mnras/stx665
2017 doi
-
[16]
M., Flynn, C., et al
Kumar, P., Shannon, R. M., Flynn, C., et al. 2021, MNRAS, 500, 2525, doi: 10.1093/mnras/staa3436
2021 doi
-
[17]
J., Abruzzo, M
Law, C. J., Abruzzo, M. W., Bassa, C. G., et al. 2017, ApJ, 850, 76, doi: 10.3847/1538-4357/aa9700
2017 doi
-
[18]
2023, ApJ, 958, 35, doi: 10.3847/1538-4357/acf9a3
Liu, Z.-N., Geng, J.-J., Yang, Y.-P., Wang, W.-Y., & Dai, Z.-G. 2023, ApJ, 958, 35, doi: 10.3847/1538-4357/acf9a3
2023 doi
-
[19]
2022, ApJ, 941, 127, doi: 10.3847/1538-4357/aca297
Lyu, F., Cheng, J.-G., Liang, E.-W., et al. 2022, ApJ, 941, 127, doi: 10.3847/1538-4357/aca297
2022 doi
-
[20]
2023, MNRAS, 522, 5600, doi: 10.1093/mnras/stad1271
Lyu, F., & Liang, E.-W. 2023, MNRAS, 522, 5600, doi: 10.1093/mnras/stad1271
2023 doi
-
[21]
P., Shannon, R
Macquart, J. P., Shannon, R. M., Bannister, K. W., et al. 2019, ApJL, 872, L19, doi: 10.3847/2041-8213/ab03d6
2019 doi
-
[22]
2015, Nature, 528, 523, doi: 10.1038/nature15769
Masui, K., Lin, H.-H., Sievers, J., et al. 2015, Nature, 528, 523, doi: 10.1038/nature15769
2015 doi
- [23]
-
[24]
H., Aggarwal, K., Li, D., et al
Niu, C. H., Aggarwal, K., Li, D., et al. 2022, Nature, 606, 873, doi: 10.1038/s41586-022-04755-5
2022 doi
- [25]
-
[26]
Petroff, E., Hessels, J. W. T., & Lorimer, D. R. 2019, A&A Rv, 27, 4, doi: 10.1007/s00159-019-0116-6
2019 doi
-
[27]
C., Kaspi, V
Pleunis, Z., Good, D. C., Kaspi, V. M., et al. 2021, ApJ, 923, 1, doi: 10.3847/1538-4357/ac33ac
2021 doi
-
[28]
G., Scholz, P., Hessels, J
Spitler, L. G., Scholz, P., Hessels, J. W. T., et al. 2016, Nature, 531, 202, doi: 10.1038/nature17168
2016 doi
-
[29]
N., & Harding, A
Timokhin, A. N., & Harding, A. K. 2015, ApJ, 810, 144, doi: 10.1088/0004-637X/810/2/144
2015 doi
-
[30]
2024, A&A, 685, A87, doi: 10.1051/0004-6361/202348670
Wang, W.-Y., Yang, Y.-P., Li, H.-B., Liu, J., & Xu, R. 2024, A&A, 685, A87, doi: 10.1051/0004-6361/202348670
2024 doi
-
[31]
2021, Science China Physics, Mechanics, and Astronomy, 64, 249501, doi: 10.1007/s11433-020-1661-7
Xiao, D., Wang, F., & Dai, Z. 2021, Science China Physics, Mechanics, and Astronomy, 64, 249501, doi: 10.1007/s11433-020-1661-7
2021 doi
-
[32]
2020, ApJ, 894, 52, doi: 10.3847/1538-4357/ab8302
Xie, W.-J., Zou, L., Liu, H.-B., Wang, S.-Q., & Liang, E.-W. 2020, ApJ, 894, 52, doi: 10.3847/1538-4357/ab8302
2020 doi
-
[33]
2023, ApJ, 956, 67, doi: 10.3847/1538-4357/acebc6
Yang, Y.-P. 2023, ApJ, 956, 67, doi: 10.3847/1538-4357/acebc6
2023 doi
-
[34]
2018, ApJ, 868, 31, doi: 10.3847/1538-4357/aae685
Yang, Y.-P., & Zhang, B. 2018, ApJ, 868, 31, doi: 10.3847/1538-4357/aae685
2018 doi
-
[35]
2020, ApJL, 901, L13, doi: 10.3847/2041-8213/abb535
Yang, Y.-P., Zhu, J.-P., Zhang, B., & Wu, X.-F. 2020, ApJL, 901, L13, doi: 10.3847/2041-8213/abb535
2020 doi
-
[36]
2023, Reviews of Modern Physics, 95, 035005, doi: 10.1103/RevModPhys.95.035005
Zhang, B. 2023, Reviews of Modern Physics, 95, 035005, doi: 10.1103/RevModPhys.95.035005
2023 doi
-
[37]
G., Gajjar, V., Foster, G., et al
Zhang, Y. G., Gajjar, V., Foster, G., et al. 2018, ApJ, 866, 149, doi: 10.3847/1538-4357/aadf31
2018 doi
-
[38]
2023, ApJ, 955, 142, doi: 10.3847/1538-4357/aced0b
Zhang, Y.-K., Li, D., Zhang, B., et al. 2023, ApJ, 955, 142, doi: 10.3847/1538-4357/aced0b
2023 doi
-
[39]
2022, ApJ, 926, 206, doi: 10.3847/1538-4357/ac4d98
Zhong, S.-Q., Xie, W.-J., Deng, C.-M., et al. 2022, ApJ, 926, 206, doi: 10.3847/1538-4357/ac4d98
2022 doi
-
[40]
J., Han, J
Zhou, D. J., Han, J. L., Zhang, B., et al. 2022, Research in Astronomy and Astrophysics, 22, 124001, doi: 10.1088/1674-4527/ac98f8
2022 doi
Reviewed August 12, 2026 · model on record in the stance chip above.
Discussion (0). Continue with ORCID to comment.