REVIEW 4 major objections 6 minor 53 references
Robust detection of hot intragroup medium in optically selected, poor galaxy groups by eROSITA
T0 review · 4 major / 6 minor · reviewed 2026-08-12 · deepseek-v4-flash
Pith's one-line read Stacked eROSITA images detect hot gas in 25,524 poor galaxy groups
desk verdict A useful stacking measurement of hot intragroup gas in poor groups, but the significance is overstated and the CGM control needs strengthening. read the letter →
The pith
A machine-rendered reading of the paper's core claim, the machinery that carries it, and where it could break.
The reading
What carries the argument
The machinery is a stacking analysis of exposure-corrected eFEDS images in the 0.2–2.3 keV band, with previously detected X-ray sources masked. Individual group images are rescaled to a common angular size and summed; background is estimated from an annulus at 800–1000 kpc. The stacked surface brightness profiles are fitted with the standard $\beta$-model $I(r) = I_0 (1 + r^2/r_c^2)^{-3\beta + 1/2}$, and the S/N is computed as $(N_s - N_b)/\sqrt{N_s}$. A control sample built from isolated galaxies, stacked in the same way, yields no signal above $2\sigma$, supporting the interpretation that the excess is intragroup gas rather than circumgalactic medium.
What would settle it
Re-stack a subset of the same groups using a robust center estimate, for example the brightest member galaxy or an iterative centroid, and compare the surface brightness profile; if the extended excess disappears or becomes consistent with the point-spread function, the intragroup-medium interpretation would be refuted. Alternatively, simulate mock groups with realistic miscentering distributions and show whether the observed stacked profile can be reproduced without any hot gas.
Extended reading notes
Core claim
The central discovery is a robust detection of the hot intragroup medium in a large, optically selected sample of poor groups, obtained by stacking X-ray images from the eROSITA Final Equatorial Depth Survey. For most of the sixteen subsamples defined by halo mass and redshift, the stacked emission exceeds the background with high significance and extends well beyond the eROSITA point-spread function, ruling out a purely point-source origin. The authors quantify the mean X-ray luminosity (roughly $10^{40}$ to $10^{42}$ erg s$^{-1}$), gas mass, and gas fraction, and report that the baryon fraction within $r_{500}$ is about 8% of the cosmic mean, so the 'missing baryons' problem persists in these systems.
Load-bearing premise
The analysis assumes that the luminosity-weighted group centers from the DESI LS catalog are accurate to well within the virial radius; with only 2–4 member galaxies per group, uncorrected miscentering could broaden the stacked profile and mimic an extended intragroup medium.
Editorial extensions
If this is right
- Hot intragroup gas is ubiquitous in poor groups down to halo masses near $10^{11.5}\,M_{\odot}$, not just in X-ray-bright clusters.
- The mean gas fraction of about 6% within $r_{180}$ provides a direct benchmark for simulations of galaxy group formation and feedback.
- Because the baryon fraction remains near half the cosmic mean, the missing baryons in poor groups must reside at larger radii or in a cooler phase.
- The detected luminosity–mass trend, if confirmed, gives a low-mass anchor for scaling relations that currently rely on cluster data.
- Future surveys with deeper exposure or better resolution could detect individual poor groups, turning the stacked result into a population census.
Reading between the lines
- If miscentering is as large as feared, the true intragroup gas could be more centrally concentrated than the fitted $\beta$-model suggests; correcting for centering errors would sharpen the profile and may raise the inferred central density.
- The same stacking pipeline applied to eRASS1 data, which covers a much larger area, could split the sample into finer mass and redshift bins and test whether the apparent lack of redshift evolution is real.
- The method transfers directly to other optically selected catalogs, such as those from DES or LSST, potentially extending the measurement to even lower halo masses where the gas fraction may behave differently.
- A direct comparison with mock observations from hydrodynamical simulations, including the same group-finder and centering choices, would test whether the measured baryon fraction is consistent with feedback models.
Signed reviews
Editorial analysis
A structured set of objections, weighed in public.
Referee Report
Summary. The paper stacks eFEDS 0.2-2.3 keV X-ray images of 25,524 optically selected poor galaxy groups from the Yang et al. (2021) DESI LS catalog, split into 16 halo-mass and redshift subsamples. It reports significant central excess emission in 12 of 16 subsamples, with quoted significances of 3.9-12 sigma, fits beta models to the stacked surface brightness profiles, converts the counts into rest-frame 0.5-2.0 keV luminosities and gas masses using APEC models with adopted T-M and Z-M relations, and derives baryon fractions of roughly 8% within r500, concluding that hot intragroup gas is ubiquitous in poor groups but insufficient to close the missing-baryons budget. A control sample built from isolated galaxies is used to argue that the CGM of member galaxies is not a significant contaminant.
Significance. If correct, this would be the first robust, large-sample stacked detection of hot intragroup gas in poor groups with halo masses near 10^13 solar masses, with direct relevance to the missing-baryons problem. The paper makes good use of public data and standard tools: it compares the stacked profile with the eROSITA PSF, uses jackknife resampling for stacking uncertainties, checks temperature and metallicity assumptions, and explicitly estimates unresolved point-source contamination. The main claims, however, rest on two points that need substantial strengthening: the control sample does not actually rule out emission from the real member galaxies, and the quoted detection significances are not computed with a well-justified statistical procedure. Both issues are fixable with additional tests and revised statistics, so the underlying detection remains plausible but is not yet established as robust.
major comments (4)
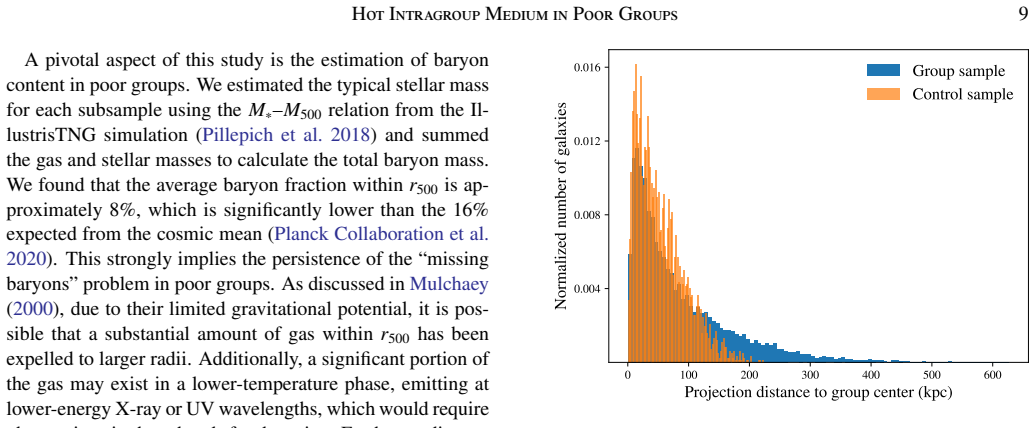
- [§4.4] The control sample does not rule out the dominant astrophysical confounder. Mock groups assembled from isolated galaxies are not representative of real group members: isolated galaxies in the Yang et al. (2021) catalog can differ systematically in stellar mass, star formation rate, X-ray binary content, AGN occupation, and CGM properties from galaxies living in poor groups, and the paper does not show that the two populations are matched in these properties. Matching the projected galaxy-to-center distance distribution (Fig. 6) only matches the geometric broadening, not the X-ray emissivity per galaxy. The statement in §4.4 that 'any emission detected ... is likely to originate from individual galaxies' is therefore not established. A stronger test would be to scramble the membership of the real galaxy groups, preserving the actual member galaxies and their radial distribution, and stack the scrambled groups; alternatively, stack the real member galaxies at their positions and subtract a group-scale model. Without such a test, the 'robust detection' claim is not fully secured.
- [§3.1, Eq. (1)] The detection significance is not computed with a standard or well-justified procedure. The formula S/N = (Ns - Nb)/sqrt(Ns) omits the uncertainty in the background estimate: if Ns and Nb are both measured counts, the variance of the difference is approximately Ns + Nb, and if Nb is treated as known, the null variance is Nb, not Ns. In either case the denominator in Eq. (1) is smaller than the appropriate uncertainty and the quoted significances are likely optimistic. In addition, the S/N is maximized over the source aperture radius, and Table 1 reports the maximum value without any trials correction; with 16 subsamples and a range of radii, a 3.9-sigma maximum can correspond to a substantially lower effective significance. The abstract's '3.9-sigma to 12-sigma' claim should be recomputed with a fixed aperture or with an explicit trials factor, and the choice should be stated.
- [§3.2, Fig. 3, Table 1] There is an internal inconsistency in the radius used for the derived quantities. Section 3.2 and Figure 3 state that the luminosity, gas mass, and gas fraction are computed within r180, while the Table 1 notes and Section 4.1.3 quote values within r500. Since the beta model is first integrated to r180 and then converted to r500 using an assumed NFW concentration, the reader cannot tell which values are shown in Table 1 and Figure 3. This matters for the baryon-fraction comparison: the abstract and Section 4.1.3 report about 8% within r500, while the Figure 3 panel is labeled 'within r180'. Please state one convention and propagate it consistently through the text, table, and figures, or give both radii explicitly.
- [§2.1, §3.2] The stacked-profile analysis assumes the luminosity-weighted group centers are accurate. For groups with only 2-4 member galaxies, centering errors of tens to hundreds of kpc are plausible, and such errors convolve the true surface brightness profile with the centering-error distribution. This can broaden the stacked profile and make even a compact or point-source signal appear extended relative to the PSF. The paper does not quantify the centering-error distribution or test the sensitivity of the beta-model parameters and the 'extended beyond PSF' claim to the adopted center definition (e.g., using the brightest group galaxy instead of the luminosity-weighted center). I request an explicit miscentering analysis, or a quantitative argument for why the effect is negligible for this sample.
minor comments (6)
- [Abstract] The sentence 'despite its presence in virtually groups at all sizes' appears to be missing a word; please revise to 'despite its presence in virtually all groups at all sizes' or similar.
- [§4.3] The contamination estimate relies on a uniform SFR of 5 solar masses per year and on stellar masses estimated from stellar-to-halo ratios for roughly 80% of the galaxies. The text tests the alternative SFR of 10 solar masses per year, but the systematic uncertainty from the missing stellar mass measurements should be propagated into fcont and, hence, into the baryon-fraction error budget.
- [Table 1] The highly asymmetric and sometimes formally negative lower bounds on L0.5-2.0 in Table 1 (e.g., 0.16^{+2.44}_{-0.15}) indicate that the beta-model parameters are poorly constrained in low-S/N bins; the paper should state this caveat explicitly when presenting the luminosity and gas-mass scaling behavior.
- [§4.1.3] When comparing with literature scaling relations, the text says 'we recalculated the halo mass and corresponding measurements from within the range of r180 to r500' but does not specify whether the red points in Fig. 4 are original r180 measurements converted to r500, literature values converted to r500, or both; please state the conversion explicitly.
- [§4.4] The control-sample section shows only two example stacked images (Fig. 5) and states that no signal is found above 2-sigma; please provide the S/N or upper limits for all 16 control subsamples, ideally in a table or appendix, so the reader can verify the claim.
- [§3.2, Eq. (5)] The quantity CR_eta in Eq. (5) is not defined in the text; please define it as the count-rate-to-normalization conversion factor and specify its units.
Circularity Check
No significant circularity: the stacked IGrM detection is measured directly from eFEDS images against an empirically determined background, with external catalogs and scaling relations; self-citations are comparisons or data products, not premises.
full rationale
The central claim—a 3.9–12σ stacked excess from 25,524 poor groups—is not derived from any fitted parameter or self-citation. It is computed directly from background-subtracted eFEDS images using Eq. (1), with the background measured in an 800–1000 kpc annulus (Section 2.2). The beta-model fit (Section 3.2) is used only to parametrize the detected profile, and the luminosity, gas mass, and baryon fraction follow from integrating that model with APEC emissivities and external T–M, Z–M, and M*–M relations (Sun et al. 2009; Truong et al. 2019; Pillepich et al. 2018). No equation reduces to another by construction: Eq. (1) is a significance statistic, and Eqs. (2)–(5) are standard profile and deprojection formulae applied to the measured stacked image. The authors' own prior work (Zheng et al. 2023) is cited for background and luminosity comparison, not as the source of the detection; Yang et al. (2021) is an independent public group catalog. The CGM control sample (Section 4.4) is an external test, and any question about whether isolated galaxies are representative of group members is a statistical or systematic concern, not circularity. Therefore no circular step is identifiable.
Assumptions & free parameters
free parameters (3)
- Beta model parameters (I0, rc, beta) per subsample =
Fitted per subsample; e.g., first bin Rc=4.59 kpc, beta=0.34
- Star formation rate for member galaxies =
5 Msun/yr (uniform)
- NFW concentration c180 =
6
assumptions (6)
- domain assumption The beta model (Cavaliere & Fusco-Femiano 1976) describes the stacked IGrM surface brightness profile.
- domain assumption Temperature and metallicity of the IGrM follow the Sun et al. (2009) T-M and Truong et al. (2019) Z-M relations extrapolated to T=0.08-0.48 keV and Z=0.47-0.65 Zsun.
- domain assumption Unresolved point-source contamination (XRBs and AGNs) is described by Aird et al. (2017) and Comparat et al. (2022) empirical models.
- domain assumption The group finder of Yang et al. (2021) provides accurate halo masses and luminosity-weighted centers for poor groups.
- domain assumption M*-M500 relation from IllustrisTNG (Pillepich et al. 2018) gives the stellar mass of poor group members.
- domain assumption The background is uniform and well described by the median count rate in the 800-1000 kpc annulus.
Cite this review
Pith. "Pith review of Robust detection of hot intragroup medium in optically selected, poor galaxy groups by eROSITA." pith.science (2026). https://pith.science/paper/IUBOFD6Q
@misc{pith2026241201261,
  author       = {Pith},
  title        = {Pith review of: Robust detection of hot intragroup medium in optically selected, poor galaxy groups by eROSITA},
  year         = {2026},
  howpublished = {\url{https://pith.science/paper/IUBOFD6Q}},
  note         = {Machine review of arXiv:2412.01261}
}
abstract
Over the last several decades, extensive research has been conducted on the baryon cycles within cosmic structures, encompassing a broad mass range from dwarf galaxies to galaxy clusters. However, a notable gap in understanding the cosmic baryon cycle is the poor galaxy groups with halo masses around $10^{13}\ M_{\odot}$ (e.g., McGaugh et al. 2010). Poor galaxy groups, like our own Local Group, are prevalent throughout the universe, yet robust detection of their hot, X-ray emitting intragroup medium (IGrM) has remained elusive. The presence of this hot IGrM is crucial for addressing the long-standing "missing baryons" problem. Previous ROSAT-based studies were limited by a small number of X-ray bright samples, thus restricting the scope of their findings. Here we show a robust detection of this hot IGrM in a large, optically selected poor groups sample, based on the stacked X-ray images from the eROSITA Final Equatorial Depth Survey. These groups are identified in DESI LS with a mass range of log($M_\mathrm{halo}/h^{-1}M_{\odot}$) = 11.5-13.5 and a redshift range of z = 0.1-0.5. Additionally, our results indicate that despite its presence in virtually groups at all sizes, this gas component is still not sufficient to recover the universal baryon fraction, and hence the "missing baryons" problem still persists in poor galaxy groups.
Figures


Figures from the paper (3 more)


Reference graph
Works this paper leans on
-
[1]
Aird, J., Coil, A. L., & Georgakakis, A. 2017, MNRAS, 465, 3390, doi: 10.1093/mnras/stw2932
-
[2]
Anderson, M. E., Gaspari, M., White, S. D. M., Wang, W., & Dai, X. 2015, MNRAS, 449, 3806, doi: 10.1093/mnras/stv437
-
[3]
2010, arXiv e-prints, arXiv:1009.2755, doi: 10.48550/arXiv.1009.2755
Andrae, R. 2010, arXiv e-prints, arXiv:1009.2755, doi: 10.48550/arXiv.1009.2755
-
[4]
2023, Science China Physics, Mechanics, and Astronomy, 66, 299513, doi: 10.1007/s11433-023-2149-y
Bregman, J., Cen, R., Chen, Y ., et al. 2023, Science China Physics, Mechanics, and Astronomy, 66, 299513, doi: 10.1007/s11433-023-2149-y
-
[5]
2022, A&A, 661, A1, doi: 10.1051/0004-6361/202141266
Brunner, H., Liu, T., Lamer, G., et al. 2022, A&A, 661, A1, doi: 10.1051/0004-6361/202141266
- [6]
-
[7]
Cen, R., & Ostriker, J. P. 2006, ApJ, 650, 560, doi: 10.1086/506505
doi:10.1086/506505 2006
-
[8]
Chadayammuri, U., Bogd´an, ´A., Oppenheimer, B. D., et al. 2022, ApJL, 936, L15, doi: 10.3847/2041-8213/ac8936
Show all 53 references
-
[9]
1988, MNRAS, 233, 637, doi: 10.1093/mnras/233.3.637
Cole, S., & Kaiser, N. 1988, MNRAS, 233, 637, doi: 10.1093/mnras/233.3.637
1988 doi
-
[10]
2022, A&A, 666, A156, doi: 10.1051/0004-6361/202243101
Comparat, J., Truong, N., Merloni, A., et al. 2022, A&A, 666, A156, doi: 10.1051/0004-6361/202243101
2022 doi
-
[11]
S., & Morgan, N
Dai, X., Kochanek, C. S., & Morgan, N. D. 2007, ApJ, 658, 917, doi: 10.1086/509651 Dav´e, R., Cen, R., Ostriker, J. P., et al. 2001, ApJ, 552, 473, doi: 10.1086/320548
2007 doi
-
[12]
J., Lang, D., et al
Dey, A., Schlegel, D. J., Lang, D., et al. 2019, AJ, 157, 168, doi: 10.3847/1538-3881/ab089d
2019 doi
-
[13]
R., Baugh, C
Eke, V . R., Baugh, C. M., Cole, S., et al. 2004, MNRAS, 348, 866, doi: 10.1111/j.1365-2966.2004.07408.x
2004
-
[14]
2007, ApJS, 172, 182, doi: 10.1086/516577
Finoguenov, A., Guzzo, L., Hasinger, G., et al. 2007, ApJS, 172, 182, doi: 10.1086/516577
2007 doi
-
[15]
J., & Peebles, P
Fukugita, M., Hogan, C. J., & Peebles, P. J. E. 1998, ApJ, 503, 518, doi: 10.1086/306025
1998 doi
-
[16]
D., Tripp, T
Ge, C., Wang, Q. D., Tripp, T. M., et al. 2016, MNRAS, 459, 366, doi: 10.1093/mnras/stw599
2016 doi
-
[17]
F., & Ponman, T
Helsdon, S. F., & Ponman, T. J. 2000, MNRAS, 315, 356, doi: 10.1046/j.1365-8711.2000.03396.x
2000
-
[18]
F., Ponman, T
Helsdon, S. F., Ponman, T. J., & Mulchaey, J. S. 2005, ApJ, 618, 679, doi: 10.1086/426009
2005 doi
-
[19]
2022, A&A, 661, A2, doi: 10.1051/0004-6361/202141120
Liu, A., Bulbul, E., Ghirardini, V ., et al. 2022, A&A, 661, A2, doi: 10.1051/0004-6361/202141120
2022 doi
-
[20]
H., & Schellenberger, G
Lovisari, L., Reiprich, T. H., & Schellenberger, G. 2015, A&A, 573, A118, doi: 10.1051/0004-6361/201423954
2015 doi
-
[21]
V ., Dutton, A
Macci`o, A. V ., Dutton, A. A., van den Bosch, F. C., et al. 2007, MNRAS, 378, 55, doi: 10.1111/j.1365-2966.2007.11720.x
2007
-
[22]
S., Schombert, J
McGaugh, S. S., Schombert, J. M., de Blok, W. J. G., & Zagursky, M. J. 2010, ApJL, 708, L14, doi: 10.1088/2041-8205/708/1/L14
2010 doi
- [23]
-
[24]
2020, Nature Astronomy, 4, 634, doi: 10.1038/s41550-020-1133-0
Merloni, A., Nandra, K., & Predehl, P. 2020, Nature Astronomy, 4, 634, doi: 10.1038/s41550-020-1133-0
2020 doi
-
[25]
2024, A&A, 682, A34, doi: 10.1051/0004-6361/202347165
Merloni, A., Lamer, G., Liu, T., et al. 2024, A&A, 682, A34, doi: 10.1051/0004-6361/202347165
2024 doi
-
[26]
J., Mathiesen, B., & Evrard, A
Mohr, J. J., Mathiesen, B., & Evrard, A. E. 1999, ApJ, 517, 627, doi: 10.1086/307227
1999 doi
-
[27]
Mulchaey, J. S. 2000, ARA&A, 38, 289, doi: 10.1146/annurev.astro.38.1.289
2000 doi
-
[28]
S., Davis, D
Mulchaey, J. S., Davis, D. S., Mushotzky, R. F., & Burstein, D. 1996, ApJ, 456, 80, doi: 10.1086/176629
1996 doi
-
[29]
S., & Zabludoff, A
Mulchaey, J. S., & Zabludoff, A. I. 1998, ApJ, 496, 73, doi: 10.1086/305356
1998 doi
- [30]
-
[31]
F., Frenk, C
Navarro, J. F., Frenk, C. S., & White, S. D. M. 1997, ApJ, 490, 493, doi: 10.1086/304888
1997 doi
-
[32]
2018, MNRAS, 475, 648, doi: 10.1093/mnras/stx3112 Planck Collaboration, Aghanim, N., Akrami, Y ., et al
Pillepich, A., Nelson, D., Hernquist, L., et al. 2018, MNRAS, 475, 648, doi: 10.1093/mnras/stx3112 Planck Collaboration, Aghanim, N., Akrami, Y ., et al. 2020, A&A, 641, A6, doi: 10.1051/0004-6361/201833910 12 L i et al
2018 doi
-
[33]
2023, MNRAS, 520, 6001, doi: 10.1093/mnras/stad514
Poon, H., Okabe, N., Fukazawa, Y ., Akino, D., & Yang, C. 2023, MNRAS, 520, 6001, doi: 10.1093/mnras/stad514
2023 doi
-
[34]
2024, MNRAS, 527, 895, doi: 10.1093/mnras/stad3253
Popesso, P., Biviano, A., Bulbul, E., et al. 2024, MNRAS, 527, 895, doi: 10.1093/mnras/stad3253
2024 doi
-
[35]
2021, A&A, 647, A1, doi: 10.1051/0004-6361/202039313
Predehl, P., Andritschke, R., Arefiev, V ., et al. 2021, A&A, 647, A1, doi: 10.1051/0004-6361/202039313
2021 doi
-
[36]
2006, MNRAS, 373, 653, doi: 10.1111/j.1365-2966.2006.11023.x
Raychaudhury, S. 2006, MNRAS, 373, 653, doi: 10.1111/j.1365-2966.2006.11023.x
2006
-
[37]
M., Charlot, S., et al
Salim, S., Rich, R. M., Charlot, S., et al. 2007, ApJS, 173, 267, doi: 10.1086/519218
2007 doi
-
[38]
Sanderson, A. J. R., Ponman, T. J., Finoguenov, A., Lloyd-Davies, E. J., & Markevitch, M. 2003, MNRAS, 340, 989, doi: 10.1046/j.1365-8711.2003.06401.x
2003
-
[39]
Sarazin, C. L. 1988, X-ray emission from clusters of galaxies, Cambridge Astrophysics Series (Cambridge: Cambridge Univ. Press)
1988
-
[40]
Schellenberger, G., & Reiprich, T. H. 2017, MNRAS, 469, 3738, doi: 10.1093/mnras/stx1022
2017 doi
-
[41]
M., Smith, B
Shull, J. M., Smith, B. D., & Danforth, C. W. 2012, ApJ, 759, 23, doi: 10.1088/0004-637X/759/1/23
2012 doi
-
[42]
2012, New Journal of Physics, 14, 045004, doi: 10.1088/1367-2630/14/4/045004
Sun, M. 2012, New Journal of Physics, 14, 045004, doi: 10.1088/1367-2630/14/4/045004
2012 doi
-
[43]
M., Donahue, M., et al
Sun, M., V oit, G. M., Donahue, M., et al. 2009, ApJ, 693, 1142, doi: 10.1088/0004-637X/693/2/1142
2009 doi
-
[44]
2019, MNRAS, 484, 2896, doi: 10.1093/mnras/stz161
Truong, N., Rasia, E., Biffi, V ., et al. 2019, MNRAS, 484, 2896, doi: 10.1093/mnras/stz161
2019 doi
-
[45]
Tully, R. B. 1987, ApJ, 321, 280, doi: 10.1086/165629
1987 doi
-
[46]
2021, A&A, 646, A156, doi: 10.1051/0004-6361/202039221
Tuominen, T., Nevalainen, J., Tempel, E., et al. 2021, A&A, 646, A156, doi: 10.1051/0004-6361/202039221
2021 doi
-
[47]
A., Iliev, I
Watson, W. A., Iliev, I. T., D’Aloisio, A., et al. 2013, MNRAS, 433, 1230, doi: 10.1093/mnras/stt791
2013 doi
-
[48]
J., van den Bosch, F
Yang, X., Mo, H. J., van den Bosch, F. C., & Jing, Y . P. 2005, MNRAS, 356, 1293, doi: 10.1111/j.1365-2966.2005.08560.x
2005
-
[49]
J., van den Bosch, F
Yang, X., Mo, H. J., van den Bosch, F. C., et al. 2007, ApJ, 671, 153, doi: 10.1086/522027
2007 doi
-
[50]
2021, ApJ, 909, 143, doi: 10.3847/1538-4357/abddb2
Yang, X., Xu, H., He, M., et al. 2021, ApJ, 909, 143, doi: 10.3847/1538-4357/abddb2
2021 doi
-
[51]
I., & Mulchaey, J
Zabludoff, A. I., & Mulchaey, J. S. 1998, ApJ, 496, 39, doi: 10.1086/305355
1998 doi
- [52]
-
[53]
2023, MNRAS, doi: 10.1093/mnras/stad1684
Zheng, Y .-L., Yang, X., He, M., et al. 2023, MNRAS, doi: 10.1093/mnras/stad1684
2023 doi
Reviewed August 12, 2026 · model on record in the stance chip above.
Discussion (0). Continue with ORCID to comment.