REVIEW 4 major objections 7 minor 62 references
FinFlier: Automating Graphical Overlays for Financial Visualizations with Knowledge-Grounding Large Language Model
T0 review · 4 major / 7 minor · reviewed 2026-08-11 · deepseek-v4-flash
Pith's one-line read FinFlier claims that a knowledge-grounding LLM can turn a financial article and its data table into a sequence of layered charts with auto-chosen overlays, and reports top F1 scores for subject, trend, and numerical vocabulary.
desk verdict A useful corpus and a plausible system, but the headline F1 numbers are unreliable because the test narratives and the dynamic-prompt retrieval pool come from the same 493-narrative corpus, and the paper never says test items were excluded. read the letter →
The pith
A machine-rendered reading of the paper's core claim, the machinery that carries it, and where it could break.
The reading
What carries the argument
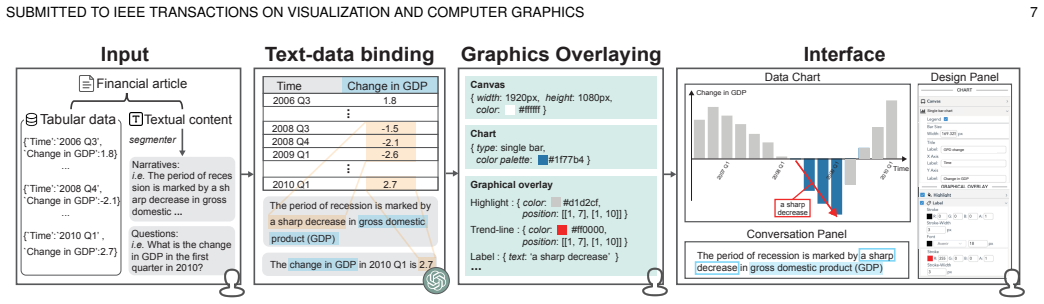
The load-bearing machinery is the correspondence between financial vocabulary types and graphical overlay categories, together with the structured template and prompt stack that lets an LLM execute that correspondence. The template is a masked output object with fields ObjectName, DataName, Position, Trend, Num, and Text, which converts text-data binding into a constrained fill-in-the-blank task; the prompt stack adds chain-of-thought reasoning and dynamically selected few-shot examples to improve accuracy on trend words and numerical values.
What would settle it
Check the dynamic-prompt database from Sect. 4.1 for the exact text of the 50 test narratives used in Sect. 5.2; if any test narrative appears among the retrieved few-shot examples, recompute the F1 scores with those examples removed, and if the knowledge-grounding advantage over the zero-shot baseline disappears, the claim that the method generalizes to new financial articles is not supported.
Extended reading notes
Core claim
On the paper's own terms, the central discovery is that financial narratives can be decomposed into three vocabulary types: subject, trend, and numerical, and that each type has a reliable default overlay or overlay combination, derived from 1,752 layered charts and expert interviews. The text-data binding module turns this decomposition into a template-filling task: the LLM outputs structured objects containing ObjectName, DataName, Position, Trend, Num, and Text while being guided by output-constrained prompts, chain-of-thought reasoning, and few-shot examples retrieved by semantic similarity. In the reported evaluation, this knowledge-grounding approach outperforms zero-shot baseline LLMs on F1 for all three vocabulary types, with the largest gains on trend and numerical recognition. The graphics overlaying module then renders each narrative's bindings as a layered chart, using highlight for subjects, marker and label for numericals, trend-line and description for change patterns, overall-indicator for summary indicators, and special-time-point for events, and orders the charts by the sequence in which subjects appear in the article.
Load-bearing premise
The reported text-data binding scores stand on the assumption that the 50 test narratives were not among the few-shot examples retrieved from the same 493-narrative prompt database; the paper does not state that this exclusion happened.
Editorial extensions
If this is right
- If FinFlier works as reported, financial articles can be converted into a sequence of layered charts, one per narrative segment, with no manual chart annotation.
- The default overlay combinations can be generated automatically from text-data bindings: highlight for subjects, marker and label for numericals, trend-line and description for change patterns, overall-indicator for summary indicators, and special-time-point for events.
- The prompt-engineering stack of output-constrained templates, chain-of-thought reasoning, and similarity-ranked few-shot examples is the reason the binding module outperforms zero-shot LLM baselines across all three vocabulary types in the paper's evaluation.
- The interactive interface allows users to refine the automatically generated overlays, and the paper reports high user ratings for usefulness, ease of use, and ease of learning.
- The narrative sequencing feature means the system can export all generated charts as a GIF that preserves the order in which subjects appear in the article, giving readers an overview of the whole financial story.
Reading between the lines
- Editorial inference: the correspondence table is a static snapshot of existing chart practice, so the system will tend to reproduce common overlay combinations and may miss novel or unconventional ways to annotate financial trends, an extension the paper itself acknowledges.
- Editorial inference: because the dynamic-prompt examples are drawn from the same corpus as the test narratives, a truly held-out evaluation against articles from different publishers would be a stronger test of generalization; the paper does not report such an evaluation.
- Editorial inference: the template structure could transfer to other dense, vocabulary-heavy domains such as medical or legal reporting, where subject, trend, and numerical categories would be replaced by domain-specific roles; the paper's discussion mentions this possibility for medical text.
Signed reviews
Editorial analysis
A structured set of objections, weighed in public.
Referee Report
Summary. FinFlier is a two-stage system for automatically generating graphical overlays on financial charts. The authors first survey 1,752 layered charts to derive a design space of overlay techniques and a proposed correspondence between financial vocabulary types (subject, trend, numerical) and overlay defaults. FinFlier then uses a knowledge-grounding GPT-3.5 pipeline with output constraints, chain-of-thought reasoning, and dynamic few-shot prompt retrieval to bind financial narrative text to tabular data, and a second module generates layered charts with narrative sequencing. The paper reports quantitative F1 scores for text-data binding on 50 labeled narratives, ablation experiments for the prompt engineering components, a gallery of example outputs, and user studies (n=18) rating the generated layered charts against side-by-side textual alternatives. The central claim is that FinFlier automates effective graphical overlays for financial narratives and that its knowledge-grounding approach improves text-data binding over zero-shot GPT-3.5 and GPT-4.
Significance. If the evaluation concerns are addressed, FinFlier would be a useful contribution to financial narrative visualization and to the broader line of LLM-based visualization-text interplay. The survey of 1,752 layered charts, the released corpus, and the explicit coding procedure with Cohen's kappa are concrete assets. The system is also a practical demonstration of combining output constraints, chain-of-thought, and dynamic prompting for a domain-specific binding task, which is a reusable technical recipe. The strongest aspects are the scope of the design-space analysis and the end-to-end pipeline with a working interactive interface; the weakest aspects are the validity of the quantitative benchmark and the lack of a comparison against existing automated overlay tools.
major comments (4)
- [Sect. 4.1 and Sect. 5.2] The dynamic prompt module retrieves the top-k (k=10) most semantically similar examples from 'the constructed prompt database' (Sect. 4.1). Section 3.2 states that this database is built from the 493 financial narratives with corresponding data tables, and Section 5.2 evaluates on 50 narratives 'randomly selected' from these same narratives. The paper never states that the 50 test narratives were removed from the prompt database before retrieval. If a test narrative or a near-duplicate appears among the in-context examples, the Table 1 F1 scores, including the claim that Knowledge-grounding GPT-3.5 'archives the highest F1 scores across all three vocabulary types,' would measure retrieval of near-duplicate answers rather than generalization to unseen financial articles. This is load-bearing because the novelty of the approach is precisely the knowledge-grounding prompt construction. Please clarify the construction of the prompt database and the train/test split, report any overlap statistics, and re-run the evaluation with the test narratives excluded from the retrieval pool.
- [Sect. 5.2, Table 1] The quantitative claims rest on point F1 values for 50 narratives, with no per-narrative variance, confidence intervals, or significance tests. Several headline gaps are small (e.g., Subject F1 0.9455 vs. 0.9434 for zero-shot GPT-4), so the 'highest F1 scores' claim is not statistically supported. In addition, the paper does not describe who produced the 'labeled vocabularies' for the 50 test narratives or whether inter-annotator agreement was computed. Please report per-narrative distributions and paired significance tests (e.g., bootstrap or Wilcoxon signed-rank), and provide label reliability information.
- [Sect. 5.3.1] The user study compares FinFlier-generated layered charts with two side-by-side baselines that were manually produced by the authors, rather than with outputs of existing automated systems such as Contextifier, ChartText, or LTV. The high ratings therefore support the general benefit of graphical overlays, or the specific chart examples, but not the claim that FinFlier outperforms prior automation. A comparison with at least one existing automated tool, or a clearly narrowed claim about the overlay paradigm, is needed. The manual production of the comparison stimuli also risks experimenter bias.
- [Sect. 3.3 and Sect. 5.3] The overlay-vocabulary correspondence is derived from the same 1,752-chart corpus that informs the system, and the user study then rates charts generated using exactly this correspondence. This evaluates internal consistency rather than the correctness of the correspondence against alternatives. The paper should validate the correspondence on held-out layered charts (for example, compare FinFlier's default overlay choices with human-coded overlays on an unseen sample) or soften the claim that the survey identifies the 'proper correspondence' between financial narratives and graphical overlays.
minor comments (7)
- [Sect. 3] The phrase 'we out to survey' should read 'we set out to survey'.
- [Sect. 5.2] The claim that Knowledge-grounding GPT-3.5 'archives the highest F1 scores' should use 'achieves,' and the statement that 'w/o DP appears to perform worse than base LLMs' is contradicted by the Numerical F1 (0.8372 vs. 0.7778 for zero-shot GPT-3.5); the sentence should be qualified per vocabulary type.
- [Sect. 5.3.1] The word 'manully' should be 'manually.'
- [Sect. 5.3.2] The word 'Proceduce' should be 'Procedure.'
- [Sect. 6.1 and Sect. 4.3] There are several typos: 'locating data within the tales' should be 'tables,' 'Dow Janes' should be 'Dow Jones,' and the label 'GPD change' in Figure 6 should be 'GDP change.'
- [Sect. 4.1] The LLM-based narrative segmenter is mentioned but neither described nor evaluated; please specify how segmentation is performed and report its accuracy or discuss its failure modes, since segmentation errors propagate to the binding and overlaying stages.
- [Sect. 6.1, Figure 13] The controlled table-size experiment lacks details on the number of trials, the random generation procedure, and error bars; the curves in Figure 13 should be accompanied by a description of the data-generating process and variability.
Circularity Check
No demonstrated circularity: the design-space derivation and text-data binding evaluation are not equivalent to their inputs; the dynamic-prompt evaluation raises a possible prompt/test overlap, but the paper does not specify the prompt database composition, so a circular reduction cannot be exhibited.
full rationale
FinFlier's design is derived from an external corpus survey (1752 layered charts), expert interviews, and standard prompt-engineering techniques (output constraint, chain-of-thought, LM-BFF-style dynamic prompt selection). The correspondence rules in Sect. 3.3 are empirical summaries used as design defaults, not outputs of the system. The Table 1 F1 scores are computed against human-labeled vocabularies on 50 narratives, and the knowledge-grounding prompt components are not fitted to those labels. The authors' prior work cited in the paper ([14], [43]) is contextual and not load-bearing. I do flag a validity concern: Sect. 5.2 reports 50 narratives 'randomly selected' from the 493-narrative collection, while Sect. 3.2 says the LLM is enabled to learn data patterns from that collection and Sect. 4.1 retrieves top-k examples from a 'constructed prompt database'. The paper does not state that the 50 test narratives were removed from that database, so the reported F1 could be inflated by in-context example overlap. However, since the composition of the prompt database is never specified, I cannot exhibit the specific input-output equivalence required to call this circular rather than a data-leakage risk. That concern belongs to evaluation validity, not to the derivation chain.
Assumptions & free parameters
free parameters (3)
- Overlay-vocabulary mapping rules
- Dynamic prompt retrieval k =
10
- Trend vocabulary pattern list (top 10)
assumptions (4)
- domain assumption Financial narratives can be decomposed into subject, trend, and numerical vocabulary types.
- domain assumption The four chart types (single/multi line, single/multi bar) cover most financial narrative visualization scenarios.
- domain assumption Graphical overlays improve comprehension over side-by-side text and charts.
- domain assumption The 1,752-chart corpus is representative of financial narrative visualizations.
Cite this review
Pith. "Pith review of FinFlier: Automating Graphical Overlays for Financial Visualizations with Knowledge-Grounding Large Language Model." pith.science (2026). https://pith.science/paper/WZKLSC2Z
@misc{pith2026241206821,
  author       = {Pith},
  title        = {Pith review of: FinFlier: Automating Graphical Overlays for Financial Visualizations with Knowledge-Grounding Large Language Model},
  year         = {2026},
  howpublished = {\url{https://pith.science/paper/WZKLSC2Z}},
  note         = {Machine review of arXiv:2412.06821}
}
read the original abstract
Graphical overlays that layer visual elements onto charts, are effective to convey insights and context in financial narrative visualizations. However, automating graphical overlays is challenging due to complex narrative structures and limited understanding of effective overlays. To address the challenge, we first summarize the commonly used graphical overlays and narrative structures, and the proper correspondence between them in financial narrative visualizations, elected by a survey of 1752 layered charts with corresponding narratives. We then design FinFlier, a two-stage innovative system leveraging a knowledge-grounding large language model to automate graphical overlays for financial visualizations. The text-data binding module enhances the connection between financial vocabulary and tabular data through advanced prompt engineering, and the graphics overlaying module generates effective overlays with narrative sequencing. We demonstrate the feasibility and expressiveness of FinFlier through a gallery of graphical overlays covering diverse financial narrative visualizations. Performance evaluations and user studies further confirm system's effectiveness and the quality of generated layered charts.
Figures


Figures from the paper (10 more)



Reference graph
Works this paper leans on
-
[1]
Telling the investment story: A narrative analysis of shareholder reports,
D. A. Jameson, “Telling the investment story: A narrative analysis of shareholder reports,” The Journal of Business Communication, vol. 37, no. 1, pp. 7–38, 2000
work page 2000
-
[2]
M. Roos and M. Reccius, “Narratives in economics,” Journal of Economic Surveys, vol. 38, no. 2, pp. 303–341, 2024
work page 2024
-
[3]
Narrative visualization: Telling stories with data,
E. Segel and J. Heer, “Narrative visualization: Telling stories with data,” IEEE Trans. Vis. Comput. Graph., vol. 16, no. 6, pp. 1139–1148, 2010
2010
-
[4]
Au- tomatic Annotation Synchronizing with Textual Description for Visualization,
C. Lai, Z. Lin, R. Jiang, Y . Han, C. Liu, and X. Yuan, “Au- tomatic Annotation Synchronizing with Textual Description for Visualization,” in Proc. ACM CHI, 2020, pp. 1–13
work page 2020
-
[5]
ChartText: Linking Text with Charts in Documents
J. Pinheiro and J. Poco, “ChartText: Linking text with charts in documents,” arXiv preprint arXiv:2201.05043, 2022
work page Pith review arXiv 2022
-
[6]
CrossData: Leveraging text-data con- nections for authoring data documents,
Z. Chen and H. Xia, “CrossData: Leveraging text-data con- nections for authoring data documents,” in Proc. ACM CHI, 2022, pp. 1–15
work page 2022
-
[7]
Chara- graph: Interactive generation of charts for realtime annota- tion of data-rich paragraphs,
D. Masson, S. Malacria, G. Casiez, and D. V ogel, “Chara- graph: Interactive generation of charts for realtime annota- tion of data-rich paragraphs,” in Proc. ACM CHI, 2023, pp. 1–18
work page 2023
-
[8]
DATATALES: Investigating the use of large language models for authoring data-driven articles,
N. Sultanum and A. Srinivasan, “DATATALES: Investigating the use of large language models for authoring data-driven articles,” in Proc. IEEE VIS, 2023, pp. 231–235
work page 2023
Show all 62 references
-
[9]
Graphical overlays: Using layered elements to aid chart reading,
N. Kong and M. Agrawala, “Graphical overlays: Using layered elements to aid chart reading,” IEEE Trans. Vis. Comput. Graph., vol. 18, no. 12, pp. 2631–2638, 2012
2012
-
[10]
Contextifier: Automatic generation of annotated stock visualizations,
J. Hullman, N. Diakopoulos, and E. Adar, “Contextifier: Automatic generation of annotated stock visualizations,” in Proc. ACM CHI, 2013, pp. 2707–2716
2013
-
[11]
Augmenting visualizations with interactive data facts to facilitate interpretation and communication,
A. Srinivasan, S. M. Drucker, A. Endert, and J. Stasko, “Augmenting visualizations with interactive data facts to facilitate interpretation and communication,” IEEE Trans. Vis. Comput. Graph., vol. 25, no. 1, pp. 672–681, 2018
2018
-
[12]
A Qualitative Analysis of Common Prac- tices in Annotations: A taxonomy and design space,
M. D. Rahman, G. J. Quadri, B. Doppalapudi, D. A. Szafir, and P. Rosen, “A Qualitative Analysis of Common Prac- tices in Annotations: A taxonomy and design space,” arXiv preprint arXiv:2306.06043, 2023
2023 arXiv
-
[13]
Semantic web technologies for economic and financial information management,
P. Castells, B. Foncillas, R. Lara, M. Rico, and J. L. Alonso, “Semantic web technologies for economic and financial information management,” in Proc. ESWS, 2004, pp. 473– 487
2004
-
[14]
VisTR: Visualizations as representations for time-series table reason- ing,
J. Hao, Z. Liang, C. Li, Y . Luo, j. Li, and W. Zeng, “VisTR: Visualizations as representations for time-series table reason- ing,” arXiv preprint arXiv:2406.03753, 2024
2024 arXiv
-
[15]
One Fits All: Power general time series analysis by pretrained lm,
T. Zhou, P. Niu, X. Wang, L. Sun, and R. Jin, “One Fits All: Power general time series analysis by pretrained lm,” arXiv preprint arXiv:2302.11939, 2023
2023 arXiv
-
[16]
Linking text and visualizations via contextual knowledge graph,
X. Cai, D. Weng, T. Fu, S. Fu, Y . Wang, and Y . Wu, “Linking text and visualizations via contextual knowledge graph,” IEEE Trans. Vis. Comput. Graph., pp. 1–14, 2024
2024
-
[17]
Narrative Visualization: Telling stories with data,
E. Segel and J. Heer, “Narrative Visualization: Telling stories with data,” IEEE Trans. Vis. Comput. Graph., vol. 16, no. 6, pp. 1139–1148, 2010
2010
-
[18]
Calliope: Automatic visual data story generation from a spreadsheet,
D. Shi, X. Xu, F. Sun, Y . Shi, and N. Cao, “Calliope: Automatic visual data story generation from a spreadsheet,” IEEE Trans. Vis. Comput. Graph. , vol. 27, no. 2, pp. 453– 463, 2020
2020
-
[19]
Data Player: Automatic generation of data videos with narration- animation interplay,
L. Shen, Y . Zhang, H. Zhang, and Y . Wang, “Data Player: Automatic generation of data videos with narration- animation interplay,” IEEE Trans. Vis. Comput. Graph. , vol. 30, no. 1, pp. 109–119, 2024
2024
-
[20]
DeepClue: Visual interpretation of text-based deep stock prediction,
L. Shi, Z. Teng, L. Wang, Y . Zhang, and A. Binder, “DeepClue: Visual interpretation of text-based deep stock prediction,” IEEE Transactions on Knowledge and Data Engineering, vol. 31, no. 6, pp. 1094–1108, 2018
2018
-
[21]
A survey on visual analysis approaches for financial data,
S. Ko, I. Cho, S. Afzal, C. Yau, J. Chae, A. Malik, K. Beck, Y . Jang, W. Ribarsky, and D. S. Ebert, “A survey on visual analysis approaches for financial data,” Comput. Graph. Forum, vol. 35, no. 3, pp. 599–617, 2016
2016
-
[22]
Koop, Analysis of financial data
G. Koop, Analysis of financial data . John Wiley & Sons, Ltd, 2006
2006
-
[23]
Language models are few-shot learners,
T. Brown, B. Mann, N. Ryder, M. Subbiah, J. D. Kaplan, P. Dhariwal, A. Neelakantan, P. Shyam, G. Sastry, A. Askell et al., “Language models are few-shot learners,” Adv. Neural Inf. Process., vol. 33, pp. 1877–1901, 2020
1901
-
[24]
Kori: Interactive synthesis of text and charts in data documents,
S. Latif, Z. Zhou, Y . Kim, F. Beck, and N. W. Kim, “Kori: Interactive synthesis of text and charts in data documents,” IEEE Trans. Vis. Comput. Graph. , vol. 28, no. 1, pp. 184– 194, 2021
2021
-
[25]
Word-sized graphics for scientific texts,
F. Beck and D. Weiskopf, “Word-sized graphics for scientific texts,” IEEE Trans. Vis. Comput. Graph., vol. 23, no. 6, pp. 1576–1587, 2017
2017
-
[26]
Storytelling: The next step for visualization,
R. Kosara and J. Mackinlay, “Storytelling: The next step for visualization,” Comput., vol. 46, no. 5, pp. 44–50, 2013
2013
-
[27]
ChartAccent: Annotation for data-driven storytelling,
D. Ren, M. Brehmer, B. Lee, T. H ¨ollerer, and E. K. Choe, “ChartAccent: Annotation for data-driven storytelling,” in Proc. IEEE PacificVis, 2017, pp. 230–239
2017
-
[28]
Linking and layout: Exploring the integration of text and visualization in story- telling,
Q. Zhi, A. Ottley, and R. Metoyer, “Linking and layout: Exploring the integration of text and visualization in story- telling,” Comput. Graph. Forum., vol. 38, no. 3, pp. 675–685, 2019
2019
-
[29]
Elastic Documents: Coupling text and tables through contextual visualizations for enhanced document reading,
S. K. Badam, Z. Liu, and N. Elmqvist, “Elastic Documents: Coupling text and tables through contextual visualizations for enhanced document reading,” IEEE Trans. Vis. Comput. Graph., vol. 25, no. 1, pp. 661–671, 2019
2019
-
[30]
Augmenting scientific papers with just- in-time, position-sensitive definitions of terms and symbols,
A. Head, K. Lo, D. Kang, R. Fok, S. Skjonsberg, D. S. Weld, and M. A. Hearst, “Augmenting scientific papers with just- in-time, position-sensitive definitions of terms and symbols,” in Proc. ACM CHI, 2021, pp. 1–18
2021
-
[31]
Extracting references between text and charts via crowdsourcing,
N. Kong, M. A. Hearst, and M. Agrawala, “Extracting references between text and charts via crowdsourcing,” in Proc. ACM CHI, 2014, pp. 31–40
2014
-
[32]
Striking a balance: Reader takeaways and prefer- ences when integrating text and charts,
C. Stokes, V . Setlur, B. Cogley, A. Satyanarayan, and M. A. Hearst, “Striking a balance: Reader takeaways and prefer- ences when integrating text and charts,” IEEE Trans. Vis. Comput. Graph., vol. 29, no. 1, pp. 1233–1243, 2022
2022
-
[33]
Exploring interactive linking between text and visualization
S. Latif, D. Liu, and F. Beck, “Exploring interactive linking between text and visualization.” in Proc. EuroVis, 2018, pp. 91–94
2018
-
[34]
Internal and external visual cue preferences for visualizations in presentations,
H.-K. Kong, Z. Liu, and K. Karahalios, “Internal and external visual cue preferences for visualizations in presentations,” Comput. Graph. Forum, vol. 36, no. 3, pp. 515–525, 2017
2017
-
[35]
EmphasisChecker: A tool for guiding chart and caption emphasis,
D. H. Kim, S. Choi, J. Kim, V . Setlur, and M. Agrawala, “EmphasisChecker: A tool for guiding chart and caption emphasis,” IEEE Trans. Vis. Comput. Graph., vol. 30, no. 1, pp. 120–130, 2024
2024
-
[36]
Facilitating Document Reading by Linking Text and Tables,
D. H. Kim, E. Hoque, J. Kim, and M. Agrawala, “Facilitating Document Reading by Linking Text and Tables,” in Proc. ACM UIST, 2018, pp. 423–434
2018
-
[37]
Bromley and V
D. Bromley and V . Setlur, “What Is the Difference Between SUBMITTED TO IEEE TRANSACTIONS ON VISUALIZATION AND COMPUTER GRAPHICS 16 a Mountain and a Molehill? quantifying semantic labeling of visual features in line charts,” in Proc. IEEE VIS, 2023, pp. 161–165
2023
-
[38]
Few-shot parameter-efficient fine-tuning is better and cheaper than in-context learning,
H. Liu, D. Tam, M. Muqeeth, J. Mohta, T. Huang, M. Bansal, and C. A. Raffel, “Few-shot parameter-efficient fine-tuning is better and cheaper than in-context learning,” Adv. Neural Inf. Process., vol. 35, pp. 1950–1965, 2022
1950
-
[39]
Chain-of-thought prompting elicits reasoning in large language models,
J. Wei, X. Wang, D. Schuurmans, M. Bosma, F. Xia, E. Chi, Q. V . Le, D. Zhou et al. , “Chain-of-thought prompting elicits reasoning in large language models,” Adv. Neural Inf. Process., vol. 35, pp. 24 824–24 837, 2022
2022
-
[40]
Training language models to follow instructions with human feedback,
L. Ouyang, J. Wu, X. Jiang, D. Almeida, C. Wainwright, P. Mishkin, C. Zhang, S. Agarwal, K. Slama, A. Ray et al., “Training language models to follow instructions with human feedback,” Adv. Neural Inf. Process. , vol. 35, pp. 27 730– 27 744, 2022
2022
-
[41]
FinBERT: A large language model for extracting information from financial text,
A. H. Huang, H. Wang, and Y . Yang, “FinBERT: A large language model for extracting information from financial text,” Contemporary Accounting Research , vol. 40, no. 2, pp. 806–841, 2023
2023
-
[42]
FinGPT: Open- source financial large language models,
H. Yang, X.-Y . Liu, and C. D. Wang, “FinGPT: Open- source financial large language models,” arXiv preprint arXiv:2306.06031, 2023
2023
-
[43]
Generative AI for visualization: State of the art and future directions,
Y . Ye, J. Hao, Y . Hou, Z. Wang, S. Xiao, Y . Luo, and W. Zeng, “Generative AI for visualization: State of the art and future directions,” Visual Informatics, vol. 8, no. 2, pp. 43–66, 2024
2024
-
[44]
Chain-of-Table: Evolving Tables in the Reasoning Chain for Table Understanding,
Z. Wang, H. Zhang, C.-L. Li, J. M. Eisenschlos, V . Perot, Z. Wang, L. Miculicich, Y . Fujii, J. Shang, C.-Y . Leeet al., “Chain-of-Table: Evolving Tables in the Reasoning Chain for Table Understanding,” arXiv preprint arXiv:2401.04398, 2024
2024 arXiv
-
[45]
Hyland, Hedging in scientific research articles
K. Hyland, Hedging in scientific research articles . John Benjamins Publishing Company, 1998
1998
-
[46]
Financial analysis – a study,
D. Ravinder, “Financial analysis – a study,” IOSR Journal of Economics and Finance, vol. 2, pp. 10–22, 2013
2013
-
[47]
AI Chains: Transparent and controllable human-ai interaction by chaining large language model prompts,
T. Wu, M. Terry, and C. J. Cai, “AI Chains: Transparent and controllable human-ai interaction by chaining large language model prompts,” in Proc. ACM CHI, 2022, pp. 1–22
2022
-
[48]
What context features can transformer language models use?
J. O’Connor and J. Andreas, “What context features can transformer language models use?” arXiv preprint arXiv:2106.08367, 2021
2021 arXiv
-
[49]
“We Need Structured Output
M. X. Liu, F. Liu, A. J. Fiannaca, T. Koo, L. Dixon, M. Terry, and C. J. Cai, ““We Need Structured Output”: Towards user- centered constraints on large language model output,” in Proceedings of Extended Abstracts of the CHI Conference on Human Factors in Computing Systems, 202...
2024
-
[50]
Thinking aloud: Dynamic context generation improves zero-shot reasoning performance of gpt-2,
G. Betz, K. Richardson, and C. V oigt, “Thinking aloud: Dynamic context generation improves zero-shot reasoning performance of gpt-2,” arXiv preprint arXiv:2103.13033 , 2021
2021 arXiv
-
[51]
GPT-3: Its Nature, Scope, Limits, and Consequences,
L. Floridi and M. Chiriatti, “GPT-3: Its Nature, Scope, Limits, and Consequences,” Minds Mach. , vol. 30, no. 4, pp. 681–694, 2020
2020
-
[52]
Climbing towards NLU: On meaning, form, and understanding in the age of data,
E. M. Bender and A. Koller, “Climbing towards NLU: On meaning, form, and understanding in the age of data,” in Proc. ACL, 2020, pp. 5185–5198
2020
-
[53]
Prompt engineering in large language models,
G. Marvin, N. Hellen, D. Jjingo, and J. Nakatumba-Nabende, “Prompt engineering in large language models,” in Proc. ICDICI, 2023, pp. 387–402
2023
-
[54]
Making pre-trained language models better few-shot learners,
T. Gao, A. Fisch, and D. Chen, “Making pre-trained language models better few-shot learners,” arXiv preprint arXiv:2012.15723, 2020
2012 arXiv
-
[55]
Laws of organization in perceptual forms
M. Wertheimer, “Laws of organization in perceptual forms.” Psycologische Forschung, vol. 4, 1923
1923
-
[56]
Survey of hallucination in natural language generation,
Z. Ji, N. Lee, R. Frieske, T. Yu, D. Su, Y . Xu, E. Ishii, Y . J. Bang, A. Madotto, and P. Fung, “Survey of hallucination in natural language generation,” ACM Comput. Surv. , vol. 55, no. 12, pp. 1–38, 2023
2023
-
[57]
AutoTitle: An interactive title generator for visualizations,
C. Liu, Y . Guo, and X. Yuan, “AutoTitle: An interactive title generator for visualizations,” IEEE Trans. Vis. Comput. Graph., vol. 30, no. 8, pp. 5276 – 5288, 2023
2023
-
[58]
VISAtlas: An image- based exploration and query system for large visualization collections via neural image embedding,
Y . Ye, R. Huang, and W. Zeng, “VISAtlas: An image- based exploration and query system for large visualization collections via neural image embedding,” IEEE Trans. Vis. Comput. Graph., vol. 30, no. 7, pp. 3224–3240, 2024
2024
-
[59]
Large language models are versatile decomposers: Decomposing evidence and questions for table-based reasoning,
Y . Ye, B. Hui, M. Yang, B. Li, F. Huang, and Y . Li, “Large language models are versatile decomposers: Decomposing evidence and questions for table-based reasoning,” in Proc. ACM SIGIR, 2023, pp. 174–184
2023
-
[60]
Enhancing llm factual ac- curacy with rag to counter hallucinations: A case study on domain-specific queries in private knowledge-bases,
J. Li, Y . Yuan, and Z. Zhang, “Enhancing llm factual ac- curacy with rag to counter hallucinations: A case study on domain-specific queries in private knowledge-bases,” arXiv preprint arXiv:2403.10446, 2024
2024 arXiv
-
[61]
AutoTQA: Towards Autonomous Tabular Question Answering through Multi-Agent Large Language Models,
J. Zhu, P. Cai, K. Xu, L. Li, Y . Sun, S. Zhou, H. Su, L. Tang, and Q. Liu, “AutoTQA: Towards Autonomous Tabular Question Answering through Multi-Agent Large Language Models,” Proc. VLDB Endow. , vol. 17, no. 12, pp. 3920–3933, 2024. Jianing Hao received a B.E. degree in compu...
2024
-
[2021]
Wei Zeng is an assistant professor at the Hong Kong University of Science and Technology (Guangzhou)
His research interests include FinTech, fi- nancial econometrics, empirical finance and ma- chine learning. Wei Zeng is an assistant professor at the Hong Kong University of Science and Technology (Guangzhou). He received his Ph.D. in com- puter science from Nanyang Technologi...
2015
Reviewed August 11, 2026 · model on record in the stance chip above.
Discussion (0). Continue with ORCID to comment.