REVIEW 4 major objections 5 minor 60 references
Insights into the Properties of Type Ibn/Icn Supernovae and Their Progenitor Channels through X-ray Emission
T0 review · 4 major / 5 minor · reviewed 2026-08-11 · deepseek-v4-flash
Pith's one-line read This paper claims that soft and hard X-ray light curves of Type Ibn/Icn supernovae carry separate information—composition versus density and ejecta properties—and uses that split to infer different envelope-stripping depths for SN 2006jc…
desk verdict Useful first systematic X-ray LC library for SNe Ibn/Icn; the hard/soft diagnostic split is solid, but the derived abundances are conditional on density assumptions and the photoionization section has an unresolved internal inconsistency. read the letter →
The pith
A machine-rendered reading of the paper's core claim, the machinery that carries it, and where it could break.
The reading
What carries the argument
The machinery is a one-dimensional radiation-hydrodynamics model of the supernova-CSM interaction, driven by the SNEC hydrodynamics code, with a post-processing step that follows electron and ion temperatures separately, including electron-ion coupling, adiabatic cooling, and radiative losses. From that, the model computes free-free emission behind the forward shock, Compton scattering in the shocked region, and photoelectric absorption in the unshocked CSM, using a power-law density profile $\rho_{\rm CSM} = 10^{-14}D'(r/5\times10^{14}\,{\rm cm})^{-s}\,{\rm g\,cm^{-3}}$ and a (He, C, O) mass-fraction composition. The key identity is that the observed soft X-ray light curve is the free-free luminosity attenuated by $\exp(-\tau(E_{\rm ph}))$, where $\tau$ is set by the column density of heavy elements, while the hard-X-ray light curve is nearly absorption-free. The photoionization analysis introduces the ionization parameter $\xi = L_{X,\rm soft}/(n_e r^2)$; when $\xi \gtrsim 100$ the carbon and oxygen K-shell electrons are stripped, photoelectric absorption temporarily switches off, and the light curve can show an early bright phase followed by a dip and re-rise as the shell recombines.
What would settle it
Point a soft-X-ray telescope at the next nearby Type Ibn/Icn within the first few days and a hard-X-ray telescope in the same window. The photoionization prediction fails if no bright early soft X-ray component and no dip-and-rerise structure is seen despite a detected hard X-ray that anchors the density. The density-anchoring claim fails if the measured hard X-ray peak time and luminosity require a density scale that differs from the optical-model value by more than the model's stated uncertainty.
Extended reading notes
Core claim
The paper's central discovery is a practical diagnostic split. Because photoelectric absorption by the unshocked circumstellar medium is strong for soft X-rays and scales steeply with atomic number, the shape of the soft (0.2-10 keV) light curve is set by how much helium, carbon, and oxygen are in the shell; heavier elements absorb earlier and more. Hard X-rays (10-40 keV) are almost unaffected by that absorption, so their rise and decay trace only the total column density, the explosion energy, and the ejecta mass. This lets a single broad-band observation break the density-composition degeneracy that limits optical light-curve modeling. Applying the model, the paper finds that SN 2006jc's soft X-ray rise prefers a helium-poor, carbon-oxygen-rich shell, while SN 2022ablq's is consistent with a helium envelope, implying that even within the Ibn class the pre-explosion mass loss can strip to different depths. The paper also argues that in the first few days the X-ray flux ionizes the unshocked shell, opening a Compton-thin window and producing a bright early soft X-ray phase that may appear as a double-peaked light curve.
Load-bearing premise
The inferred shell compositions for SN 2006jc and SN 2022ablq are conditional on the circumstellar density profile taken from prior optical light-curve modeling; if that density is wrong, the compositions and the claimed stripping-depth difference are not established.
Editorial extensions
If this is right
- Broad-band X-ray monitoring of SNe Ibn/Icn can break the degeneracy between CSM density and CSM composition that limits optical light-curve modeling.
- If the inferred compositions are right, SN 2006jc and SN 2022ablq bracket a diversity in envelope stripping: the 2006jc progenitor lost almost its entire helium layer, while the 2022ablq progenitor kept most of it.
- A prompt soft X-ray observation within a few days of explosion should catch a bright photoionized phase, possibly a double-peaked light curve, that would not be seen if the unshocked CSM were simply neutral.
- NuSTAR-class hard X-ray observations of a nearby SN Ibn/Icn should detect it if started within days, and would provide the density anchor needed to make the soft-X-ray composition measurement reliable.
- The existing soft X-ray nondetection of SN 2019hgp is consistent with any of the considered shell compositions, so current data cannot yet constrain its stripping depth.
Reading between the lines
- If the composition split is real, spectroscopic classes like Ibn may not map one-to-one onto a single stripping depth; the same narrow helium lines could hide a range of envelope remnant masses, complicating progenitor identification from optical spectra alone.
- The early photoionized bright phase could be confused with other early components such as shock breakout or radioactive heating, so multi-band time series or spectral color information will be needed to identify it unambiguously.
- A natural extension of the paper's method is to fit the full soft-X-ray spectrum, not just the light curve: line emission or absorption edges of carbon and oxygen in the 0.3-1 keV range could directly fingerprint the shell composition and test the (He, C, O) ratios inferred from the light-curve shape.
- The same hard-X-ray-as-density-anchor strategy should transfer to other interacting stripped-envelope transients, including SNe Icn and possibly SNe IIn, where photoelectric absorption in soft X-rays is similarly composition-sensitive.
Editorial analysis
A structured set of objections, weighed in public.
Referee Report
Summary. The paper develops a one-dimensional SN-CSM interaction model for Type Ibn/Icn supernovae, using SNEC adiabatic hydrodynamics plus a post-process two-temperature (electron/ion) thermal evolution with free-free and line cooling, and then computes broad-band X-ray light curves (0.2-10 keV and 10-40 keV) including Compton and photoelectric absorption. It argues that soft X-rays trace CSM composition through photoelectric absorption in the unshocked CSM, while hard X-rays robustly measure CSM density, ejecta mass, and explosion energy. The model is applied to SN 2006jc, SN 2019hgp, and SN 2022ablq, leading to the claim of different CSM compositions (He,C,O) = (0.4,0.3,0.3) for 2006jc and (0.95,0.025,0.025) for 2022ablq, implying different stripping depths. The paper also predicts a bright early soft-X-ray phase and possible double-peaked light curves due to photoionization and recombination in the unshocked CSM, and discusses NuSTAR/Swift detection strategies.
Significance. If the central claim holds, this is a valuable step: it provides the first systematic broad-band X-ray light-curve predictions for SNe Ibn/Icn from a physically coherent forward model, and it offers a concrete, falsifiable route to separate CSM density from composition using X-ray data. The model's structure is largely transparent, and Appendix A's estimate that neglected radiation feedback changes the unabsorbed luminosity by at most a factor of 1.6 is a useful quantitative check. The predicted bright soft-X-ray phase in the first few days and the double-peaked light-curve morphology are genuinely testable with Swift and NuSTAR, giving the paper practical value for observational target selection. The application to SN 2006jc and SN 2022ablq is suggestive, but the inferred composition difference is not yet established because it rests on sparse data and on assumed CSM density profiles from optical modeling; the paper's own hedges correctly identify this conditionality.
major comments (4)
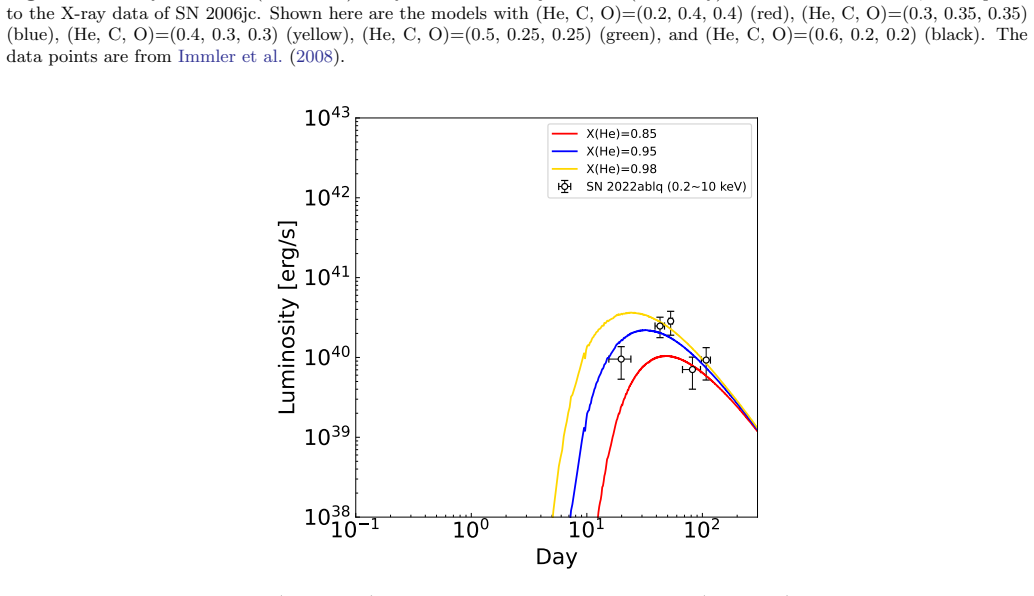
- [§4.1-4.3, Appendix B, Figs. 16-17] The composition determinations for SN 2006jc and SN 2022ablq are made by visual comparison of synthetic light curves to two or three X-ray data points that are plotted without error bars, and the text reports best values such as (He,C,O)=(0.4,0.3,0.3) and (0.95,0.025,0.025) with no quantitative goodness-of-fit or uncertainty estimate. Appendix B says the 40% helium model is "plausible" and the 95% helium model is "plausible," but the grid spacings (0.2-0.6 in steps of 0.1 for 2006jc; 0.85/0.95/0.98 for 2022ablq) do not justify the quoted precision, and the absence of error bars means the discrimination among adjacent models is not demonstrated. This is load-bearing because the paper's headline conclusion of different stripping depths depends on these specific abundance values.
- [§5.3, Fig. 15] Figure 15 contains an unresolved note in Japanese questioning the internal consistency of the recombination timing argument, explicitly asking why the early approximate estimate leads to a more easily neutral CSM than the model that reproduces the later data and suggesting "there may be a hole in the argument." This is not a minor annotation: the paper relies on the claim that the unshocked CSM is effectively neutral during the observed epochs (Sections 4.1 and 4.3) to interpret the soft-X-ray rise as photoelectric absorption, so the reasoning behind the recombination epoch must be fully resolved and presented in a language accessible to the readership before the composition conclusions can be considered established.
- [Abstract and §4.1/Summary item 3] The abstract states that "the soft X-ray LC provides information about the CSM compositions" as a robust finding, but the application of this idea to real objects is explicitly conditional on the CSM density profile taken from optical LC modeling. Section 4.1 concedes that the composition result "is sensitive to the assumed CSM density" and that optical LC modeling "may involve several uncertainties and possible systematic errors," and Summary item 3 warns against over-interpretation. The paper should either temper the abstract to reflect this conditionality (e.g., "can provide information" under model assumptions) or demonstrate with a density-perturbation study how much the derived (He,C,O) fractions change for a reasonable range of D' and s. As written, the abstract overstates the established evidence for the 2006jc vs 2022ablq composition difference.
- [§5.1, eqs. (10)-(14)] The photoionization treatment uses the unabsorbed soft X-ray luminosity to compute the ionization parameter, ignores X-ray attenuation in the radial direction, and neglects advection in the recombination timescale of eq. (12). The paper acknowledges these approximations, but they directly affect the quantitative estimates in Figures 12-15, including the claimed recombination epochs of 3-14 days for SN 2006jc and 5-15 days for SN 2022ablq. Because the double-peaked light-curve prediction and the confirmation that the neutral-CSM assumption holds at observed epochs are based on these order-of-magnitude estimates, the quantitative aspects of the photoionization discussion should be framed more cautiously, and the authors should state which of their conclusions survive if the critical ionization parameter is taken at the edge of the adopted 100-200 range.
minor comments (5)
- [Throughout] There are several typos and editorial errors: "originated" should be "originating" in the abstract; "herium" instead of "helium" in Section 1; "opacites" in Section 2.3; "dose not treat" in Section 6.2; "harx X-ray" in Section 4.2; "the the" in Section 5.3; and "straighten this conclusion" should be "strengthen this conclusion" in Section 4.3.
- [Figures 13-15] The figure captions contain placeholder text "Inoue&Maeda2024のポンチ絵" (Japanese for "Inoue & Maeda 2024 sketch") that should be replaced with the actual figure descriptions or removed before submission.
- [Section 2.3] The X-ray absorption database is referred to both as "xlaylib" and "xraylib" in the same section; the spelling should be made consistent.
- [Figure 9 caption] The caption reads "fully ionizedneutralfully ionized" with no spaces or separators; this should be rephrased as a proper sentence.
- [Section 4.2] The sentence "SNe Icn show lines from elements heavier than SNe Ibn" is unclear; it should be "from elements heavier than those seen in SNe Ibn" to avoid the implication that the lines themselves are heavier.
Circularity Check
The object-by-object CSM compositions are grid fits to the same soft X-ray LCs, conditional on same-group optical density priors; the broad-band diagnostic framework itself remains a forward model with genuine predictions.
-
fitted input called prediction
[Section 4.1, Section 4.3, Appendix B, Summary item 2]
"Thanks to the data point of SN 2006jc at ~40 days since the explosion, we find that our X-ray LC model prefers the low helium composition models ... we conclude that the 40% helium model is plausible for the CSM composition of SN 2006jc. ... we conclude that the 95% helium model is plausible for the CSM composition of SN 2022ablq."
The (He,C,O) values are free grid parameters chosen by matching the rising and peak soft X-ray LCs of these same objects, and the same soft X-ray LCs are then cited as the basis for the claim that soft X-ray modeling reveals a compositional difference between SN 2006jc and SN 2022ablq. The composition result is therefore a fit to the data, not an independent prediction tested by the data. Furthermore, the CSM density profile (D'=4.0, s=3) that controls the soft X-ray rise is imported from optical LC modeling by Maeda & Moriya (2022) and Nagao et al.
full rationale
The paper's central framework is a forward SN-CSM interaction X-ray model with stated physical assumptions: free-free emission from the forward shock, Compton and photoelectric absorption, and an order-of-magnitude photoionization estimate for the unshocked CSM. The separation of diagnostics (hard X-rays trace density/energy/mass, soft X-rays trace composition, and an early bright/double-peaked soft phase is predicted) is a genuine model output, not a circular reduction, because the X-ray data are external and the hard-X-ray sensitivity follows from the energy dependence of the opacities rather than from any fit. The main circularity-adjacent issue is the application: the CSM compositions for SN 2006jc and SN 2022ablq are selected from a small grid to match the same soft X-ray light curves that are then said to reveal composition, and the adopted density parameters come from prior optical LC models co-authored by the present author. The paper explicitly hedges this in Section 4.1, Section 6.1, and Summary item 3, calling for hard-X-ray observations to anchor the density. Additionally, the unresolved Japanese note in Figure 15 ('why is it easier to become neutral... there may be a hole in the argument?') flags an internal inconsistency in the ionization/recombination timing argument; this is a correctness/limitation concern rather than a self-definitional circularity. Overall, the broad-band diagnostic claim and the early-phase predictions have independent content, but the demonstrated object-by-object composition difference is a fitted, density-conditional result, so the paper earns a moderate circularity score rather than a clean zero.
Assumptions & free parameters
free parameters (7)
- CSM density scale D' =
0.4, 1.6, 6.4 in grid; 4.0 for SN 2006jc and SN 2022ablq; 2.3 for SN 2019hgp
- CSM density power-law index s =
3 in most models; 2.9 for SN 2019hgp
- Ejecta mass Mej =
2-6 Msun in grid; 6 Msun for SN 2006jc and SN 2022ablq; 3 Msun for SN 2019hgp
- Ejecta kinetic energy Ekin,ej =
1 B in reference grid; 0.8 B for SN 2006jc; 0.6 B for SN 2022ablq; 2.5 B for SN 2019hgp
- CSM composition mass fractions (He, C, O) =
Reference (0.5, 0.25, 0.25); inferred (0.4, 0.3, 0.3) for SN 2006jc and (0.95, 0.025, 0.025) for SN 2022ablq
- CSM velocity VCSM =
1000 km/s in reference; 3000 km/s for SN 2006jc; 1500 km/s for SN 2022ablq
- Critical ionization parameter xi for C/O K-shell ionization =
100-200
assumptions (10)
- domain assumption SNe Ibn/Icn are powered solely by SN-CSM interaction; radioactive decay is negligible
- domain assumption CSM density follows a single power law rho_CSM proportional to r^-s with s approximately 3
- domain assumption Outer ejecta density power-law index n = 7 for a compact Wolf-Rayet-like progenitor
- domain assumption Electrons and ions reach thermal equilibrium immediately at the shock front
- domain assumption Reverse-shock X-ray emission is negligible; forward-shock free-free emission dominates
- domain assumption Half of isotropically emitted X-rays go outward (factor 0.5 in eq. 8)
- ad hoc to paper Shocked-region ionization follows a temperature-binned ladder: neutral below 1e4 K, He-like until 1e7 K, fully ionized above
- ad hoc to paper Unshocked CSM is effectively neutral in Sections 3-4, and photoionization in Section 5 is treated with an ionization parameter using unabsorbed luminosity
- domain assumption CSM is composed of H-poor elements (He, C, O, Ne, Mg) with mass fractions guided by stellar evolution models
- standard math Coulomb logarithm ln Lambda = 30 and gaunt factor gff = 1
Cite this review
Pith. "Pith review of Insights into the Properties of Type Ibn/Icn Supernovae and Their Progenitor Channels through X-ray Emission." pith.science (2026). https://pith.science/paper/KYN2XJZX
@misc{pith2026241209066,
  author       = {Pith},
  title        = {Pith review of: Insights into the Properties of Type Ibn/Icn Supernovae and Their Progenitor Channels through X-ray Emission},
  year         = {2026},
  howpublished = {\url{https://pith.science/paper/KYN2XJZX}},
  note         = {Machine review of arXiv:2412.09066}
}
read the original abstract
Type Ibn/Icn supernovae (SNe Ibn/Icn), which are characterized by narrow helium or carbon lines originated in hydrogen-poor dense circumstellar medium (CSM), provide new insights into the final evolution of massive stars. While SNe Ibn/Icn are expected to emit strong X-rays through the strong SN-CSM interaction, the X-ray emission modeling effort has been limited so far. In the present study, we provide broad-band X-ray light curve (LC) predictions for SNe Ibn/Icn. We find that the soft X-ray LC provides information about the CSM compositions, while the hard X-ray LC is a robust measure of the CSM density, the explosion energy, and the ejecta mass. In addition, considering the evolution of the ionization state in the unshocked CSM, a bright soft X-ray is expected in the first few days since the explosion, which encourages rapid X-ray follow-up observations as a tool to study the nature of SNe Ibn/Icn. Applying our model to the soft X-ray LCs of SNe Ibn 2006jc and 2022ablq, we derive that the CSM potentially contains a larger fraction of carbon and oxygen for SN 2006jc than 2022ablq, highlighting the power of the soft X-ray modeling to address the nature of the CSM. We also discuss detectability and observational strategy, with which the currently operating telescopes such as NuSTAR and Swift can offer an irreplaceable opportunity to explore the nature of these enigmatic rapid transients and their still-unclarified progenitor channel(s).
Figures


Figures from the paper (12 more)


Reference graph
Works this paper leans on
-
[1]
Bell, A. R. 1978a, MNRAS, 182, 147, doi: 10.1093/mnras/182.2.147 —. 1978b, MNRAS, 182, 443, doi: 10.1093/mnras/182.3.443
-
[2]
J., Sollerman, J., Irani, I., et al
Brennan, S. J., Sollerman, J., Irani, I., et al. 2024, A&A, 684, L18, doi: 10.1051/0004-6361/202449350
-
[3]
2004, Spectrochimica Acta - Part B: Atomic Spectroscopy, 59, 1725, doi: 10.1016/j.sab.2004.03.014
Brunetti, A., Sanchez del Rio, M., Golosio, B., Simionovici, A., & Somogyi, A. 2004, Spectrochimica Acta - Part B: Atomic Spectroscopy, 59, 1725, doi: 10.1016/j.sab.2004.03.014
-
[4]
Chandra, P., Chevalier, R. A., Chugai, N., et al. 2012, ApJ, 755, 110, doi: 10.1088/0004-637X/755/2/110
-
[5]
Chevalier, R. A. 1982, ApJ, 258, 790, doi: 10.1086/160126
doi:10.1086/160126 1982
-
[6]
Chevalier, R. A., & Fransson, C. 2003, in Supernovae and Gamma-Ray Bursters, ed. K. Weiler, Vol. 598, 171–194, doi: 10.1007/3-540-45863-8 10 —. 2006, ApJ, 651, 381, doi: 10.1086/507606 —. 2017, in Handbook of Supernovae, ed. A. W. Alsabti & P. Murdin, 875, doi: 10.1007/978-3-319-21846-5 34
-
[7]
Chevalier, R. A., & Irwin, C. M. 2012, ApJL, 747, L17, doi: 10.1088/2041-8205/747/1/L17
-
[8]
Chugai, N. N. 2009, MNRAS, 400, 866, doi: 10.1111/j.1365-2966.2009.15506.x
arXiv 2009
Show all 60 references
- [9]
-
[10]
W., Taggart, K., Tinyanont, S., et al
Davis, K. W., Taggart, K., Tinyanont, S., et al. 2023, MNRAS, 523, 2530, doi: 10.1093/mnras/stad1433
2023 doi
-
[11]
Dessart, L., & Hillier, D. J. 2010, MNRAS, 405, 2141, doi: 10.1111/j.1365-2966.2010.16611.x
2010
-
[12]
J., & Kuncarayakti, H
Dessart, L., Hillier, D. J., & Kuncarayakti, H. 2022, A&A, 658, A130, doi: 10.1051/0004-6361/202142436
2022 doi
-
[13]
Drury, L. O. 1983, Reports on Progress in Physics, 46, 973, doi: 10.1088/0034-4885/46/8/002
1983 doi
-
[14]
1949, Physical Review, 75, 1169, doi: 10.1103/PhysRev.75.1169
Fermi, E. 1949, Physical Review, 75, 1169, doi: 10.1103/PhysRev.75.1169
1949 doi
-
[15]
Filippenko, A. V. 1997, ARA&A, 35, 309, doi: 10.1146/annurev.astro.35.1.309
1997 doi
-
[16]
J., Smith, N., Ganeshalingam, M., et al
Foley, R. J., Smith, N., Ganeshalingam, M., et al. 2007, ApJL, 657, L105, doi: 10.1086/513145
2007 doi
-
[17]
1982, A&A, 111, 140
Fransson, C. 1982, A&A, 111, 140
1982
-
[18]
1998, ApJ, 509, 861, doi: 10.1086/306531
Fransson, C., & Bj¨ ornsson, C.-I. 1998, ApJ, 509, 861, doi: 10.1086/306531
1998 doi
-
[19]
Fransson, C., Lundqvist, P., & Chevalier, R. A. 1996, ApJ, 461, 993, doi: 10.1086/177119
1996 doi
-
[20]
J., et al
Fransson, C., Ergon, M., Challis, P. J., et al. 2014, ApJ, 797, 118, doi: 10.1088/0004-637X/797/2/118
2014 doi
-
[21]
2021, Transient Name Server AstroNote, 76, 1
Gal-Yam, A., Yaron, O., Pastorello, A., et al. 2021, Transient Name Server AstroNote, 76, 1
2021
-
[22]
2022, Nature, 601, 201, doi: 10.1038/s41586-021-04155-1
Gal-Yam, A., Bruch, R., Schulze, S., et al. 2022, Nature, 601, 201, doi: 10.1038/s41586-021-04155-1
2022 doi
-
[23]
2020, ApJ, 889, 170, doi: 10.3847/1538-4357/ab6328
Gangopadhyay, A., Misra, K., Hiramatsu, D., et al. 2020, ApJ, 889, 170, doi: 10.3847/1538-4357/ab6328
2020 doi
-
[24]
1976, ApJ, 206, 847, doi: 10.1086/154448
Hatchett, S., Buff, J., & McCray, R. 1976, ApJ, 206, 847, doi: 10.1086/154448
1976 doi
-
[25]
2017, ApJ, 836, 158, doi: 10.3847/1538-4357/836/2/158
Hosseinzadeh, G., Arcavi, I., Valenti, S., et al. 2017, ApJ, 836, 158, doi: 10.3847/1538-4357/836/2/158
2017 doi
-
[26]
2008, ApJL, 674, L85, doi: 10.1086/529373
Immler, S., Modjaz, M., Landsman, W., et al. 2008, ApJL, 674, L85, doi: 10.1086/529373
2008 doi
- [27]
-
[28]
Longair, M. S. 2011, High Energy Astrophysics
2011
-
[29]
2012, ApJ, 758, 81, doi: 10.1088/0004-637X/758/2/81 —
Maeda, K. 2012, ApJ, 758, 81, doi: 10.1088/0004-637X/758/2/81 —. 2013, ApJ, 762, 14, doi: 10.1088/0004-637X/762/1/14
2012 doi
-
[30]
2014, ApJ, 785, 95, doi: 10.1088/0004-637X/785/2/95
Fukazawa, Y. 2014, ApJ, 785, 95, doi: 10.1088/0004-637X/785/2/95
2014 doi
-
[31]
Maeda, K., & Moriya, T. J. 2022, ApJ, 927, 25, doi: 10.3847/1538-4357/ac4672
2022 doi
-
[32]
2019, ApJ, 885, 41, doi: 10.3847/1538-4357/ab4421
Matsuoka, T., Maeda, K., Lee, S.-H., & Yasuda, H. 2019, ApJ, 885, 41, doi: 10.3847/1538-4357/ab4421
2019 doi
-
[34]
J., & Maeda, K
Moriya, T. J., & Maeda, K. 2016, ApJ, 824, 100, doi: 10.3847/0004-637X/824/2/100
2016 doi
-
[35]
J., Maeda, K., Taddia, F., et al
Moriya, T. J., Maeda, K., Taddia, F., et al. 2013, MNRAS, 435, 1520, doi: 10.1093/mnras/stt1392 —. 2014, MNRAS, 439, 2917, doi: 10.1093/mnras/stu163
2013 doi
-
[36]
L., Renzo, M., et al
Morozova, V., Piro, A. L., Renzo, M., et al. 2015, ApJ, 814, 63, doi: 10.1088/0004-637X/814/1/63
2015 doi
-
[37]
Beacom, J. F. 2019, ApJ, 874, 80, doi: 10.3847/1538-4357/ab0422
2019 doi
-
[38]
2023, A&A, 673, A27, doi: 10.1051/0004-6361/202346084
Nagao, T., Kuncarayakti, H., Maeda, K., et al. 2023, A&A, 673, A27, doi: 10.1051/0004-6361/202346084
2023 doi
-
[39]
1988, Physics Reports, 163, 13, doi: https://doi.org/10.1016/0370-1573(88)90032-4
Nomoto, K., & Hashimoto, M. 1988, Physics Reports, 163, 13, doi: https://doi.org/10.1016/0370-1573(88)90032-4
1988 doi
-
[40]
2008, ApJ, 684, 1343, doi: 10.1086/589961
Nozawa, T., Kozasa, T., Tominaga, N., et al. 2008, ApJ, 684, 1343, doi: 10.1086/589961
2008 doi
-
[41]
O., Cameron, P
Ofek, E. O., Cameron, P. B., Kasliwal, M. M., et al. 2007, ApJL, 659, L13, doi: 10.1086/516749
2007 doi
-
[42]
O., Zoglauer, A., Boggs, S
Ofek, E. O., Zoglauer, A., Boggs, S. E., et al. 2014, ApJ, 781, 42, doi: 10.1088/0004-637X/781/1/42
2014 doi
-
[43]
J., Mattila, S., et al
Pastorello, A., Smartt, S. J., Mattila, S., et al. 2007, Nature, 447, 829, doi: 10.1038/nature05825
2007 doi
-
[44]
2008, MNRAS, 389, 113, doi: 10.1111/j.1365-2966.2008.13602.x
Pastorello, A., Mattila, S., Zampieri, L., et al. 2008, MNRAS, 389, 113, doi: 10.1111/j.1365-2966.2008.13602.x
2008
-
[45]
A., Terreran, G., et al
Pellegrino, C., Howell, D. A., Terreran, G., et al. 2022a, ApJ, 938, 73, doi: 10.3847/1538-4357/ac8ff6 18
-
[46]
A., Vink´ o, J., et al
Pellegrino, C., Howell, D. A., Vink´ o, J., et al. 2022b, ApJ, 926, 125, doi: 10.3847/1538-4357/ac3e63
- [47]
-
[48]
A., Sollerman, J., Schulze, S., et al
Perley, D. A., Sollerman, J., Schulze, S., et al. 2022, ApJ, 927, 180, doi: 10.3847/1538-4357/ac478e
2022 doi
-
[49]
2023, ApJL, 959, L10, doi: 10.3847/2041-8213/ad103d
Pursiainen, M., Leloudas, G., Schulze, S., et al. 2023, ApJL, 959, L10, doi: 10.3847/2041-8213/ad103d
2023 doi
-
[50]
B., & Lightman, A
Rybicki, G. B., & Lightman, A. P. 1979, Radiative processes in astrophysics
1979
-
[51]
2009, ApJ, 692, 546, doi: 10.1088/0004-637X/692/1/546
Sakon, I., Onaka, T., Wada, T., et al. 2009, ApJ, 692, 546, doi: 10.1088/0004-637X/692/1/546
2009 doi
-
[52]
2011, Spectrochimica Acta - Part B: Atomic Spectroscopy, 66, 776, doi: 10.1016/j.sab.2011.09.011
Schoonjans, T., Brunetti, A., Golosio, B., et al. 2011, Spectrochimica Acta - Part B: Atomic Spectroscopy, 66, 776, doi: 10.1016/j.sab.2011.09.011
2011 doi
-
[53]
K., Mauerhan, J., et al
Shivvers, I., Zheng, W. K., Mauerhan, J., et al. 2016, MNRAS, 461, 3057, doi: 10.1093/mnras/stw1528
2016 doi
-
[54]
D., et al
Shivvers, I., Zheng, W., Van Dyk, S. D., et al. 2017, MNRAS, 471, 4381, doi: 10.1093/mnras/stx1885
2017 doi
-
[55]
2014, ARA&A, 52, 487, doi: 10.1146/annurev-astro-081913-040025 —
Smith, N. 2014, ARA&A, 52, 487, doi: 10.1146/annurev-astro-081913-040025 —. 2017, in Handbook of Supernovae, ed. A. W. Alsabti & P. Murdin, 403, doi: 10.1007/978-3-319-21846-5 38
2014 doi
-
[56]
J., et al
Smith, N., Li, W., Foley, R. J., et al. 2007, ApJ, 666, 1116, doi: 10.1086/519949
2007 doi
-
[57]
2012, ApJ, 756, 173, doi: 10.1088/0004-637X/756/2/173
Stritzinger, M., Taddia, F., Fransson, C., et al. 2012, ApJ, 756, 173, doi: 10.1088/0004-637X/756/2/173
2012 doi
-
[58]
2020, MNRAS, 491, 6000, doi: 10.1093/mnras/stz3431
Podsiadlowski, P. 2020, MNRAS, 491, 6000, doi: 10.1093/mnras/stz3431
2020 doi
-
[59]
B., Tucker, W
Tarter, C. B., Tucker, W. H., & Salpeter, E. E. 1969, ApJ, 156, 943, doi: 10.1086/150026
1969 doi
-
[60]
2008, ApJ, 687, 1208, doi: 10.1086/591782
Tominaga, N., Limongi, M., Suzuki, T., et al. 2008, ApJ, 687, 1208, doi: 10.1086/591782
2008 doi
-
[61]
2021, ApJ, 914, 64, doi: 10.3847/1538-4357/abfaf8
Tsuna, D., Kashiyama, K., & Shigeyama, T. 2021, ApJ, 914, 64, doi: 10.3847/1538-4357/abfaf8
2021 doi
Reviewed August 11, 2026 · model on record in the stance chip above.
Discussion (0). Continue with ORCID to comment.