REVIEW 3 major objections 4 minor 1 cited by
Learning and Reconstructing Conflicts in O-RAN: A Graph Neural Network Approach
T0 review · 3 major / 4 minor · reviewed 2026-08-11 · deepseek-v4-flash
Pith's one-line read A GraphSAGE-based GNN reconstructs O-RAN conflict graphs from time-series data and labels direct, indirect, and implicit conflicts, reaching F1 = 1.0 on a synthetic model.
desk verdict Plausible problem, sensible direction, but the 100% result is an artifact of threshold fitting and a missing raw-correlation baseline. read the letter →
The pith
A machine-rendered reading of the paper's core claim, the machinery that carries it, and where it could break.
The reading
What carries the argument
The load-bearing object is a temporal graph $G_T=(V_T,E_T)$ whose vertices are time steps and whose feature vector $x_t$ concatenates the current values of all parameters and KPIs. Edges connect consecutive time steps, encoding the assumption that time step $t$ influences only $t+1$. GraphSAGE layers compute each vertex embedding as $h^{(k)}_{v_t} = \sigma(W_k \cdot \operatorname{mean}(\{h^{(k-1)}_{v_t}\} \cup \{h^{(k-1)}_u : u \in N(v_t)\}))$, and the network is trained with mean-squared error between the final embedding and the input feature vector. After training, pairwise correlations among final embeddings are computed across all parameter and KPI features, and a fixed threshold (0.5 in the main results) binarizes these correlations into the reconstructed adjacency matrix $\hat{A}$. Conflict labels are then read as graph motifs: two xApps sharing one parameter for direct, two parameters sharing one KPI for indirect, and a chain from an xApp through a parameter and KPI to a second xApp and its parameter for implicit.
What would settle it
Generate a synthetic O-RAN dataset in which a parameter and a KPI are strongly correlated only because both respond to an unobserved third variable, with no direct influence between them; if the thresholded correlation matrix from the trained GNN contains that edge, then the reconstruction and any conflict labels built on that edge are false positives.
Extended reading notes
Core claim
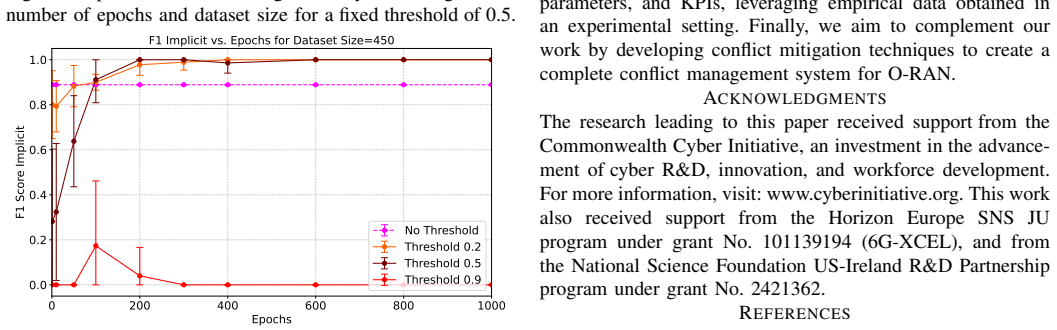
The central claim is that the hidden edges of an O-RAN conflict graph, specifically the influence of control parameters on KPIs, can be recovered from observed time series without knowing them in advance. The paper constructs a temporal graph whose vertices are time steps, each carrying a feature vector of parameter and KPI values, trains a GraphSAGE encoder with a reconstruction loss, and derives the adjacency matrix by thresholding pairwise correlations of the final embeddings. Known subscription edges between xApps and parameters or KPIs are then merged back into the matrix. On the adopted conflict model with four xApps, seven parameters, and four KPIs, the reconstructed graph matches the reference graph with F1 = 1.0 at 450 samples, 600 epochs, and threshold 0.5. Direct conflicts are labeled perfectly in all settings through subscription information; indirect conflicts require longer training, around 600 epochs, and implicit conflicts reach 100% detection at 450 samples, 200 epochs, and threshold 0.5.
Load-bearing premise
The entire reconstruction rests on treating sufficiently high pairwise correlations between learned embeddings as real influence edges between parameters and KPIs, and the paper itself concedes that correlation can be spurious and leaves causal learning to future work.
Editorial extensions
If this is right
- O-RAN operators could reconstruct the parameter-KPI influence graph from ordinary monitoring logs, removing the need to know or enumerate all conflicts before deployment.
- The three O-RAN conflict labels, direct, indirect, and implicit, become computable graph properties of the reconstructed adjacency matrix rather than manual expert assessments.
- Direct conflicts remain trivial because xApp subscription information already exposes them, so the practical value concentrates in the learned parameter-KPI edges that generate indirect and implicit conflicts.
- In the synthetic setup, dataset size beyond 450 samples gives little gain while epochs and threshold dominate accuracy, suggesting an operational recipe of long training with a moderate threshold.
- The reported 100% figures are F1 scores on a single synthetic Gaussian model; they establish feasibility on clean data, not a guarantee on arbitrary RAN traces.
Reading between the lines
- Because edges are defined by embedding correlation rather than causation, a latent common driver that moves a parameter and a KPI together without direct influence would likely appear as a false edge; this is the spurious-edge risk the paper itself flags, and causal discovery is the natural follow-up.
- The temporal graph assumes first-order Markov dependence between consecutive time steps; a testable extension is to include longer lags or attention over history and check whether reconstruction F1 improves on real traces with delayed KPI responses.
- GraphSAGE's inductive design suggests the trained encoder could be evaluated on an unseen O-RAN topology with new xApps or parameters, but the paper does not test that; a cheap experiment is a train/validation split across different conflict graphs.
- If the thresholding step is applied online, drift in KPI distributions could shift correlation magnitudes and require recalibration, so an adaptive threshold based on embedding statistics would be a practical robustness follow-up.
Editorial analysis
A structured set of objections, weighed in public.
Referee Report
Summary. The manuscript addresses conflict detection in O-RAN Near-RT RIC by proposing a GraphSAGE-based method that takes a temporal graph of observed control parameters and KPIs, learns vertex embeddings through an unsupervised reconstruction objective, computes pairwise correlations among features, thresholds those correlations to reconstruct parameter-KPI edges, and then labels direct, indirect, and implicit conflicts using graph motifs. Numerical evaluation is carried out on a synthetic dataset generated from a conflict model with four xApps, seven parameters, and four KPIs. The paper reports perfect F1 scores for graph reconstruction and for conflict labeling when at least 450 samples, 600 epochs, and a threshold of 0.5 are used.
Significance. If the central claim were established, this would be a useful step: conflict graphs are normally assumed known a priori, and a data-driven reconstruction method would support automated conflict detection for third-party xApps. The proposed conflict-labeling definitions are clearly stated and align with the O-RAN categories. The manuscript is clearly written and the synthetic setup is transparent. However, the current evaluation does not demonstrate that the GNN, rather than simple thresholded correlation on the raw data, is responsible for the reported performance; the main claims therefore require additional experiments before they can be accepted.
major comments (3)
- [Section V-B, Fig. 5] The reported 100% F1 is computed on the same synthetic dataset used to train the model and to select the correlation threshold, with no held-out test set or cross-validation. The threshold of 0.5, as well as the choices of 450 samples and 600 epochs, are selected after inspecting F1 against the known ground truth on this dataset, so the reported accuracy is an in-sample fit rather than a predictive performance estimate. Please provide an evaluation protocol that separates training, threshold selection, and testing, or justify why in-sample reconstruction accuracy is the relevant quantity for the paper's claims.
- [Section III, Eq. (2) and Fig. 5] The training objective minimizes reconstruction error between the input feature vector and the embedding, so an approximately identity mapping can achieve low loss; if the learned embeddings are close to the raw features, the pairwise correlations used for edge recovery are essentially Pearson correlations of the original parameter and KPI data. The only baseline shown is a uniformly random graph, which is much weaker than thresholded raw correlation. Please include a baseline that applies the same thresholding procedure directly to the original feature matrix, such as Pearson correlation of the raw x_t vectors, and report the F1 difference; without this baseline the claim that GraphSAGE learns the hidden parameter-KPI relationships is not supported.
- [Section V-A (network architecture)] The sentence stating that 'the input and output layers have sizes equal to the size of the dataset' is not meaningful in this context, because the input has 11 features and the dataset size varies across 50, 150, and 450 samples. This ambiguity makes it impossible to determine what representation is actually used for the correlation computation. Please specify the exact layer dimensions, the embedding dimension, and how the per-vertex embeddings are converted to the 11-by-11 feature correlation matrix shown in Fig. 4.
minor comments (4)
- [Section VI] The conclusion concedes that correlation-based edges can be spurious and that causal learning is future work; this concession should be moved earlier and linked to the evaluation, since it directly affects the confidence in all three conflict labels.
- [Section II] The problem statement says the objective is to estimate the full adjacency matrix A, but the method only infers parameter-KPI edges and fills in xApp-parameter and xApp-KPI edges from subscription information; please state this scope explicitly in the problem formulation.
- [Section IV (implicit conflict definition)] The implicit-conflict definition uses the edge e(k, a_j), which assumes a directed edge from a KPI to an xApp, but Fig. 1 and the subscription description suggest the opposite direction; the paper should define whether edges are directed or undirected and clarify the direction convention for all three edge types.
- [Fig. 4] The correlation matrices in Fig. 4 would benefit from a shared color scale and a short description of how the matrix is computed from the learned embeddings, such as Pearson correlation across time steps for each pair of features.
Circularity Check
Reported 100% conflict-graph reconstruction is an in-sample, threshold-fitted result that reduces to thresholded correlation of the input features by construction.
-
fitted input called prediction
[Section III (threshold choice); Section V-B, Fig. 6 (threshold sweep on the same data)]
"Finally, we apply a fixed threshold to binarize the correlations and obtain a reconstructed adjacency matrix, representing the conflict graph [11]. The fixed threshold is empirically chosen to balance sensitivity to weak correlations in the reconstructed conflict graph."
The threshold is 'empirically chosen' using the same generated dataset whose ground-truth conflict graph is known, and Figs. 5-6 then report F1 for thresholds (0.2, 0.5, 0.9) on that same data. No train/validation/test split is described. The 100% reconstruction accuracy is therefore the outcome of selecting the threshold on the evaluation set, i.e., a fitted value presented as achieved accuracy, not an independent prediction.
-
renaming known result
[Section III, Eq. (2) and the paragraph following it]
"Once our training is complete, the final embedding from the last training epoch encodes both the temporal relationships and feature dependencies. These embeddings are used to compute pairwise correlation across all features that describe the desired conflict graph."
The training objective (Eq. 2) is L_MSE = (1/|V_T|) sum over t of ||h^(K)_v_t - x_t||^2, i.e., the embedding is trained to reproduce the input feature vector x_t, which already contains all seven parameters and four KPIs. At the optimum the embeddings equal the inputs, so the 'learned' pairwise correlations are exactly (or very close to) Pearson correlations of the observed P/K values. The claimed reconstruction of hidden parameter-KPI edges is therefore thresholded raw correlation of the input by construction; the GNN is not shown to add anything beyond this, and the only baseline is a random graph (Fig. 5), not direct correlation.
full rationale
The paper is mostly self-contained and does not rely on load-bearing self-citation: GraphSAGE [8] and the conflict model [9] are external, and the conflict-label definitions are applied after reconstruction rather than trained with labels. However, the central reconstruction claim does not stand as an independent prediction. The GNN is trained to reconstruct its own input vectors (Eq. 2), so the final embeddings, and hence the pairwise correlations from which the adjacency matrix is obtained, reduce to (near-)raw correlations of the seven parameters and four KPIs in the training data. The fixed threshold is 'empirically chosen' on the same dataset whose ground-truth graph is known, and the F1 curves in Figs. 5-6 evaluate that same data with no described train/test split; the reported 100% accuracy is thus a fitted in-sample value rather than a predictive result. The paper itself concedes in Section VI that the approach needs future causal work for 'decreasing our dependency on correlation,' confirming that the present reconstruction is correlation-based. Because the central claim reduces by construction to thresholded input correlation plus threshold selection on the evaluation set, the circularity score is 6 rather than a lower score; the methodology is not circular in its definitions, but the headline accuracy is not an independent validation.
Assumptions & free parameters
free parameters (2)
- Correlation threshold =
0.5
- GNN hyperparameters (layers, hidden units, learning rate) =
3 layers, 16 hidden units, learning rate 0.001
assumptions (4)
- domain assumption Pairwise correlation of learned embeddings, after thresholding, identifies true parameter-KPI influence edges.
- domain assumption Temporal dependency is limited to consecutive time steps (Markovian).
- domain assumption The synthetic KPI equations from [9] faithfully represent the type of P-K relationships found in real O-RAN.
- domain assumption Conflict definitions from [4] and O-RAN specification [12] are the correct mapping from graph structure to O-RAN conflict types.
Cite this review
Pith. "Pith review of Learning and Reconstructing Conflicts in O-RAN: A Graph Neural Network Approach." pith.science (2026). https://pith.science/paper/FIJNNMSA
@misc{pith2026241214119,
  author       = {Pith},
  title        = {Pith review of: Learning and Reconstructing Conflicts in O-RAN: A Graph Neural Network Approach},
  year         = {2026},
  howpublished = {\url{https://pith.science/paper/FIJNNMSA}},
  note         = {Machine review of arXiv:2412.14119}
}
read the original abstract
The Open Radio Access Network (O-RAN) architecture enables the deployment of third-party applications on the RAN Intelligent Controllers (RICs). However, the operation of third-party applications in the Near Real-Time RIC (Near-RT RIC), known as xApps, may result in conflicting interactions. Each xApp can independently modify the same control parameters to achieve distinct outcomes, which has the potential to cause performance degradation and network instability. The current conflict detection and mitigation solutions in the literature assume that all conflicts are known a priori, which does not always hold due to complex and often hidden relationships between control parameters and Key Performance Indicators (KPIs). In this paper, we introduce the first data-driven method for reconstructing and labeling conflict graphs in O-RAN. Specifically, we leverage GraphSAGE, an inductive learning framework, to dynamically learn the hidden relationships between xApps, parameters, and KPIs. Our numerical results, based on a conflict model used in the O-RAN conflict management literature, demonstrate that our proposed method can effectively reconstruct conflict graphs and identify the conflicts defined by the O-RAN Alliance.
Figures


Figures from the paper (4 more)


Forward citations
Cited by 1 Pith paper
-
COMIX: Generalized Conflict Management in O-RAN xApps -- Architecture, Workflow, and a Power Control case
COMIX is a conflict detection and resolution framework for O-RAN xApps that uses a digital twin to evaluate conflicting power-control actions before applying them to the live network.
Reference graph
Works this paper leans on
-
[1]
Understanding O-RAN: Architecture, Interfaces, Al- gorithms, Security, and Research Challenges,
M. Polese et al. , “Understanding O-RAN: Architecture, Interfaces, Al- gorithms, Security, and Research Challenges,” IEEE Communications Surveys & Tutorials (COMST) , vol. 25, no. 2, pp. 1376–1411, 2023
work page 2023
-
[2]
OrchestRAN: Network Automation through Orchestrated Intelligence in the Open RAN,
S. D’Oro et al., “OrchestRAN: Network Automation through Orchestrated Intelligence in the Open RAN,” in IEEE Conference on Computer Communications (INFOCOM), 2022, pp. 270–279
work page 2022
-
[3]
Managing O-RAN Networks: xApp Development from Zero to Hero,
J. F. Santos et al., “Managing O-RAN Networks: xApp Development from Zero to Hero,” 2024. [Online]. Available: https://arxiv.org/abs/2407.09619
arXiv 2024
-
[4]
PACIFISTA: Conflict Evaluation and Management in Open RAN,
P. B. del Prever et al. , “PACIFISTA: Conflict Evaluation and Management in Open RAN,” 5 2024. [Online]. Available: http: //arxiv.org/abs/2405.04395
-
[5]
Conflict Management in the Near-RT-RIC of Open RAN: A Game Theoretic Approach,
A. Wadud et al. , “Conflict Management in the Near-RT-RIC of Open RAN: A Game Theoretic Approach,” in IEEE International Conferences on Internet of Things (iThings) and IEEE Green Computing & Commu- nications (GreenCom) and IEEE Cyber, Physical & Social Computing (CPSCom) and IEEE Smart Data (SmartData) and IEEE Congress on Cybermatics (Cybermatics), 2023...
work page 2023
-
[6]
Team Learning-Based Resource Allocation for Open Radio Access Network (O-RAN),
H. Zhang et al. , “Team Learning-Based Resource Allocation for Open Radio Access Network (O-RAN),” in IEEE International Conference on Communications (ICC), 2022, pp. 4938–4943
work page 2022
-
[7]
Conflict Mitigation Framework and Conflict Detection in O-RAN Near-RT RIC,
C. Adamczyk and A. Kliks, “Conflict Mitigation Framework and Conflict Detection in O-RAN Near-RT RIC,” IEEE Communications Magazine (ComMag), vol. 61, no. 12, pp. 199–205, 2023
work page 2023
-
[8]
Inductive Representation Learning on Large Graphs,
W. Hamilton et al., “Inductive Representation Learning on Large Graphs,” Advances in Neural Information Processing Systems (NeurIPS) , vol. 30, 2017
work page 2017
Show all 12 references
-
[9]
Toward Control and Coordination in Cognitive Autonomous Networks,
A. Banerjee et al. , “Toward Control and Coordination in Cognitive Autonomous Networks,” IEEE Transactions on Network and Service Management (TNSM), vol. 19, no. 1, pp. 49–60, 2021
2021
-
[10]
TimeGNN: Temporal Dynamic Graph Learning for Time Series Forecasting,
N. Xu et al., “TimeGNN: Temporal Dynamic Graph Learning for Time Series Forecasting,” in Springer International Conference on Complex Networks and Their Applications (COMPLEX NETWORKS) , 2023, pp. 87–99
2023
-
[11]
Karl Pearson and the Correlation Curve,
S. Blyth, “Karl Pearson and the Correlation Curve,” JSTOR International Statistical Review (ISR) , pp. 393–403, 1994
1994
-
[12]
Near-RT RIC Architecture,
O-RAN Working Group 3, “Near-RT RIC Architecture,” O-RAN Al- liance, Tech. Rep., Jun. 2024
2024
Reviewed August 11, 2026 · model on record in the stance chip above.
Discussion (0). Continue with ORCID to comment.