REVIEW 3 major objections 4 minor 101 references
Multi-frequency Radio Observations of the Dissociative Cluster Merger CIZA J0107.7+5408
T0 review · 3 major / 4 minor · reviewed 2026-08-11 · deepseek-v4-flash
Pith's one-line read In the merging cluster CIZA0107, a 340 MHz radio edge coincides with a weak shock, while the 3 GHz emission shows no edge.
desk verdict Solid new radio data and a real frequency-dependent edge; the X-ray shock coincidence is suggestive but needs an independent wedge and a corrected Mach-number error. read the letter →
The pith
A machine-rendered reading of the paper's core claim, the machinery that carries it, and where it could break.
The reading
What carries the argument
The argument rests on four linked pieces: matched-resolution, point-source-subtracted VLA images at 340 MHz and 3 GHz; a spectral index map and a spectral-tomography separation that divide the emission into a flatter diffuse component and steeper ultra-steep-spectrum components; an X-ray surface-brightness profile extracted in a wedge centered on the radio edge and fit with a projected broken power law; and the standard hydrodynamic shock jump conditions used to convert the fitted density jump into a Mach number. The broken power law is the load-bearing identity: it turns a visual radio edge into a quantitative X-ray shock candidate, while the spectral tomography identifies the edge with the steep-spectrum synchrotron plasma and not with the flatter, GHz-bright emission.
What would settle it
Re-extract the X-ray surface-brightness profile in a wedge defined without reference to the radio image, over the full southern quadrant; if the density jump at $\sim$3 arcmin disappears, the claimed edge-shock coincidence collapses.
Extended reading notes
Core claim
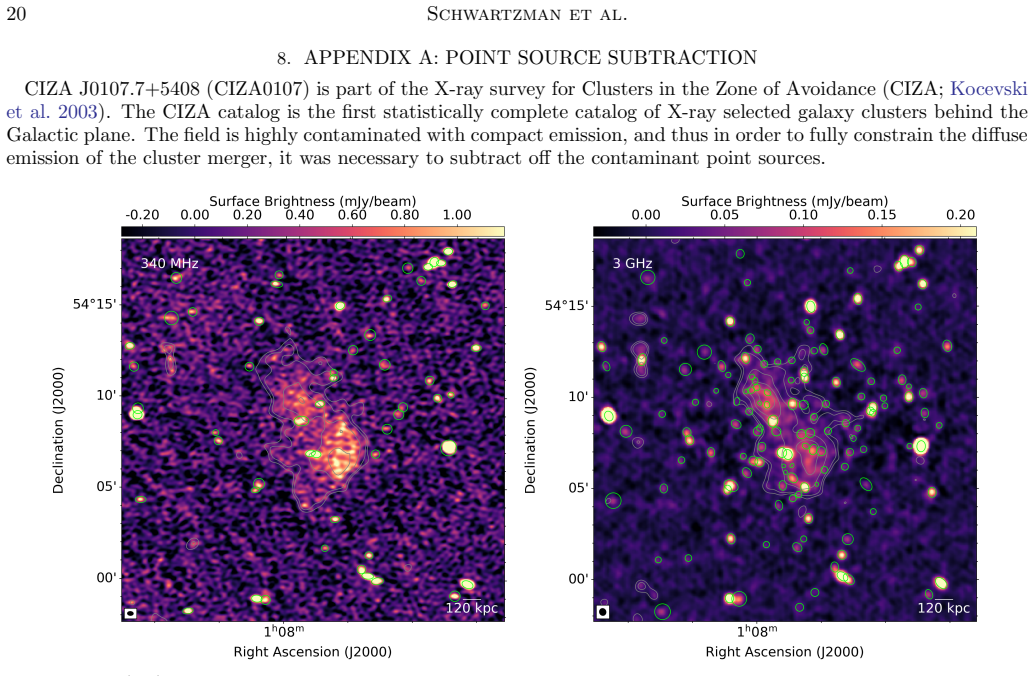
At 340 MHz the diffuse radio emission associated with the southwestern subcluster ends in a sharp surface-brightness drop, and this radio edge is spatially coincident with an X-ray surface-brightness discontinuity and a region of elevated gas temperature identified in earlier X-ray data. A projected broken-power-law fit to the X-ray profile gives a density compression $C = 1.3 \pm 0.12$, which through the standard shock jump conditions for $\gamma = 5/3$ corresponds to a weak shock with Mach number $M = 1.2 \pm 0.6$. The same region imaged at 3 GHz shows no edge-like feature and the emission extends beyond the shock. The paper confirms steep-spectrum emission ($\alpha \sim -1.3$) over $\sim$0.5 Mpc scales in both subclusters, measures two ultra-steep-spectrum regions with $\alpha \sim -2.2$ and $\sim -2.9$ between 74 and 340 MHz, and uses spectral tomography to show that the 340 MHz edge traces the steep-spectrum component. It concludes that the edge is best understood as a fossil-plasma boundary rather than a standard shock-accelerated relic, while the overall diffuse emission could be either a double radio halo or two projected relics.
Load-bearing premise
The load-bearing premise is that the X-ray surface-brightness discontinuity is a real shock front rather than a fitting artifact or projection effect, because the wedge used for the X-ray profile was chosen specifically where the radio edge had already been seen and the fitted Mach number, $M = 1.2 \pm 0.6$, is within one $\sigma$ of no shock at all.
Editorial extensions
If this is right
- The standard radio halo-shock edge and radio relic interpretations would need revision, because a low-frequency-only edge is a morphology that must be explained by electron aging and re-acceleration physics.
- The two ultra-steep-spectrum regions, with $\alpha \sim -2.2$ and $-2.9$, are superimposed on flatter diffuse emission, so single-frequency surveys at GHz wavelengths could miss the fossil component entirely.
- If the diffuse emission is a double radio halo, CIZA0107 would be a rare post-merger example rather than a pre-merger pair; if it is two projected relics, the relics are about an order of magnitude under-luminous relative to established scaling relations.
- The lack of a detected counter-shock in the northeast, combined with the likely line-of-sight merger geometry, means the system's true Mach number is probably higher than the observed $M \sim 1.2$, weakening simple estimates of shock acceleration efficiency.
Reading between the lines
- We infer that low-frequency-only radio edges may be common in post-merger clusters and are currently missed by surveys at 1-3 GHz; a systematic 150-400 MHz survey of dissociative mergers could reveal a population of fossil-plasma edges.
- We infer that the degeneracy between a double halo and a projected double relic could be broken by deep polarization imaging: halos are typically unpolarized while relics show roughly 30% polarization, and no such measurement yet exists for CIZA0107.
- We infer that if the edge is re-energized fossil AGN plasma, deeper low-frequency imaging should show the ultra-steep-spectrum regions extending to or beyond the shock front, and may reveal faint detached radio lobes outside the current 74 MHz contours.
Editorial analysis
A structured set of objections, weighed in public.
Referee Report
Summary. The paper presents new VLA 340 MHz (P-band) and 3 GHz (S-band) observations of the dissociative cluster merger CIZA J0107.7+5408. After point-source subtraction and matched-resolution imaging, the authors confirm ~0.5 Mpc diffuse steep-spectrum emission (alpha ~ -1.3) in both subclusters, measure integrated fluxes and spectral indices, identify two ultra-steep-spectrum regions with alpha < -2, and use spectral tomography to separate flatter and steeper components. The central new morphological claim is a sharp 340 MHz radio edge in the southwest that is spatially coincident with a candidate weak shock (M ~ 1.2) inferred from a Chandra surface-brightness discontinuity, while the 3 GHz emission shows no corresponding edge and extends beyond the shock. The paper concludes that the system may host a double radio halo or two projected relics, and that the 340 MHz edge may be an extension of the northwestern ultra-steep-spectrum emission related to a compressed fossil electron population.
Significance. If the edge-shock association is accepted, CIZA0107 would be an unusual system: a low-frequency-only radio edge coincident with a weak X-ray shock, in tension with standard relic and halo-shock-edge scenarios, and relevant to models of electron re-acceleration and fossil plasma compression. The radio products themselves are a genuine strength: the 340 MHz edge is visible even in the non-point-source-subtracted image, the 3 GHz comparison is made at matched resolution, integrated flux errors include flux-scale uncertainties, and the ultra-steep-spectrum fits are clearly documented. The paper's weakest load-bearing element is the X-ray shock analysis in Section 5, which is not independent of the radio detection and whose quoted Mach-number uncertainty is not internally consistent with the stated density-jump error. The direct radio measurements and the frequency-dependent morphology are solid; the shock coincidence and the phoenix interpretation built on it currently need either re-analysis or a clearly downgraded status.
major comments (3)
- [Section 5, Figure 6B; Section 7, bullet 4] The X-ray surface-brightness profile is extracted in a wedge 'guided by the radio observations' (Section 5), and a broken power law is then fitted to that selected wedge. The resulting discontinuity at r_model = 3.02' therefore cannot be regarded as an independent confirmation of a shock at the radio edge. The conclusion bullet in Section 7 states without caveat that 'we have identified an X-ray surface brightness discontinuity at the radio edge,' which overstates what a radio-selected wedge can establish. I recommend fitting the profile in several wedges defined blind to the radio feature, checking stability with respect to wedge boundaries, and reporting the change in chi^2 with the number of free parameters, or explicitly presenting the X-ray result as a candidate that requires independent confirmation.
- [Section 5, Equation (1), Figure 6C] Propagating C = 1.3 +/- 0.12 through Equation (1) yields M = 1.20 +/- 0.08, not +/- 0.6. The quoted +/- 0.6 is not derivable from the stated density-jump uncertainty. If +/- 0.6 is intended to include projection or systematic effects, that derivation should be given. As written, the significance of the shock is ambiguous: with +/- 0.6, M is consistent with no shock (M = 1) at the 1-sigma level, while with +/- 0.08 the density jump is precise but still measured only in a radio-selected wedge. In addition, the comparison between the broken power law (reduced chi^2 = 1.004) and the single beta model (reduced chi^2 = 1.29) is reported without Delta-chi^2, degrees of freedom, or a parameter penalty, so the claim that the broken power law is 'statistically better' is not quantitatively supported.
- [Section 6.1.1] The phoenix/compression interpretation is built on the edge-shock coincidence: the text proposes that the ultra-steep-spectrum emission has been adiabatically compressed and re-energized by the passage of the shock. If the X-ray discontinuity is not robust, is a fitting artifact, or is strongly affected by projection, this scenario loses its main observational support. The frequency-dependent morphology itself (a 340 MHz edge with no corresponding 3 GHz edge) is an interesting result independent of the shock, and the discussion should be reorganized so that the radio-only morphology is presented as the secure finding, with the shock association and the phoenix scenario explicitly labeled as speculative pending an independent X-ray analysis. The paper does note the possible line-of-sight merger component from Finner et al. (2023), but this caveat is used mainly to explain a low Mach number rather than as a test of the association.
minor comments (4)
- [Section 5, Equation (1)] The sentence 'where 1/C is equivalent to the gas density ratio rho_2/rho_1' appears to invert the ratio: for C = rho_2/rho_1 > 1, the Rankine-Hugoniot relation gives rho_1/rho_2 on the left-hand side of Equation (1). Please correct the notation or define C as the pre-to-post-shock density ratio.
- [Section 4.2.1, Figure 4] The spectral-tomography coefficients A and B are described only as chosen to avoid negative residuals; for reproducibility, state the numerical values and the exact subtraction equations, even if the figure is intended for qualitative illustration.
- [Section 6.1.3, Figure 8B] For the individual subclusters, the text reports Spearman coefficients of 0.34 and 0.40 but does not report the individual p-values that accompany those coefficients; adding them would make the point-to-point correlation results fully comparable to the whole-cluster result.
- [References] The van Weeren et al. (2019) reference appears twice in the reference list with different journal formatting (SSRv 215, 16 and Space Science Reviews 215); these entries should be merged.
Circularity Check
No significant circularity: all quantitative claims are direct measurements or independent fits, with no parameter defined from the quantity it is used to predict; the radio-guided X-ray wedge is a selection caveat, not a definitional circularity.
full rationale
The paper's quantitative results—340 MHz and 3 GHz integrated fluxes, spectral indices between 74 MHz and 3 GHz, USS component slopes, and the X-ray surface brightness broken-power-law fit—are direct measurements from archival or new data. No equation is defined in terms of the quantity it claims to predict. The spectral tomography coefficients A and B are explicitly used for qualitative display only and do not enter any numerical claim. The X-ray wedge is admittedly 'guided by the radio observations,' so the subsequent 'coincidence' between the fitted break radius and the radio edge is not an independent blind detection; however, the broken-power-law fit is not forced by construction to place a break at the radio edge, and no parameter is fitted to the edge position and then renamed a prediction. Prior results from R16 and Finner et al. (2023), some with overlapping authors, are used as supporting data (temperature map, 74 MHz contours, lensing geometry) rather than as a uniqueness or existence theorem that alone forces the paper's interpretation. The mismatch between the stated Mach-number uncertainty (±0.6) and simple error propagation from C = 1.3 ± 0.12 (~±0.08) is a statistical reporting issue, not circularity. No load-bearing self-citation chain or ansatz-smuggling step was found; the central radio-edge morphology claim rests on the directly imaged 340 MHz drop-off and the matched-resolution absence of a 3 GHz edge, both of which are independent of the fitted X-ray parameters.
Assumptions & free parameters
free parameters (2)
- Spectral tomography subtraction coefficient A =
Not quoted numerically; chosen as the maximum fraction subtracted without creating negative residuals
- Spectral tomography subtraction coefficient B =
Not quoted numerically; chosen as the maximum fraction subtracted without creating negative residuals
assumptions (5)
- domain assumption Flat Lambda-CDM cosmology with Omega_L = 0.69, Omega_m = 0.31, H0 = 67.7 km/s/Mpc
- standard math Rankine-Hugoniot jump conditions with adiabatic index gamma = 5/3
- domain assumption Synchrotron power-law model S_nu proportional to nu^alpha
- domain assumption Broken power-law model projected on the sky for the X-ray surface brightness profile
- domain assumption The 74 MHz VLSSr 3-sigma contours delineate the ultra-steep-spectrum regions
invented entities (1)
-
Unseen fossil relativistic electron population in the southwestern subcluster
Cite this review
Pith. "Pith review of Multi-frequency Radio Observations of the Dissociative Cluster Merger CIZA J0107.7+5408." pith.science (2026). https://pith.science/paper/C4Q3ANQY
@misc{pith2026241215015,
  author       = {Pith},
  title        = {Pith review of: Multi-frequency Radio Observations of the Dissociative Cluster Merger CIZA J0107.7+5408},
  year         = {2026},
  howpublished = {\url{https://pith.science/paper/C4Q3ANQY}},
  note         = {Machine review of arXiv:2412.15015}
}
abstract
We present new radio observations of the galaxy cluster merger CIZA J0107.7+5408 (CIZA0107), a large, roughly equal mass, post-core passage, dissociative binary system at z = 0.1066. CIZA0107 is an elongated, disturbed system, hosting two subclusters with optical galaxy number density peaks offset from their associated X-ray density peaks and double-peaked diffuse radio structure. We present new 240-470 MHz and 2.0-4.0 GHz Very Large Array observations of CIZA0107. We image the diffuse emission at high resolution, constrain its integrated spectrum, and map the spectral index distribution. We confirm the presence of steep-spectrum ($\alpha$ $\sim$ -1.3) emission on a scale of about 0.5 Mpc in both subclusters. We identify two smaller ultra-steep spectrum ($\alpha$ $<$ -2) regions, superimposed on larger-scale radio emission associated with the southwestern subcluster. At 340 MHz, we detect a radio edge bounding the emission to the south and show that it is coincident with a weak (M $\sim$ 1.2) shock identified in the Chandra image. At 3 GHz, the emission does not show any corresponding edge-like feature, and in fact it extends beyond the shock. We investigate the nature of the emission in CIZA0107 and find that, while the system may host a double halo structure, we cannot rule out a scenario in which the emission arises from two relics projected on the central cluster regions.
Figures


Figures from the paper (5 more)


Reference graph
Works this paper leans on
-
[1]
Akamatsu , H., van Weeren , R. J., Ogrean , G. A., et al. 2015, , 582, A87, 10.1051/0004-6361/201425209
-
[2]
Astropy Collaboration , Price-Whelan , A. M., Sip o cz , B. M., et al. 2018, , 156, 123, 10.3847/1538-3881/aabc4f
-
[3]
Baars , J. W. M., Genzel , R., Pauliny-Toth , I. I. K., & Witzel , A. 1977, , 61, 99
1977
-
[4]
2024, , 686, A5, 10.1051/0004-6361/202347965
Balboni , M., Gastaldello , F., Bonafede , A., et al. 2024, , 686, A5, 10.1051/0004-6361/202347965
-
[5]
1987, , 154, 1, 10.1016/0370-1573(87)90134-7
Blandford , R., & Eichler , D. 1987, , 154, 1, 10.1016/0370-1573(87)90134-7
-
[6]
1999, Astroparticle Physics, 12, 169, 10.1016/S0927-6505(99)00079-1
Blasi , P., & Colafrancesco , S. 1999, Astroparticle Physics, 12, 169, 10.1016/S0927-6505(99)00079-1
-
[7]
2010, , 18, 127, 10.1007/s00159-009-0023-3
B \"o hringer , H., & Werner , N. 2010, , 18, 127, 10.1007/s00159-009-0023-3
-
[8]
Bonafede , A., Intema , H. T., Br \"u ggen , M., et al. 2014, , 785, 1, 10.1088/0004-637X/785/1/1
Show all 101 references
-
[9]
2022, , 933, 218, 10.3847/1538-4357/ac721d
Bonafede , A., Brunetti , G., Rudnick , L., et al. 2022, , 933, 218, 10.3847/1538-4357/ac721d
2022 doi
-
[10]
2020, , 634, A64, 10.1051/0004-6361/201936216
Botteon , A., Brunetti , G., Ryu , D., & Roh , S. 2020, , 634, A64, 10.1051/0004-6361/201936216
2020 doi
-
[11]
2016 a , , 460, L84, 10.1093/mnrasl/slw082
Botteon , A., Gastaldello , F., Brunetti , G., & Dallacasa , D. 2016 a , , 460, L84, 10.1093/mnrasl/slw082
2016 doi
-
[12]
2016 b , Galaxies, 4, 68, 10.3390/galaxies4040068
---. 2016 b , Galaxies, 4, 68, 10.3390/galaxies4040068
2016 doi
-
[13]
2016 c , , 463, 1534, 10.1093/mnras/stw2089
Botteon , A., Gastaldello , F., Brunetti , G., & Kale , R. 2016 c , , 463, 1534, 10.1093/mnras/stw2089
2016 doi
-
[14]
W., Bonafede , A., et al
Botteon , A., Shimwell , T. W., Bonafede , A., et al. 2018, , 478, 885, 10.1093/mnras/sty1102
2018 doi
-
[15]
J., Eckert , D., et al
Botteon , A., van Weeren , R. J., Eckert , D., et al. 2024, , 690, A222, 10.1051/0004-6361/202451293
2024 doi
-
[16]
2011, , 412, 2, 10.1111/j.1365-2966.2010.17738.x
Brown , S., & Rudnick , L. 2011, , 412, 2, 10.1111/j.1365-2966.2010.17738.x
2011
-
[17]
Brunetti , G., Cappi , M., Setti , G., Feretti , L., & Harris , D. E. 2001 a , , 372, 755, 10.1051/0004-6361:20010484
2001 doi
-
[18]
Brunetti , G., & Jones , T. W. 2014, International Journal of Modern Physics D, 23, 1430007, 10.1142/S0218271814300079
2014 doi
-
[19]
2001 b , , 320, 365, 10.1046/j.1365-8711.2001.03978.x
Brunetti , G., Setti , G., Feretti , L., & Giovannini , G. 2001 b , , 320, 365, 10.1046/j.1365-8711.2001.03978.x
2001
-
[20]
G., Bonafede , A., Botteon , A., et al
Campitiello , M. G., Bonafede , A., Botteon , A., et al. 2024, , 683, A9, 10.1051/0004-6361/202346591
2024 doi
-
[21]
2014, , 783, 91, 10.1088/0004-637X/783/2/91
Caprioli , D., & Spitkovsky , A. 2014, , 783, 91, 10.1088/0004-637X/783/2/91
2014 doi
-
[22]
2022, , 134, 114501, 10.1088/1538-3873/ac9642
CASA Team , Bean , B., Bhatnagar , S., et al. 2022, , 134, 114501, 10.1088/1538-3873/ac9642
2022 doi
-
[23]
2013, , 777, 141, 10.1088/0004-637X/777/2/141
Cassano , R., Ettori , S., Brunetti , G., et al. 2013, , 777, 141, 10.1088/0004-637X/777/2/141
2013 doi
-
[24]
J., Cotton , W
Condon , J. J., Cotton , W. D., Greisen , E. W., et al. 1998, , 115, 1693, 10.1086/300337
1998 doi
-
[25]
Cornwell , T. J. 2008, IEEE Journal of Selected Topics in Signal Processing, 2, 793, 10.1109/JSTSP.2008.2006388
2008
-
[26]
2013, Obit: Radio Astronomy Data Handling , Astrophysics Source Code Library, record ascl:1307.008
Cotton , B. 2013, Obit: Radio Astronomy Data Handling , Astrophysics Source Code Library, record ascl:1307.008. 1307.008
2013
-
[27]
2021, , 647, A51, 10.1051/0004-6361/202039208
Cuciti , V., Cassano , R., Brunetti , G., et al. 2021, , 647, A51, 10.1051/0004-6361/202039208
2021 doi
-
[28]
A., van Weeren , R
de Gasperin , F., Ogrean , G. A., van Weeren , R. J., et al. 2015, , 448, 2197, 10.1093/mnras/stv129
2015 doi
-
[29]
J., Br \"u ggen , M., et al
de Gasperin , F., van Weeren , R. J., Br \"u ggen , M., et al. 2014, , 444, 3130, 10.1093/mnras/stu1658
2014 doi
-
[30]
2022, , 659, A146, 10.1051/0004-6361/202142658
de Gasperin , F., Rudnick , L., Finoguenov , A., et al. 2022, , 659, A146, 10.1051/0004-6361/202142658
2022 doi
- [31]
-
[32]
2018, , 620, A25, 10.1051/0004-6361/201832801
Di Gennaro , G., Venturi , T., Dallacasa , D., et al. 2018, , 620, A25, 10.1051/0004-6361/201832801
2018 doi
-
[33]
J., Rudnick , L., et al
Di Gennaro , G., van Weeren , R. J., Rudnick , L., et al. 2021, , 911, 3, 10.3847/1538-4357/abe620
2021 doi
-
[34]
2021, , 500, 795, 10.1093/mnras/staa3018
Dominguez-Fernandez , P., Bruggen , M., Vazza , F., et al. 2021, , 500, 795, 10.1093/mnras/staa3018
2021 doi
-
[35]
Dutta , S., Singh , V., Chandra , C. H. I., et al. 2023, , 944, 176, 10.3847/1538-4357/acaf01
2023 doi
-
[36]
R., & Tully , R
Ebeling , H., Mullis , C. R., & Tully , R. B. 2002, , 580, 774, 10.1086/343790
2002 doi
-
[37]
2020, The Open Journal of Astrophysics, 3, 12, 10.21105/astro.2009.13944
Eckert , D., Finoguenov , A., Ghirardini , V., et al. 2020, The Open Journal of Astrophysics, 3, 12, 10.21105/astro.2009.13944
2020 arXiv
- [38]
-
[39]
A., & Gopal-Krishna
En lin , T. A., & Gopal-Krishna . 2001, , 366, 26, 10.1051/0004-6361:20000198
2001 doi
-
[40]
2012, , 20, 54, 10.1007/s00159-012-0054-z
Feretti , L., Giovannini , G., Govoni , F., & Murgia , M. 2012, , 20, 54, 10.1007/s00159-012-0054-z
2012 doi
-
[41]
1949, Physical Review, 75, 1169, 10.1103/PhysRev.75.1169
Fermi , E. 1949, Physical Review, 75, 1169, 10.1103/PhysRev.75.1169
1949 doi
-
[42]
W., Jee , M
Finner , K., Randall , S. W., Jee , M. J., et al. 2023, , 942, 23, 10.3847/1538-4357/ac9fd3
2023 doi
-
[43]
1982, , 20, 547, 10.1146/annurev.aa.20.090182.002555
Forman , W., & Jones , C. 1982, , 20, 547, 10.1146/annurev.aa.20.090182.002555
1982
-
[44]
2008, , 486, 347, 10.1051/0004-6361:200809459
Giacintucci , S., Venturi , T., Macario , G., et al. 2008, , 486, 347, 10.1051/0004-6361:200809459
2008 doi
-
[45]
A., Feretti , L., & Giovannini , G
Govoni , F., En lin , T. A., Feretti , L., & Giovannini , G. 2001 a , , 369, 441, 10.1051/0004-6361:20010115
2001 doi
-
[46]
2001 b , , 376, 803, 10.1051/0004-6361:20011016
Govoni , F., Feretti , L., Giovannini , G., et al. 2001 b , , 376, 803, 10.1051/0004-6361:20011016
2001 doi
-
[47]
Greisen , E. W. 2003, in Astrophysics and Space Science Library, Vol. 285, Information Handling in Astronomy - Historical Vistas, ed. A. Heck , 109, 10.1007/0-306-48080-8_7
2003 doi
-
[48]
N., Shimwell , T
Hoang , D. N., Shimwell , T. W., van Weeren , R. J., et al. 2018, , 478, 2218, 10.1093/mnras/sty1123
2018 doi
-
[49]
2007, , 375, 77, 10.1111/j.1365-2966.2006.11111.x
Hoeft , M., & Br \"u ggen , M. 2007, , 375, 77, 10.1111/j.1365-2966.2006.11111.x
2007
-
[50]
2023, , 680, A31, 10.1051/0004-6361/202245102
Jones , A., de Gasperin , F., Cuciti , V., et al. 2023, , 680, A31, 10.1051/0004-6361/202245102
2023 doi
-
[51]
Kale , R., & Dwarakanath , K. S. 2012, , 744, 46, 10.1088/0004-637X/744/1/46
2012 doi
-
[52]
Kang , H., Ryu , D., & Jones , T. W. 2012, , 756, 97, 10.1088/0004-637X/756/1/97
2012 doi
- [53]
-
[54]
M., Rudnick , L., & Anderson , M
Katz-Stone , D. M., Rudnick , L., & Anderson , M. C. 1993, , 407, 549, 10.1086/172536
1993 doi
-
[55]
Kelly , B. C. 2007, , 665, 1489, 10.1086/519947
2007 doi
- [56]
-
[57]
D., Ebeling, H., & Mullis, C
Kocevski, D. D., Ebeling, H., & Mullis, C. R. 2003, Clusters in the Zone of Avoidance. astro-ph/0304453
2003 arXiv
-
[58]
V., & Borgani, S
Kravtsov, A. V., & Borgani, S. 2012, Annual Review of Astronomy and Astrophysics, 50, 353, 10.1146/annurev-astro-081811-125502
2012 doi
-
[59]
D., & Lifshitz , E
Landau , L. D., & Lifshitz , E. M. 1959, Fluid mechanics
1959
-
[60]
M., Cotton , W
Lane , W. M., Cotton , W. D., van Velzen , S., et al. 2014, , 440, 327, 10.1093/mnras/stu256
2014 doi
-
[61]
2024, , 686, A55, 10.1051/0004-6361/202348194
Lee , W., Pillepich , A., ZuHone , J., et al. 2024, , 686, A55, 10.1051/0004-6361/202348194
2024 doi
-
[62]
T., van Weeren , R
Mandal , S., Intema , H. T., van Weeren , R. J., et al. 2020, , 634, A4, 10.1051/0004-6361/201936560
2020 doi
- [64]
-
[65]
2007, Physics Reports, 443, 1, 10.1016/j.physrep.2007.01.001
Markevitch, M., & Vikhlinin, A. 2007, Physics Reports, 443, 1, 10.1016/j.physrep.2007.01.001
2007 doi
-
[66]
2022, , 516, 5289, 10.1093/mnras/stac2276
McDonald , W., Obreschkow , D., & Garratt-Smithson , L. 2022, , 516, 5289, 10.1093/mnras/stac2276
2022 doi
-
[67]
2015, PyBDSF: Python Blob Detection and Source Finder , Astrophysics Source Code Library, record ascl:1502.007
Mohan , N., & Rafferty , D. 2015, PyBDSF: Python Blob Detection and Source Finder , Astrophysics Source Code Library, record ascl:1502.007. 1502.007
2015
-
[68]
2010, , 509, A86, 10.1051/0004-6361/200913414
Murgia , M., Govoni , F., Feretti , L., & Giovannini , G. 2010, , 509, A86, 10.1051/0004-6361/200913414
2010 doi
- [69]
-
[70]
2024 a , P-band CASA Guide 5.0
National Radio Astronomy Observatory (NRAO) . 2024 a , P-band CASA Guide 5.0. https://casaguides.nrao.edu/index.php?title=CASA_Guides:P-band_casa_guide_5.0
2024
-
[71]
2024 b , Flux Density Scale
---. 2024 b , Flux Density Scale. https://science.nrao.edu/facilities/vla/docs/manuals/oss/performance/fdscale
2024
-
[72]
R., McKinley , B., Hurley-Walker , N., et al
Offringa , A. R., McKinley , B., Hurley-Walker , N., et al. 2014, , 444, 606, 10.1093/mnras/stu1368
2014 doi
- [73]
-
[74]
2021, Astronomische Nachrichten, 342, 1166, 10.1002/asna.20210078
Patil , P., Whittle , M., Nyland , K., et al. 2021, Astronomische Nachrichten, 342, 1166, 10.1002/asna.20210078
2021 doi
- [75]
-
[76]
Pearce , C. J. J., van Weeren , R. J., Andrade-Santos , F., et al. 2017, , 845, 81, 10.3847/1538-4357/aa7e2f
2017 doi
- [77]
- [78]
-
[79]
Pfrommer , C., & En lin , T. A. 2004, Journal of Korean Astronomical Society, 37, 455, 10.5303/JKAS.2004.37.5.455
2004 doi
-
[80]
P., & Pfrommer , C
Pinzke , A., Oh , S. P., & Pfrommer , C. 2013, , 435, 1061, 10.1093/mnras/stt1308
2013 doi
-
[81]
2020, , 641, A6, 10.1051/0004-6361/201833910
Planck Collaboration , Aghanim , N., Akrami , Y., et al. 2020, , 641, A6, 10.1051/0004-6361/201833910
2020 doi
-
[82]
2009, Monthly Notices of the Royal Astronomical Society, 399, 410, 10.1111/j.1365-2966.2009.15290.x
Planelles, S., & Quilis, V. 2009, Monthly Notices of the Royal Astronomical Society, 399, 410, 10.1111/j.1365-2966.2009.15290.x
2009
-
[83]
J., et al
Rajpurohit , K., Hoeft , M., van Weeren , R. J., et al. 2018, , 852, 65, 10.3847/1538-4357/aa9f13
2018 doi
-
[84]
2020, , 642, L13, 10.1051/0004-6361/202039165
Rajpurohit , K., Vazza , F., Hoeft , M., et al. 2020, , 642, L13, 10.1051/0004-6361/202039165
2020 doi
-
[85]
2023, , 669, A1, 10.1051/0004-6361/202244925
Rajpurohit , K., Osinga , E., Brienza , M., et al. 2023, , 669, A1, 10.1051/0004-6361/202244925
2023 doi
-
[86]
W., Clarke, T
Randall, S. W., Clarke, T. E., van Weeren, R. J., et al. 2016, The Astrophysical Journal, 823, 94, 10.3847/0004-637x/823/2/94
2016 doi
-
[87]
Sarazin , C. L. 1988, X-ray emission from clusters of galaxies
1988
-
[88]
Sarazin , C. L. 2002, in Astrophysics and Space Science Library, Vol. 272, Merging Processes in Galaxy Clusters, ed. L. Feretti , I. M. Gioia , & G. Giovannini , 1--38, 10.1007/0-306-48096-4_1
2002 doi
- [89]
-
[90]
2022, , 935, L23, 10.3847/2041-8213/ac86d4
Sarkar , A., Randall , S., Su , Y., et al. 2022, , 935, L23, 10.3847/2041-8213/ac86d4
2022 doi
-
[91]
W., Brown , S., Feain , I
Shimwell , T. W., Brown , S., Feain , I. J., et al. 2014, , 440, 2901, 10.1093/mnras/stu467
2014 doi
-
[92]
Taylor , M. B. 2005, in Astronomical Society of the Pacific Conference Series, Vol. 347, Astronomical Data Analysis Software and Systems XIV, ed. P. Shopbell , M. Britton , & R. Ebert , 29
2005
-
[93]
2004, , 350, 1397, 10.1111/j.1365-2966.2004.07736.x
Tormen , G., Moscardini , L., & Yoshida , N. 2004, , 350, 1397, 10.1111/j.1365-2966.2004.07736.x
2004
-
[94]
2020, , 890, 148, 10.3847/1538-4357/ab6bca
Umetsu , K., Sereno , M., Lieu , M., et al. 2020, , 890, 148, 10.3847/1538-4357/ab6bca
2020 doi
-
[95]
u ggen , M., R \
van Weeren , R. J., Br \"u ggen , M., R \"o ttgering , H. J. A., & Hoeft , M. 2011 a , Journal of Astrophysics and Astronomy, 32, 505, 10.1007/s12036-011-9108-2
2011 doi
-
[96]
u ggen , M., R \
van Weeren , R. J., Br \"u ggen , M., R \"o ttgering , H. J. A., et al. 2011 b , , 533, A35, 10.1051/0004-6361/201117149
2011 doi
-
[98]
J., de Gasperin, F., Akamatsu, H., et al
van Weeren, R. J., de Gasperin, F., Akamatsu, H., et al. 2019, Space Science Reviews, 215, 10.1007/s11214-019-0584-z
2019 doi
-
[99]
o ttgering , H. J. A., & Br \
van Weeren , R. J., R \"o ttgering , H. J. A., & Br \"u ggen , M. 2011 c , , 527, A114, 10.1051/0004-6361/201015991
2011 doi
-
[100]
J., Brunetti , G., Br \"u ggen , M., et al
van Weeren , R. J., Brunetti , G., Br \"u ggen , M., et al. 2016, , 818, 204, 10.3847/0004-637X/818/2/204
2016 doi
-
[101]
J., Andrade-Santos , F., Dawson , W
van Weeren , R. J., Andrade-Santos , F., Dawson , W. A., et al. 2017, Nature Astronomy, 1, 0005, 10.1038/s41550-016-0005
2017 doi
-
[102]
Wang , Q. H. S., Giacintucci , S., & Markevitch , M. 2018, , 856, 162, 10.3847/1538-4357/aab2aa
2018 doi
-
[103]
2012, The Merger Dynamics of the X-Ray-Emitting Plasma in Clusters of Galaxies (Springer Nature Singapore), 1–44, 10.1007/978-981-16-4544-0_124-1
ZuHone, J., & Su, Y. 2012, The Merger Dynamics of the X-Ray-Emitting Plasma in Clusters of Galaxies (Springer Nature Singapore), 1–44, 10.1007/978-981-16-4544-0_124-1
2012 doi
Reviewed August 11, 2026 · model on record in the stance chip above.
Discussion (0). Continue with ORCID to comment.