REVIEW 4 major objections 4 minor 1 cited by
Rapid Climate Model Downscaling to Assess Risk of Extreme Rainfall in Bangladesh in a Warming Climate
T0 review · 4 major / 4 minor · reviewed 2026-08-11 · deepseek-v4-flash
Pith's one-line read Under the highest-emissions scenario, Bangladesh's 100-year daily rainfall is projected to be about 50 mm/day higher by mid-century and up to 100 mm/day higher by 2100.
desk verdict A useful multi-model, multi-scenario ensemble projection of Bangladesh rainfall extremes, but the headline return-level increases rest on an untested stationarity assumption that the paper itself flags. read the letter →
The pith
A machine-rendered reading of the paper's core claim, the machinery that carries it, and where it could break.
The reading
What carries the argument
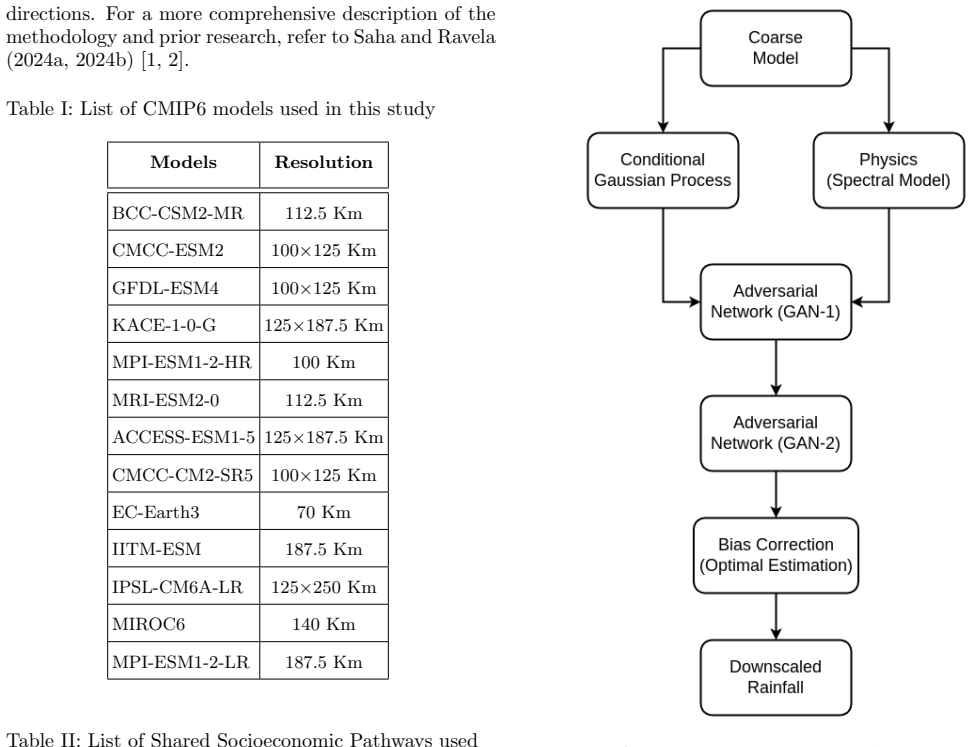
The central mechanism is a fixed downscaling function that combines three components: an ensemble-approximated conditional Gaussian process regressor that gives a first-guess rainfall field, a linear spectral orographic-precipitation model that injects terrain-driven structure, and two stacked generative adversarial networks (machine-learning pairs of a generator and a discriminator) that refine the field first to an intermediate resolution and then to the final high-resolution grid, followed by an optimal-estimation bias correction tuned to observed return levels. The function is trained on 1981-2019 data and then applied unchanged to each model and scenario, so the whole future-risk argument rides on this transfer.
What would settle it
Train the identical downscaling function on the 1981-1999 period and validate its extreme-rainfall return levels against observed data for 2000-2019; systematically growing error with warming would falsify the stationarity assumption and undermine the 50/100 mm/day projections. Alternatively, compare the paper's downscaled future return levels against those from a high-resolution regional climate model run for the same emissions scenarios; divergence would call the projections into question.
Extended reading notes
Core claim
The paper establishes that a two-stage adversarial downscaling system—first from a coarse meteorological reanalysis to an intermediate land reanalysis, then from upscaled observations to the native high-resolution grid—can turn coarse climate-model rainfall into realistic high-resolution fields, and that this transfer holds when the same trained function is applied to thirteen global climate models under four emissions scenarios. In the present climate, the downscaled fields match observed spatial patterns and generalized-Pareto return-level curves far better than the coarse model alone. Under future scenarios, the downscaled ensemble projects a nationwide rise in 100-year daily rainfall maxima, strongest in the northeast hilly region and the southeast coast; for the highest-emissions scenario the 100-year event intensity increases by roughly 50 mm/day by mid-century and 100 mm/day by end-century. The paper reports that inter-model and inter-scenario spread is large and that the same downscaling function is assumed to remain valid in a warmer climate.
Load-bearing premise
The whole future projection rests on the assumption that the statistical relationship between coarse-scale weather and local rainfall learned from 1981-2019 data stays the same in a warmer climate; if it changes, the projected 100-year return-level increases would be systematically biased.
Editorial extensions
If this is right
- Under the highest-emissions scenario, the 100-year daily rainfall maximum in Bangladesh increases by about 50 mm/day by mid-century and about 100 mm/day by end-century, relative to 1985-2014.
- Under the two lower-emissions scenarios, the mid-century increase does not grow much further by end-century, suggesting that limiting emissions would cap the rise in extreme-rainfall risk.
- The largest increases are concentrated in the northeastern hilly region and the southeastern coastal zone, regions already exposed to floods and cyclones.
- Coarse model output underestimates present-day extreme risk, while the downscaled fields track observed return levels, so risk assessments based on raw coarse output would understate future hazard.
- The multi-model, multi-scenario ensemble yields explicit uncertainty bounds on future return levels, allowing adaptation plans to be stress-tested against the spread rather than a single projection.
Reading between the lines
- Because the paper applies one fixed downscaling function to all future climates, its numbers depend on the stationarity assumption; a natural stress test is to train on an early period and validate on a later observed period, something the paper leaves for future work.
- The speed of the method suggests it could be transferred to other data-sparse, flood-prone regions, provided a high-resolution observed rainfall record exists for training; that extension is not in the paper.
- The large inter-model spread means that for adaptation decisions, the scenario and model uncertainty may dominate the downscaling uncertainty, so robust-decision approaches may be more appropriate than point estimates.
Signed reviews
Editorial analysis
A structured set of objections, weighed in public.
Referee Report
Summary. The paper applies the authors' previously developed statistical-physical adversarial downscaling method (Saha and Ravela, 2024a,b) to outputs from thirteen CMIP6 ScenarioMIP models over Bangladesh, producing 0.05° daily rainfall fields for the present climate and for four SSP scenarios through 2100. It validates the downscaling against CHIRPS and ERA5/ERA5-Land in the present climate (Figures 2–4), then uses the same downscaling function to project extreme rainfall risk. The central quantitative claim is that the 100-year return level of daily maximum rainfall increases by roughly 50 mm/day by mid-century and 100 mm/day by end-century under SSP5-8.5, with the largest increases in northeastern and southeastern Bangladesh. The authors explicitly acknowledge in Section IV that the stationarity of the downscaling function requires further validation.
Significance. If the projections are robust, the paper provides actionable, high-resolution risk information for a highly climate-vulnerable region and demonstrates a computationally efficient way to downscale a multi-model, multi-scenario ensemble. Strengths include the physics-plus-adversarial-learning formulation, the use of thirteen CMIP6 models and four SSPs, the present-day validation showing clear improvement over coarse ERA5 in capturing extreme rainfall risk, and the candid discussion of limitations. The paper's value, however, hinges on the untested assumption that the downscaling function trained on 1981–2019 data remains valid in future climates; the headline numbers are conditional on this invariance and on the adequacy of the return-level extrapolation from short records.
major comments (4)
- [Section II, 'Data and Methods'] The load-bearing assumption is stated as: 'The same downscaling function is used for present and future climate projections, assuming that the downscaling function remains unchanged in the warming scenario.' The present-day validation (Figure 4) cannot constrain this assumption, because each CMIP6 model's present-day output is individually bias-corrected against observations; agreement in the historical period can be achieved even if the learned coarse-to-fine relationship does not generalize. The authors acknowledge in Section IV that this invariance 'requires further validation,' but no validation or sensitivity analysis is provided. I ask the authors to add a concrete test—for example, training on historical CMIP6 data and comparing against observations, using a pseudo-reality experiment with high-resolution future simulations, or at least quantifying how the projected return-level increments change when the training period or downscaling architecture is varied. Without this, the 50/100 mm/day increments are unsupported beyond the assumption.
- [Figures 5–6 and abstract] The headline increases are 100-year return levels fitted from 20–30 year periods (1985–2014, 2031–2050, 2081–2100) using a two-parameter Generalized Pareto distribution. The paper does not report confidence intervals for the fitted return levels or the extrapolation uncertainty; the shaded regions in Figures 5–6 show only inter-model spread, not GP parameter uncertainty or the uncertainty from extrapolating to a 100-year return period. Please provide uncertainty bounds on the fitted return levels (e.g., via bootstrapping as in Figure 4) and state the threshold used for the GP fits. Without this, the quantitative 50/100 mm/day claims are not adequately supported.
- [Section III, 'Results'] The statement 'Since present climate data is individually bias-corrected against observations for each model, the variation between models is minimal' indicates that the bias-correction step removes inter-model differences in the present climate. If the same optimal-estimation bias correction is applied to future projections using present-climate statistics, it may also suppress or distort part of the climate-change signal if model biases are non-stationary. Please clarify how the bias correction is applied in the future period—whether it uses only present-climate statistics—and discuss the potential distortion of the projected change signal. A sensitivity test that applies the bias correction only to the present period and leaves future fields uncorrected would help bound this effect.
- [Sections II and III] The manuscript does not specify precisely how the return levels are computed from the downscaled daily fields: are they derived from annual maxima, peaks over threshold, or daily regional maxima pooled across the domain, and over what spatial aggregation? The abstract's phrase 'daily maximum rainfall for a 100-year return period' is ambiguous. Please define the variable, the spatial pooling, and the fitting procedure (including threshold selection and number of exceedances) in Section II or III. This information is necessary to interpret Figures 4–8 and to assess the statistical reliability of the extrapolation.
minor comments (4)
- [Section II] The scenario list contains the typo 'SSSP3-7.0'; it should read 'SSP3-7.0'.
- [Figure 2 and accompanying text] The text says 'shown in Figure 2f, is upscaled in Figure 2d, and then downscaled to Figure 2e by GAN-2,' but the figure caption does not list a panel (d) and appears to skip it, and the panel order in the caption is (a), (b), (c), (e), (f), (g). Please correct the panel labels and the cross-references.
- [Data Availability Statement] The data availability statement mentions HighResMIP data, but the manuscript uses ScenarioMIP CMIP6 data; this appears to be a leftover from the authors' previous work and should be updated.
- [References] Reference [2] is an arXiv preprint (arXiv:2408.11790) and reference [11] is a prior paper by one of the authors; if the journal requires, please provide a more complete description of the method in the main text so readers are not forced to consult both prior papers to understand the downscaling pipeline.
Circularity Check
No significant circularity: the future return-level changes are outputs of a fixed downscaling map applied to CMIP6 future fields, not refitted targets; the stated stationarity assumption is a validity limitation, not a definitional loop.
full rationale
The paper's derivation chain is: (1) train a two-stage GAN downscaling map and bias correction on 1981–2019 ERA5/ERA5-Land and CHIRPS data; (2) apply the same fixed map to coarse CMIP6 historical and future ScenarioMIP fields; (3) fit Generalized Pareto distributions to the downscaled daily maxima and read off 100-year return levels. The headline quantities—about 50 mm/day by mid-century and 100 mm/day by end-century under SSP5-8.5—are not inputs to the training; they emerge from the CMIP6 future forcing fields passed through the trained map. The only explicit invariance assumption, 'The same downscaling function is used for present and future climate projections, assuming that the downscaling function remains unchanged in the warming scenario,' is a stated stationarity hypothesis, and the authors flag in the Discussion that it 'requires further validation.' An untested assumption is a robustness limitation, not circularity, because the future target was never used to fit the downscaling function. The paper relies heavily on the authors' prior method papers (Saha and Ravela 2024a,b), but it re-describes the method and supplies present-climate checks against CHIRPS and ERA5-Land; self-citation alone is not a circular derivation. The GAN-2 stage is trained to map upscaled CHIRPS to original CHIRPS, so in-sample resemblance to CHIRPS is partly by construction, but the risk validation in Figure 4 uses downscaled ERA5 fields and held-out years, and the future projection is not a refit of CHIRPS. No equation or fitted parameter is reused as the prediction target.
Assumptions & free parameters
free parameters (2)
- Downscaling model parameters (GAN-1, GAN-2, conditional Gaussian process, optimal estimation bias correction) =
not reported
- Generalized Pareto shape and scale parameters for each model, scenario, and period =
not reported
assumptions (4)
- domain assumption The downscaling function trained on present-day data remains valid under future climate change.
- domain assumption CMIP6 historical and scenario simulations at coarse resolution are adequate representations of large-scale meteorology driving local rainfall.
- standard math Generalized Pareto distribution is an appropriate model for daily rainfall maxima and permits extrapolation to 100-year return levels from about 20-30 years of data.
- domain assumption CHIRPS and ERA5-Land are accurate enough as high-resolution reference rainfall fields for training and validation.
Cite this review
Pith. "Pith review of Rapid Climate Model Downscaling to Assess Risk of Extreme Rainfall in Bangladesh in a Warming Climate." pith.science (2026). https://pith.science/paper/GBCN23XH
@misc{pith2026241216407,
  author       = {Pith},
  title        = {Pith review of: Rapid Climate Model Downscaling to Assess Risk of Extreme Rainfall in Bangladesh in a Warming Climate},
  year         = {2026},
  howpublished = {\url{https://pith.science/paper/GBCN23XH}},
  note         = {Machine review of arXiv:2412.16407}
}
read the original abstract
As climate change drives an increase in global extremes, it is critical for Bangladesh, a nation highly vulnerable to these impacts, to assess future risks for effective adaptation and mitigation planning. Downscaling coarse-resolution climate models to finer scales is essential for accurately evaluating the risk of extremes. In this study, we apply our downscaling method, which integrates data, physics, and machine learning, to quantify the risks of extreme precipitation in Bangladesh. The proposed approach successfully captures the observed spatial patterns and risks of extreme rainfall in the current climate while generating risk and uncertainty estimates by efficiently downscaling multiple models under future climate scenarios. Our findings project that the risk of extreme rainfall rises across the country, with the most significant increases in the northeastern hilly and southeastern coastal areas. Projections show that the daily maximum rainfall for a 100-year return period could increase by approximately 50 mm/day by mid-century and around 100 mm/day by the end of the century. However, substantial uncertainties remain due to variations across multiple climate models and scenarios.
Figures


Figures from the paper (4 more)


Forward citations
Cited by 1 Pith paper
-
A Root-Zone Soil Salinity Observatory for Coastal Southwest Bangladesh
A new 162-site topsoil salinity dataset for coastal southwest Bangladesh shows EC from 0.05 to 9.09 mS/cm with a north-south increasing gradient.
Reference graph
Works this paper leans on
-
[1]
A fast statistical model (iterative ensemble- approximated conditional Gaussian process regressor) to derive a “first-guess” downscaled rainfall field [1, 6, 7]
-
[2]
A simplified physics-based model (spectral method) to estimate orography-induced precipitation [8]
-
[3]
an adversarial network (GAN-1) that combines these two fields and produces an improved downscaled rainfall field at 0 .1◦ resolution [1]
-
[4]
Another adversarial network (GAN-2) that downscales the rainfall field to 0 .05◦ resolution [2]
-
[5]
An optimal estimation-based bias correction [2]. Priming the downscaling model with statistics and physics-derived rainfall fields [8] improves the physical consistency and alleviates data paucity issues. Two-step adversarial learning addresses the lack of correspondence between model and data and captures high-frequency details in the downscaled field. B...
-
[6]
Statistical-physical adversarial learning from data and models for downscaling rainfall extremes
Anamitra Saha and Sai Ravela. Statistical-physical adversarial learning from data and models for downscaling rainfall extremes. Journal of Advances in Modeling Earth Systems , 16(6):e2023MS003860, 2024
work page 2024
-
[7]
Anamitra Saha and Sai Ravela. Rapid statistical-physical adversarial downscaling reveals bangladesh’s rising rainfall risk in a warming climate. arXiv:2408.11790, 2024
arXiv 2024
-
[8]
Chris Funk, Pete Peterson, Martin Landsfeld, Diego Pedreros, James Verdin, Shraddhanand Shukla, Gregory Husak, James Rowland, Laura Harrison, Andrew Hoell, et al. The climate hazards infrared precipitation with stations—a new environmental record for monitoring extremes. Scientific data , 2(1):1–21, 2015
work page 2015
Show all 18 references
-
[9]
The era5 global reanalysis
Hans Hersbach, Bill Bell, Paul Berrisford, Shoji Hirahara, Andr´ as Hor´ anyi, Joaqu ´ ın Mu˜ noz-Sabater, Julien Nicolas, Carole Peubey, Raluca Radu, Dinand Schepers, et al. The era5 global reanalysis. Quarterly Journal of the Royal Meteorological Society , 146(730): 1999–2049, 2020
1999
-
[10]
Mu˜ noz-Sabater, E
J. Mu˜ noz-Sabater, E. Dutra, A. Agust ´ ı-Panareda, C. Albergel, G. Arduini, G. Balsamo, S. Boussetta, M. Choulga, S. Harrigan, H. Hersbach, B. Martens, D. G. Miralles, M. Piles, N. J. Rodr ´ ıguez-Fern´ andez, E. Zsoter, C. Buontempo, and J.-N. Th´ epaut. Era5-land: a state-...
2021 doi
-
[11]
Fast ensemble smoothing
Sai Ravela and Dennis McLaughlin. Fast ensemble smoothing. Ocean Dynamics, 57(2):123–134, 2007
2007
-
[12]
Informative neural ensemble kalman learning
Margaret Trautner, Gabriel Margolis, and Sai Ravela. Informative neural ensemble kalman learning. arXiv:2008.09915, 2020
2008 arXiv
-
[13]
A linear theory of orographic precipitation
Ronald B Smith and Idar Barstad. A linear theory of orographic precipitation. Journal of the Atmospheric Sciences, 61(12):1377–1391, 2004
2004
-
[14]
Retrieval of atmospheric temperature and composition from remote measurements of thermal radiation
Clive D Rodgers. Retrieval of atmospheric temperature and composition from remote measurements of thermal radiation. Reviews of Geophysics , 14(4):609–624, 1976
1976
-
[15]
The scenario model intercomparison project (scenariomip) for cmip6
Brian C O’Neill, Claudia Tebaldi, Detlef P Van Vuuren, Veronika Eyring, Pierre Friedlingstein, George Hurtt, Reto Knutti, Elmar Kriegler, Jean-Francois Lamarque, Jason Lowe, et al. The scenario model intercomparison project (scenariomip) for cmip6. Geoscientific Model Developm...
2016
-
[16]
Can the weakening of indian monsoon be attributed to anthropogenic aerosols? Environmental Research Communications , 1 (6):061006, 2019
Anamitra Saha and Subimal Ghosh. Can the weakening of indian monsoon be attributed to anthropogenic aerosols? Environmental Research Communications , 1 (6):061006, 2019
2019
-
[17]
Spatial inference for coherent geophysical fluids by appearance and geometry
Sai Ravela. Spatial inference for coherent geophysical fluids by appearance and geometry. In IEEE Winter Conference on Applications of Computer Vision , pages 925–932. IEEE, 2014
2014
-
[18]
Dynamic data-driven deformable reduced models for coherent fluids
Sai Ravela. Dynamic data-driven deformable reduced models for coherent fluids. Procedia Computer Science, 51:2464–2473, 2015. 9
2015
Reviewed August 11, 2026 · model on record in the stance chip above.
Discussion (0). Continue with ORCID to comment.