REVIEW 4 major objections 5 minor 25 references
Functional structural equation modeling with latent variables
T0 review · 4 major / 5 minor · reviewed 2026-08-11 · deepseek-v4-flash
Pith's one-line read Functional structural equation models with Gaussian-process latent variables can be estimated from sparse and irregularly sampled longitudinal data using an EM algorithm with penalized smoothing.
desk verdict Genuinely new latent-variable FSEM with GP factors and sparse-data machinery, but the stated identification constraint is not enforced, leaving loadings and regression effects scale-unidentified until fixed. read the letter →
The pith
A machine-rendered reading of the paper's core claim, the machinery that carries it, and where it could break.
The reading
What carries the argument
The load-bearing machinery is the conversion of functional latent-variable models into multivariate Gaussian models through basis expansions. Latent curves and residual curves are represented by coefficients in a common basis, and their covariance operators are encoded by Karhunen-Loève eigenfunctions and eigenvalues, so the measurement and structural equations become linear regressions with block matrices that depend on the observed design points. This makes the complete-data log-likelihood Gaussian, so the E-step reduces to computing conditional means and covariances of the latent curves, and the M-step reduces to ridge-type penalized least squares with derivative-based penalty matrices. The recursive structural assumption and the weight matrix $W_{\eta}$, which encodes which latent factors influence which, tie the latent curves together and determine their joint covariance; the paper presents the choice of $W_{\eta}$ as crucial and case-specific.
What would settle it
Simulate data with two latent curves that feed back on each other, fit the proposed EM with a recursive $W_{\eta}$ that excludes the feedback, and check whether the factor-loading estimates stay unbiased and whether the goodness-of-fit indices detect the misspecification.
Extended reading notes
Core claim
On its own terms, the paper's central claim is that a recursive functional SEM with Gaussian-process latent factors admits a tractable likelihood-based estimation procedure. The measurement model expresses each observed indicator curve as a functional intercept plus fixed, concurrent, or historical effects of latent curves, and the structural model expresses each latent curve as a function of other latent curves and scalar or functional covariates. By expanding the curves in basis functions and using Karhunen-Loève expansions for the residual and latent covariance operators, the infinite-dimensional model is turned into a finite-dimensional Gaussian model whose complete-data likelihood is tractable. The EM algorithm draws the unobserved latent curves from Gaussian generator distributions and updates the functional coefficients, covariance operators, and measurement-error variances in closed form, with smoothing penalties selected by cross-validation. Simulation results show accurate factor loadings and regression coefficients, and confidence bands with coverage close to 95%, under regular, irregular, and missing-at-random designs.
Load-bearing premise
The results depend on the analyst correctly specifying the recursive network among latent factors (the weight matrix $W_{\eta}$), and the paper gives no data-driven rule for this choice even though it determines the joint covariance of the latent curves.
Editorial extensions
If this is right
- Sparse and irregularly sampled longitudinal data can enter a latent-variable SEM directly, without imputation or pre-smoothing, as long as the missingness pattern is compatible with the model.
- Factor loadings can be time-varying or history-dependent, so the fitted measurement model can reveal how a latent trait relates to its indicators over time.
- Confidence bands around functional loadings and regression coefficients let practitioners decide whether apparent time dynamics are real rather than noise.
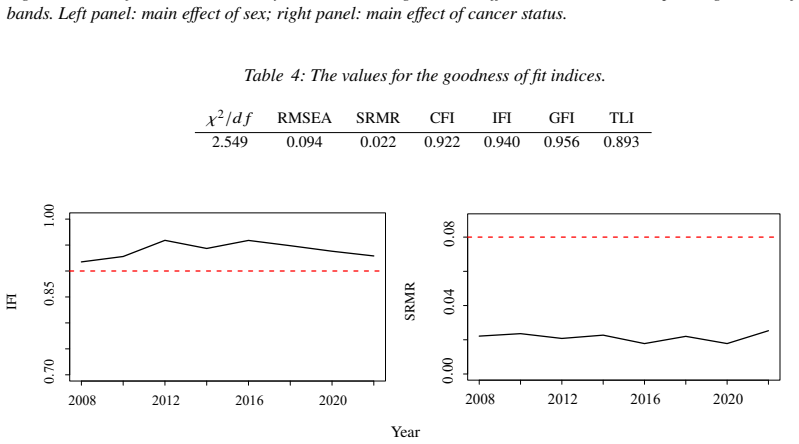
- The functional goodness-of-fit indices extend the standard SEM toolkit, allowing overall and pointwise assessment of model fit for curve-valued data.
- In the Health and Retirement Study application, the model recovers the expected Big Five pattern for the General Factor of Personality and a higher score for women, illustrating a concrete use.
Reading between the lines
- A data-driven procedure for selecting the recursive structure $W_{\eta}$—for example, cross-validating over candidate direction-of-effect matrices—would remove the main expert input the framework currently requires.
- The stated scalability limit suggests that variational or stochastic EM approximations would be needed before the method reaches the large panel datasets common in biobanks and administrative records.
- The same basis-expansion and EM machinery could plausibly be adapted to non-Gaussian functional indicators, such as binary symptom curves, by thresholding latent Gaussian processes as the authors mention as a future direction.
- The HRS sex difference should be read as a model demonstration rather than a causal finding, since the analysis assumes a particular recursive structure and item-parceled indicators.
Signed reviews
Editorial analysis
A structured set of objections, weighed in public.
Referee Report
Summary. This paper proposes a family of Functional Structural Equation Models (FSEMs) in which latent variables are Gaussian processes and indicators are observed sparsely or irregularly over a domain. The inferential framework is an EM algorithm with penalized likelihood and cross-validated smoothing, supplemented by bootstrap-based confidence bands and functional goodness-of-fit indices. The method is evaluated in two simulation studies and applied to Health and Retirement Study data to estimate a General Factor of Personality latent curve and its association with sex and cancer status.
Significance. If the identification and specification gaps are resolved, this would be a useful contribution to functional latent variable modeling: the framework is ambitious, handles sparse and irregular longitudinal data, provides uncertainty quantification, and the authors supply code for reproduction. The simulation studies cover several data designs and report coverage rates. However, the current manuscript does not yet support the central claims because the identification constraint stated in Section 2.2 is not enforced in the simulations or the application, leaving the reported parameter estimates and significance statements not well-defined. The abstract also claims a restricted maximum likelihood approach that is not implemented in the body of the paper.
major comments (4)
- [§2.2, Eq. (1); §6.1, Table 1; §7, Eq. (16)] The identification constraint announced in Section 2.2 is not enforced anywhere in the estimation. Section 2.2 states that Model (1) is identified only if the first factor loading is fixed to 1 or the latent variance constraint is imposed, and it commits to fixing the first loading. Yet Section 6.1 reports MSEs for lambda_1, lambda_2, and lambda_3 (Table 1), Section 6.2 reports MSEs for lambda_1, lambda_2, and lambda_3 (Table 3), and Section 7 fits all five loadings lambda_1,...,lambda_5 freely (Eq. (16), Figure 4). No alternative constraint on the latent scale is described. The measurement and structural models are scale-invariant: replacing eta by c*eta, lambda_j by lambda_j/c, and scaling Gamma_x and the covariance of zeta accordingly leaves the distribution of the observed data unchanged, so the likelihood is flat along this direction. In the simulations the data-generating process fixes the latent scale through the known covariance of eta, but the estimation method does not appear to use that knowledge, so the reported MSEs are not meaningful unless the estimated scale is aligned with the true scale. In the real-data analysis, no such alignment exists, so the loadings in Figure 4 and the significance statements about sex and cancer in Figure 5 are not for uniquely defined quantities. The authors must either impose the fixed-loading constraint (or the variance constraint) in the estimation, or explicitly show how the EM algorithm selects a unique point on the equivalence class.
- [Abstract; §3.1; §8] The abstract and introduction state that the inferential framework is 'based on a restricted maximum likelihood approach', but Section 3.1 presents an ordinary maximum-likelihood EM algorithm maximizing a complete-data log-likelihood, and Section 8 repeats that the paper proposes a maximum likelihood framework. There is no restricted/residual likelihood, no adjustment for estimation of fixed effects, and no discussion of REML in the estimation equations. Either the manuscript should implement and describe an actual REML procedure, or the claims in the abstract and introduction should be revised to say maximum likelihood. This is a load-bearing mismatch because the abstract explicitly names REML as the basis of the approach.
- [§3.2, Eq. (11) and following] The weight matrix W_eta is left unspecified. Section 3.2 defines the structural model as eta = Gamma_eta W_eta eta + Gamma_x x + zeta and derives the joint covariance Sigma_eta = (I - Gamma_eta W_eta)^{-1} diag{...} (I - Gamma_eta W_eta)^{-T}, then states that the selection of W_eta is 'quite crucial' and 'depends on the specific model, with the flexibility to vary on a case-by-case basis'. No rule or example is given for choosing W_eta in a recursive model, even though different choices change the implied joint distribution of the latent factors and can break the recursive structure on which the identification discussion relies. In the paper's own simulations and application q=1, so W_eta has no effect, but the general framework claims to cover q>1 recursive systems; without a concrete definition of W_eta, the general model is incomplete.
- [§2.3, Eq. (4)-(6)] The relationship between the fixed-effect terms f'_{ijm} and f_{ijm} is unclear and appears to duplicate the loading for the fixed effect. For the fixed effect, Appendix B gives f'_{ijm} = E^T eta_im and f_{ijm} = (I_M ⊗ eta_im)^T omega lambda_jm, with a'_{jm} + a_{jm} taking either 0 or 1. This suggests that f' encodes the first loading fixed to 1 and f encodes the free loading, but the notation is never explicitly tied to the identification constraint. The simulations in Section 6, however, estimate lambda_1 freely, so the intended meaning of f' versus f must be clarified, and the constraint used in estimation must be stated unambiguously.
minor comments (5)
- [§6.1] The text says the MSEs are computed 'using an MCMC algorithm with 200 iterations', but the paper describes a Monte Carlo EM algorithm and no MCMC sampler is specified. Please clarify the sampling scheme or correct the terminology.
- [Table 1] The columns labelled phi_11, nu_11, phi_21, etc. are not clearly identified in the text; the reader must infer that these are estimates of the first eigenfunction and eigenvalue of the residual covariance operators. A brief explanation in the text or table caption would improve readability.
- [§5] The degrees of freedom df = p(p+1)/2 - k for the fit indices counts k estimated parameters, but for functional parameters the number of estimated coefficients depends on the basis truncation and is not defined here. Please specify how k is computed for the functional FSEM.
- [§7] The HRS application uses J=6 basis functions with only eight time points, but no sensitivity analysis or discussion of the choice of J is provided. Since the results may depend on this truncation, a brief robustness check would strengthen the application.
- [§6.2] The text introduces K_zeta_m(s,t) = exp(-2m|t-s|) for m=1,2,3 although the simulation has q=1 latent factor; it is likely that these are intended to be the covariance kernels of the residual functions or of the unique factors, but the notation is inconsistent and should be corrected.
Circularity Check
No significant circularity: the FSEM estimation is a generative model fit with external benchmarks; the identification gap is a correctness risk, not a circular step.
full rationale
The derivation chain in the paper is self-contained rather than circular. The measurement model (equations 1–2) and structural model (equation 3) are stated as generative assumptions, and the truncated forms (equations 4–9) follow algebraically from basis expansions and Karhunen–Loève representations. The EM and penalized-likelihood updates in Section 3 are derived from the complete-data likelihood; no parameter is fitted to a subset of data and then reported as a prediction of a closely related quantity. In Simulation 1 and Simulation 2, data are generated from the same model class with known true loading functions, and the reported MSEs and coverage rates measure recovery of that known truth; this is a standard Monte Carlo calibration loop, not a circular prediction. The HRS application is compared to an external psychological benchmark (Funder, 1991) for the sign pattern of the Big Five loadings, so the substantive finding is externally falsifiable. The only self-citation to Asgari et al. (2020) appears as a possible future extension in the Discussion, not as a load-bearing premise, so it does not raise the circularity score. The skeptic's concern that the stated identification constraint 'set the first factor loading equal to 1' is not visibly imposed in the reported estimates is a serious model-identification and correctness issue, but it is not a circular reduction: the likelihood is not being used to establish a target result by construction. Similarly, the unspecified selection of the weight matrix W_eta in Section 3.2 is an underspecified modeling choice, not a self-referential argument. Therefore no circular step can be exhibited, and the appropriate score is 0.
Assumptions & free parameters
free parameters (3)
- Basis truncation order J =
J=10,12 in Simulation 1; J=6 in Simulation 2 and HRS application
- Smoothing parameters alpha_lambda_j and alpha_gamma_m =
not reported
- Weight matrix W_eta =
not specified
assumptions (6)
- domain assumption All functional variables lie in L2(tau) and the latent factors and unique factors are Gaussian processes with trace-class covariance operators.
- standard math Karhunen-Loeve expansions are truncated at J terms.
- domain assumption Measurement errors epsilon_ijt are independent across i, j, t and independent of the functional unique factors epsilon_ij.
- domain assumption The measurement model is reflective and the structural model is recursive with no feedback effects.
- ad hoc to paper The weight matrix W_eta is chosen so that I - Gamma_eta W_eta is invertible and the model remains recursive.
- domain assumption Missing observations in the HRS application are Missing Completely At Random, based on Little's test.
Cite this review
Pith. "Pith review of Functional structural equation modeling with latent variables." pith.science (2026). https://pith.science/paper/HNBZPE25
@misc{pith2026241219242,
  author       = {Pith},
  title        = {Pith review of: Functional structural equation modeling with latent variables},
  year         = {2026},
  howpublished = {\url{https://pith.science/paper/HNBZPE25}},
  note         = {Machine review of arXiv:2412.19242}
}
read the original abstract
Handling latent variables in Structural Equation Models (SEMs) in a case where both the latent variables and their corresponding indicators in the measurement error part of the model are random curves presents significant challenges, especially with sparse data. In this paper, we develop a novel family of Functional Structural Equation Models (FSEMs) that incorporate latent variables modeled as Gaussian Processes (GPs). The introduced FSEMs are built upon functional regression models having response variables modeled as underlying GPs. The model flexibly adapts to cases when the random curves' realizations are observed only over a sparse subset of the domain, and the inferential framework is based on a restricted maximum likelihood approach. The advantage of this framework lies in its ability and flexibility in handling various data scenarios, including regularly and irregularly spaced points and thus missing data. To extract smooth estimates for the functional parameters, we employ a penalized likelihood approach that selects the smoothing parameters using a cross-validation method. We evaluate the performance of the proposed model using simulation studies and a real data example, which suggests that our model performs well in practice. The uncertainty associated with the estimates of the functional coefficients is also assessed by constructing confidence regions for each estimate. The goodness of fit indices that are commonly used to evaluate the fit of SEMs are developed for the FSEMs introduced in this paper. Overall, the proposed method is a promising approach for modeling functional data in SEMs with functional latent variables.
Figures


Figures from the paper (3 more)


Reference graph
Works this paper leans on
-
[1]
Asgari, F., Alamatsaz, M. H., Vitelli, V. & Hayati, S. (2020). Latent function-on-scalar regression models for observed sequences of binary data: a restricted likelihood approach. arXiv preprint arXiv:2012.02635
work page Pith review arXiv 2020
-
[2]
Bandalos, D.(2001). Item parceling issues in structural equation modeling.Advanced structural equation modeling: New developments and techniques/Lawrence Erlbaum Associates
work page 2001
-
[3]
Choi, H. & Reimherr, M. (2018). A geometric approach to confidence regions and bands for functional parameters. Journal of the Royal Statistical Society Series B: Statistical Methodology 80, 239–260
work page 2018
-
[4]
Coffman, D. L. , Dziak, J. J. , Litson, K., Chakraborti, Y., Piper, M. E. & Li, R. (2022). A causal approach to functional mediation analysis with application to a smoking cessation intervention. Multivariate Behavioral Research , 1–18
work page 2022
-
[5]
Eddelbuettel, D. & Franc ¸ois, R.(2011). Rcpp: Seamless R and C++ integration. Journal of Statistical Software 40, 1–18
work page 2011
-
[6]
Eddelbuettel, D., Francois, R., Allaire, J., Ushey, K., Kou, Q., Russell, N., Ucar, I., Bates, D. & Chambers, J. (2024). Rcpp: Seamless R and C++ Integration. R package version 1.0.13-1
work page 2024
-
[7]
Funder, D. C. (1991). Global traits: A neo-allportian approach to personality. Psychological Science 2, 31–39
work page 1991
-
[8]
Guo, W. (2002). Functional mixed effects models. Biometrics 58, 121–128. Health and Retirement Study(2024). Public Survey Data. Produced and distributed by the University of Michigan with funding from the National Institute on Aging (grant number NIA U01AG009740)
work page 2002
Show all 25 references
-
[9]
G., Connor, J
Heeringa, S. G., Connor, J. H.et al. (1995). Technical description of the health and retirement survey sample design. Ann Arbor: University of Michigan
1995
-
[10]
Lee, K.-Y.& Li, L. (2022). Functional structural equation model. Journal of the Royal Statistical Society Series B: Statistical Methodology 84, 600–629
2022
-
[11]
Li, C. (2013). Little’s test of missing completely at random. The Stata Journal 13, 795–809
2013
-
[12]
Lindquist, M. A. (2012). Functional causal mediation analysis with an application to brain connectivity. Journal of the American Statistical Association 107, 1297–1309
2012
-
[13]
& Ramsay, J
Malfait, N. & Ramsay, J. O. (2003). The historical functional linear model. Canadian Journal of Statistics 31, 115–128
2003
-
[14]
T., Neelon, B
Montagna, S., Tokdar, S. T., Neelon, B. & Dunson, D. B. (2012). Bayesian latent factor regression for functional and longitudinal data. Biometrics 68, 1064–1073. Functional structural equation modeling 23
2012
-
[15]
Morris, J. S. & Carroll, R. J. (2006). Wavelet-based functional mixed models. Journal of the Royal Statistical Society: Series B (Statistical Methodology) 68, 179–199
2006
-
[16]
Newsom, J. T. (2015). Longitudinal structural equation modeling: A comprehensive introduction. Routledge
2015
-
[17]
& Chung, Y
Noh, H., Choi, T., Park, J. & Chung, Y. (2020). Bayesian latent factor regression for multivariate functional data with variable selection. Journal of the Korean Statistical Society 49, 901–923
2020
-
[18]
Ramsay, J. O. & Silverman, B. W. (2005). Fitting differential equations to functional data: Principal differential analysis. Springer
2005
-
[19]
Rice, J. A. & Silverman, B. W. (1991). Estimating the mean and covariance structure nonparametrically when the data are curves. Journal of the Royal Statistical Society: Series B (Methodological)53, 233–243
1991
-
[20]
& Ramsay, J.(2002)
Silverman, B. & Ramsay, J.(2002). Applied functional data analysis: methods and case studies . Van Der Linden, D. , Dunkel, C. S. & Petrides, K. (2016). The general factor of personality (gfp) as social effectiveness: Review of the literature. Personality and Individual Differ...
2002
-
[21]
& M¨uller, H.-G
Wang, J.-L., Chiou, J.-M. & M¨uller, H.-G. (2016). Functional data analysis. Annual Review of Statistics and its application 3, 257–295
2016
-
[22]
& Wang, J.-L
Yao, F., M¨uller, H.-G. & Wang, J.-L. (2005). Functional linear regression analysis for longitudinal data
2005
-
[23]
C., Archie, E
Zeng, S., Rosenbaum, S., Alberts, S. C., Archie, E. A. & Li, F. (2021). Causal mediation analysis for sparse and irregular longitudinal data. The Annals of Applied Statistics 15, 747–767
2021
-
[24]
Functional mediation analysis with an application to functional magnetic resonance imaging data
Zhao, Y., Luo, X., Lindquist, M.& Caffo, B.(2018). Functional mediation analysis with an application to functional magnetic resonance imaging data. arXiv preprint arXiv:1805.06923
2018 arXiv
-
[25]
Zhu, H., Brown, P. J. & Morris, J. S. (2011). Robust, adaptive functional regression in functional mixed model framework. Journal of the American Statistical Association 106, 1167–1179
2011
Reviewed August 11, 2026 · model on record in the stance chip above.
Discussion (0). Continue with ORCID to comment.