REVIEW 2 major objections 6 minor 7 references
Robust distribution-free tests for the linear model
T0 review · 2 major / 6 minor · reviewed 2026-08-10 · deepseek-v4-flash
Pith's one-line read RobustPALMRT gives a finite-sample type I error bound for testing a covariate in a linear model, under only exchangeable errors, while allowing robust and quantile regression fits with estimated scale.
desk verdict Robust location extension of PALMRT is solid; the dispersion extension is overclaimed because the theorem's conditions are not verified. read the letter →
The pith
A machine-rendered reading of the paper's core claim, the machinery that carries it, and where it could break.
The reading
What carries the argument
The load-bearing object is the pair-of-permutations comparison array $T(\pi_1,\pi_2;\epsilon) = \omega(M(\epsilon, X_{\pi_2}, [Z_{\pi_1}, Z_{\pi_2}]))$, whose defining symmetry $T(\sigma\circ\pi_1,\sigma\circ\pi_2;\epsilon_\sigma) = T(\pi_1,\pi_2;\epsilon)$ transfers exchangeability of the errors into exchangeability of columns of the $B\times B$ comparison matrix $A_{\pi_1,\pi_2} = I(T(\pi_1,\pi_2;\epsilon)\ge T(\pi_2,\pi_1;\epsilon))$. A weighted-column tournament argument then bounds the probability that the identity column's average is small, giving the $2\alpha$ guarantee. Conditions 1 and 2 on the fitting method $M$ -- shift invariance in the $[Z, Z_\pi]$ directions and joint row-permutation equivariance -- are what let $M(Y, X, [Z, Z_\pi])$ be replaced by $M(\epsilon, X, [Z, Z_\pi])$ under the null, so the proof goes through for robust and quantile regressions rather than only OLS projections.
What would settle it
Simulate the null model $Y = Z\theta + \epsilon$ with exchangeable, symmetric, heavy-tailed errors and an independent case/control label, run DispersionPALRMT at nominal level $\alpha$, and check whether its rejection rate exceeds $2\alpha$; if it does, the grouped residual summaries break the permutation-invariance condition and Theorem 1 does not apply to that procedure.
Extended reading notes
Core claim
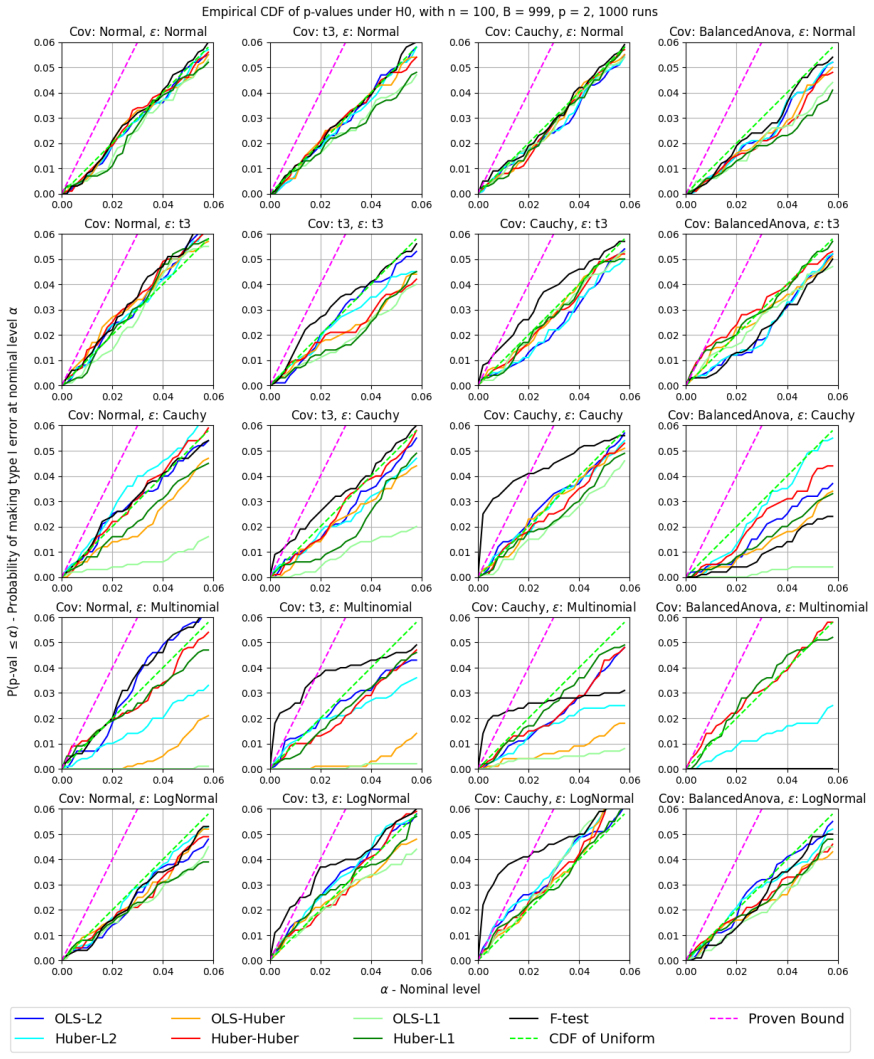
The core discovery is an extension of the permutation-augmented linear regression test (PALMRT) to any fitting method that satisfies two verifiable conditions: adding any shift of the control covariates must not change the output, and permuting the data rows must permute the output in the same way. Under the null model $Y = Z\theta + f(X,\epsilon)$ with exchangeable $\epsilon$, the paper proves that the permutation p-value defined by comparing fits to $(Y, X, [Z, Z_\pi])$ and $(Y, X_\pi, [Z, Z_\pi])$ satisfies $P_{H_0}(\mathrm{pvalue} \le \alpha) \le 2\alpha$. Because robust regression with a Huber loss and MAD scale estimation satisfies the conditions, the result covers robust and quantile regression, including hyper-parameter tuning and scale estimation. The paper further shows empirically that evaluating models with a robust loss improves power under heavy tails and skew even when the model is fit by OLS, and that the quantile-based DispersionPALRMT detects scale differences in the Long-COVID immune data that location-focused tests miss.
Load-bearing premise
The test's guarantee rests on the errors being exchangeable after adjusting for controls, and on the chosen fitting method ignoring shifts in the control covariates and treating all rows symmetrically; the paper verifies these properties for robust regression but flags that the quantile-based dispersion procedure does not clearly satisfy the row-permutation condition.
Editorial extensions
If this is right
- Using a level $\alpha/2$ cutoff gives strict finite-sample control at $\alpha$ for any method satisfying the two conditions, even with estimated scale parameters.
- Analysts can fit with OLS but evaluate with a robust loss and keep the guarantee while gaining power under heavy-tailed errors; the evaluation choice matters independently of the fit.
- DispersionPALRMT provides a finite-sample permutation test for differences in spread between groups, not just location, after adjusting for covariates.
- Any future fitting method verified to satisfy shift invariance and permutation equivariance inherits the same type I error bound, so the method is not tied to least squares.
Reading between the lines
- Editorial inference: the $2\alpha$ bound is loose in simulations; an adaptive recalibration using the empirical null distribution of p-values, or an exact correction based on the comparison matrix's column sums, could close the gap and restore nominal $\alpha$ without losing the finite-sample guarantee.
- Editorial inference: DispersionPALRMT's grouped case/control summaries appear to violate the row-permutation condition, so its guarantee is not covered by Theorem 1; a symmetric dispersion statistic based on all pairwise absolute residual differences might recover the finite-sample control while keeping the power advantage.
- Editorial inference: the separation of fit and evaluation suggests a cheap robustness upgrade for existing permutation tests: replace the $L_2$ score with a robust loss, which simulations show can raise power substantially without changing how the model is estimated.
- Editorial inference: because the theory only needs exchangeability, extending it to multivariate responses (as the paper notes) and to regularization paths for high-dimensional $X$ is a natural next step; high-dimensional $Z$ remains the known bottleneck.
Signed reviews
Editorial analysis
A structured set of objections, weighed in public.
Referee Report
Summary. The paper proposes RobustPALMRT, a permutation-based framework for testing whether a covariate X has an effect on a response Y after adjusting for control covariates Z. The main theoretical result, Theorem 1, states that if the model-fitting procedure M satisfies two invariance conditions (shift invariance under adding [Z,Zπ]γ to Y, and joint row-permutation invariance) and the errors are exchangeable, then the resulting p-value satisfies P(pvalue ≤ α) ≤ 2α. The authors verify these conditions for a Huber regression with MAD scale estimation (Appendix A) and use the framework to develop Huber-Huber RobustPALMRT. They also propose DispersionPALRMT, a quantile-regression-based test for differences in dispersion between case and control groups, and apply it to Long-COVID immune profiling data.
Significance. If the central guarantee is correct, Theorem 1 substantially extends the PALMRT framework of Guan (2024) to robust regression with estimated scale, quantile regression, and multiple model fits, while retaining a finite-sample type I error bound under only exchangeability. The separation of model fitting from model evaluation is a useful contribution, and the simulations suggest meaningful power gains under heavy-tailed and skewed errors. The paper provides a full proof of the theorem in Appendix C and a detailed verification for the Huber-Huber procedure, with code and reproducibility information mentioned. However, the advertised scope includes DispersionPALRMT, and the formal verification for that procedure is missing; this is a load-bearing gap that needs to be addressed before the paper can be accepted.
major comments (2)
- [Section 4.3 / Algorithm 2] The formal definition of M for DispersionPALRMT does not match the structure required by the framework. The displayed M packs residuals from both fits Y ∼ X+Z+Zπ and Y ∼ Xπ+Z+Zπ into one tuple, whereas the framework comparison (6) evaluates M separately at (Y,X,[Z,Zπ]) and (Y,Xπ,[Z,Zπ]). With the displayed definition, M(Y,Xπ,[Z,Zπ]) would fit Y ∼ Xπ+Z+Zπ and Y ∼ Xππ+Z+Zπ, which is not the intended permuted fit. Algorithm 2 implements the intended comparison with a scalar function of a single fit, but the paper never states M in that form nor verifies Conditions 1 and 2 for it. A proof of shift invariance and joint row-permutation invariance for quantile-regression residual summaries, including a tie-breaking convention for non-unique quantile solutions, is needed before Theorem 1 can be invoked for DispersionPALRMT. Without it, the abstract's finite-sample type I error claim for the dispersion extension is unsupported.
- [Section 4.2, non-unique minimizers] The paragraph on non-unique minimizers states that 'standard software packages do this [preserve Condition 1]' without proof. For Theorem 1 to apply to the implemented algorithms, the tie-breaking convention must satisfy both Condition 1 and Condition 2, not merely Condition 1. A convention that selects, for instance, the first optimum in a fixed row order would break joint row-permutation invariance. The authors should specify the exact tie-breaking rule used in Algorithms 1 and 2 (e.g., the R or Python implementation) and verify that it preserves both invariance conditions.
minor comments (6)
- [Section 4.3, M definition] The tuple defining M lists 'rqLow,Control' twice and omits 'rqHigh,Control'; it should list both quantiles for both groups, e.g., (r_qLow,Control, r_qHigh,Control, r_qLow,Case, r_qHigh,Case).
- [Section 4.3 / Algorithm 2] The notation 1/|Xτ=j| is ambiguous; it should be 1/n_j with n_j = |{i : Xτ_i = j}|, and the set notation should be used consistently.
- [Appendix C, Theorem 2] In the statement of Theorem 2, the condition on ̃ω is written as '̃ω(M1, M2) + ̃ω(M2, M2) = 1'; it should be '̃ω(M1, M2) + ̃ω(M2, M1) = 1'.
- [Section 2.3] The claim that this is 'the first test for robust regression parameters with scale estimation that is valid in a distribution-free setting without moment assumptions in finite-samples' is strong; the authors should verify this against recent literature (e.g., invariance-based and permutation-based tests) and, if it stands, provide a precise comparison.
- [Section 5.2] When reporting the 'highly conservative' type I error of DispersionPALRMT (e.g., 0.004 in the normal-errors setting with n=100), the paper should report Monte Carlo standard errors or confidence intervals so that readers can assess the precision of these empirical rates.
- [Section 1, Figure 1] The text 'Figure 1a shows a normal QQ plot ... we see that there is shows strong right-skewness' contains a typo ('there is shows'); it should read 'we see that there is strong right-skewness'.
Circularity Check
No significant circularity: Theorem 1 is an honest generalization of external PALMRT results with an independent proof; the DispersionPALRMT gap is a scope/correctness issue, not a circular reduction.
full rationale
The paper's central guarantee, Theorem 1, is not obtained by assuming its own conclusion. The proof reduces to Guan's Theorem 3.1 (an external, published result) and the tournament bound of Barber et al. (2023), and Appendix C supplies a self-contained proof of a more general population version, reproducing the needed combinatorial lemma rather than importing the target result. The two conditions on M are verified for the Huber-Huber procedure in Appendix A: Lemma 1 proves shift invariance and permutation equivariance for Algorithms A1/A2, and the displayed algebra shows these imply Conditions 1 and 2. No fitted parameter is relabeled as a prediction; the 2-alpha bound is not an input to the construction, and no equation is definitionally equivalent to the p-value bound. The only self-citation, Jung, MacEachern and Kim (2021), supports an empirical power observation and is not load-bearing. The quantile-based DispersionPALRMT (Section 4.3, Algorithm 2) is never shown to satisfy Conditions 1 and 2, and Section 8 explicitly concedes that type I error may not be controlled under unmodeled heteroskedasticity; however, this is an unverified applicability claim, not a circular derivation. The central Huber-Huber result is self-contained against external benchmarks, so no significant circularity is present.
Assumptions & free parameters
free parameters (3)
- Huber constant delta =
1.345
- MAD normal-consistency constant =
1.4826
- Quantile levels for DispersionPALRMT =
qLow=0.10, qHigh=0.90
assumptions (5)
- domain assumption Assumption 1: ϵ is an exchangeable random vector.
- domain assumption Assumption 2: Y is linear in Z, i.e., Y = Zθ + f(X, ϵ).
- ad hoc to paper Condition 1: M is shift-invariant: M(Y + [Z, Zπ]γ, X, [Z, Zπ]) = M(Y, X, [Z, Zπ]).
- ad hoc to paper Condition 2: M is invariant to joint row permutations: M(Yσ, Xσ, [Z, Zπ]σ) = M(Y, X, [Z, Zπ]).
- standard math Tournament bound (Lemma 2): For a matrix A with Aij + Aji = 1, weighted column sums ≤ α have total weight ≤ 2α.
Cite this review
Pith. "Pith review of Robust distribution-free tests for the linear model." pith.science (2026). https://pith.science/paper/Q3M5OSND
@misc{pith2026250100583,
  author       = {Pith},
  title        = {Pith review of: Robust distribution-free tests for the linear model},
  year         = {2026},
  howpublished = {\url{https://pith.science/paper/Q3M5OSND}},
  note         = {Machine review of arXiv:2501.00583}
}
read the original abstract
Recently, there has been growing concern about heavy-tailed and skewed noise in biological data. We introduce RobustPALMRT, a flexible permutation framework for testing the association of a covariate of interest adjusted for control covariates. RobustPALMRT controls type I error rate for finite-samples, even in the presence of heavy-tailed or skewed noise. The new framework expands the scope of state-of-the-art tests in three directions. First, our method applies to robust and quantile regressions, even with the necessary hyper-parameter tuning. Second, by separating model-fitting and model-evaluation, we discover that performance improves when using a robust loss function in the model-evaluation step, regardless of how the model is fit. Third, we allow fitting multiple models to detect specialized features of interest in a distribution. To demonstrate this, we introduce DispersionPALRMT, which tests for differences in dispersion between treatment and control groups. We establish theoretical guarantees, identify settings where our method has greater power than existing methods, and analyze existing immunological data on Long-COVID patients. Using RobustPALMRT, we unveil novel differences between Long-COVID patients and others even in the presence of highly skewed noise.
Figures


Figures from the paper (18 more)




Reference graph
Works this paper leans on
-
[1]
Barber, R. F., Candès, E. J., Ramdas, A. & Tibshirani, R. J. (2021), ‘Predictive inference with the jackknife+’,The Annals of Statistics49(1), 486 –
work page 2021
-
[5]
• ϵ ∼ N (0, In) + (−1)Bernoulli(0.5) · 104 ·Multinomial 1; 1 n ,
- Log Normal errors. • ϵ ∼ N (0, In) + (−1)Bernoulli(0.5) · 104 ·Multinomial 1; 1 n , . . . ,1 n - Multinomial errors. The Log Normal setting has individual entrieslog(ϵi) ∼ N (0, 1). This is a moderately skewed setting, having skewnessγ1 = 6.18. The Multinomial errors setting represents a Normal errors setting except with one extreme outlier. Lastly, for...
work page 2024
-
[6]
I X π∈Sn f (π)A(π, τ; ϵ) ≤ α !# = Eϵ
Let Y be generated according to model(3), and letσ, π1, . . . , πB iid ∼ F for any (possibly non- uniform) distribution F over the group of permutationsSn. Then for anyθ ∈ Rp and any exchangeable ϵ, under the null hypothesisH0 we have: PH0 pPop value(σ) ≤ α ≤ 2α, PH0 pMC value(σ) ≤ α ≤ 2α, where the randomness is averaged overϵ, σ, and π1, . . . , πB. If,...
work page 2023
-
[7]
In order to computeA(π, σ; ϵ) for some σ ̸= Id, we would need to know the true value ofϵ
While it is tempting to try to directly appeal to column exchangeability properties, only the values in the column A(π, Id; ϵ) = A(π; Id; , Y) will be computable from the data. In order to computeA(π, σ; ϵ) for some σ ̸= Id, we would need to know the true value ofϵ. Nonetheless, the Aij + Aji = 1 condition lets us bound how many columns can have small col...
work page 2023
-
[507]
Barber, R. F., Candes, E. J., Ramdas, A. & Tibshirani, R. J. (2023), ‘Conformal prediction beyond exchangeability’,The Annals of Statistics51(2), 816–845. Breusch, T. S. & Pagan, A. R. (1979), ‘A simple test for heteroscedasticity and random coefficient variation’,Econometrica: Journal of the Econometric Societypp. 1287–1294. Cook, R. D. & Weisberg, S. (1...
arXiv 2023
-
[808]
Wang, L., Peng, B. & Li, R. (2015), ‘A high-dimensional nonparametric multivariate test for mean vector’,Journal of the American Statistical Association110(512), 1658–1669. Wen, K., Wang, T. & Wang, Y. (2022), ‘Residual permutation test for high-dimensional regression coefficient testing’,arXiv preprint arXiv:2211.16182. Young, A. (2024), ‘Asymptotically ...
work page Pith review arXiv 2015
-
[2013]
Require: Rectangular data set[Y, C]. Y ∈ Rn are responses; C ∈ Rn×r are covariates. R0 ← Residuals from OLS regression ofY on C. while Not converged do sk ← 1.4826 ∗mediani=1,...,n(abs(Rk i )) for i = 1, . . . , ndo wk i ← min 1, 1.345 abs(Rk i )/sk end for Rk+1 ← Residuals from WLS regression ofRk on C with weights wk. Terminate if ||Rk+1−Rk||2 ||Rk||2 <...
work page 2013
Reviewed August 10, 2026 · model on record in the stance chip above.
Discussion (0). Continue with ORCID to comment.