REVIEW 3 major objections 5 minor 65 references
Testing the extended corona model with the optical/UV reverberation mapping of the accretion disk
T0 review · 3 major / 5 minor · reviewed 2026-08-10 · deepseek-v4-flash
Pith's one-line read The paper claims that UV/optical reverberation mapping cannot reliably distinguish a vertically extended X-ray corona from a point-like lamppost: the two-lamp delay curve differs from the best single lamp by at most about 20%, and…
desk verdict A useful, clearly scoped simulation showing that two synchronous corona lamps mimic a single lamppost in UV/optical delays to within ~20%, but the zero-lag coherent-lamp assumption leaves the broad conclusion under-supported. read the letter →
The pith
A machine-rendered reading of the paper's core claim, the machinery that carries it, and where it could break.
The reading
What carries the argument
The central object is the wavelength-dependent transfer (response) function of a thin accretion disk irradiated by two point sources on the symmetry axis. The paper computes the delay from each lamp to each disk element plus the path to the observer, assumes perfect thermalization of the incident X-ray flux, and derives the reprocessed temperature and monochromatic luminosity as a function of wavelength. The argument that a two-lamp setup mimics a single lamp rests on the identity that at large radii the ratio of incident to dissipative flux is proportional to the luminosity-weighted sum $\sum_i L_i H_i$, so the effective height is the luminosity-weighted average position of the emitting components.
What would settle it
Measure the wavelength-dependent continuum delay curve of an AGN with $M_{\rm BH} \approx 10^8\,M_\odot$ and Eddington ratio near 1 using sampling better than 0.1 days over at least 200 days; if the delay curve cannot be matched by any single lamppost height within 20% at 1000 Å, or if the ICCF of the two-lamp model is systematically distinguishable from the single-lamp model, the claimed insensitivity fails. Alternatively, a high-mass, low-Eddington source should show the predicted sharp break in short-wavelength delays if the extended-corona interpretation is correct.
Extended reading notes
Core claim
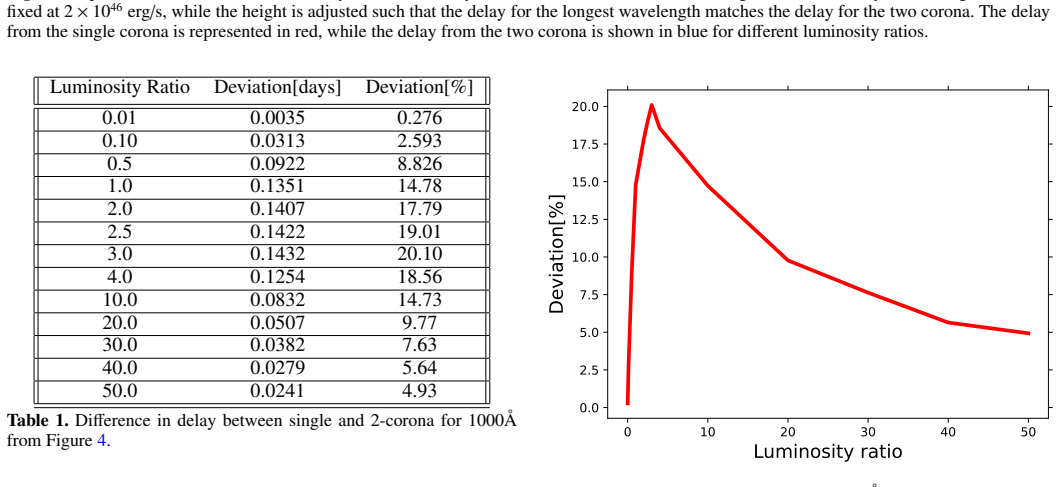
The central claim is that the UV/optical continuum reverberation signal is produced by reprocessing at radii large compared with the corona height, so the observable delays depend on the luminosity-weighted average height $h = (h_1 L_1 + h_2 L_2)/(L_1 + L_2)$ rather than on the detailed vertical distribution of the X-ray source. For a $10^8\,M_\odot$ black hole at Eddington ratio 1 with lamps at 5 and 100 $R_g$, the wavelength-dependent delay of the two-lamp model differs from the best-matching single lamppost by at most about 20%, occurring near a luminosity ratio of 3, and the ICCFs of simulated 0.1-day-sampled light curves show no statistically measurable difference between the two geometries. The authors therefore conclude that UV/optical reverberation mapping cannot reliably reveal a vertically extended corona, and that fitted heights from such data should be read as effective, luminosity-weighted positions.
Load-bearing premise
The results assume the two coronal components follow exactly the same variability pattern with no intrinsic delay between them; a real extended corona whose subregions fluctuate with lags or partial coherence could produce stronger or asymmetric signatures that the 20% ceiling and ICCF null result would miss.
Editorial extensions
If this is right
- Continuum reverberation campaigns that fit a single corona height are measuring a luminosity-weighted mean height, not the true vertical extent; a corona spanning 5 to 100 $R_g$ with comparable luminosities will look like a lamp near 52 $R_g$.
- Distinguishing an extended corona from a point source requires wide wavelength coverage from about 1000 to 10000 Å free of broad-line-region contamination, time-delay errors below 20%, and sampling much denser than the 0.1-day cadence used here.
- The ICCF peak is statistically shifted to longer delays for the two-lamp model (for example 5.69 days versus 4.69 days at equal luminosities), but the shift is smaller than the dispersion among realizations, so a single monitoring campaign cannot exploit it.
- For higher black hole mass ($10^9\,M_\odot$) and lower Eddington ratio (0.01), the two-lamp delay curve bends sharply away from the standard $\lambda^{4/3}$ trend at short wavelengths, offering the best chance to see the extension, though relativistic modeling would be required.
- When one lamp strongly dominates, the two-lamp model is indistinguishable from a single lamp at the dominant height, so the detectable signature is confined to a narrow range of luminosity ratios, roughly 2 to 4.
Reading between the lines
- Because the paper assumes the two lamps share exactly the same variability curve with no intrinsic delay, a real continuous corona whose subregions fluctuate with mutual lags or partial coherence could produce asymmetries larger than the 20% ceiling; testing this would require multi-zone variability models rather than two synchronous lamps.
- The luminosity-weighted-average result suggests that combining X-ray and optical/UV reverberation—probing inner and outer disk regions respectively—might recover some vertical information even though each band alone cannot, because the effective height should be wavelength-dependent if the corona is extended.
- A testable extension of the paper's logic is to search existing multi-band continuum reverberation data for a systematic trend in the best-fit single-lamp height with wavelength; such a trend would be evidence for vertical extension beyond the point-source approximation.
- The paper's prediction for high-mass, low-Eddington sources—a sharp flattening of short-wavelength delays—could be checked with future ultraviolet monitoring campaigns, but the prediction currently rests on Newtonian optics and a standard disk extending to the ISCO, which may not hold in that regime.
Editorial analysis
A structured set of objections, weighed in public.
Referee Report
Summary. The paper tests whether optical/UV reverberation mapping can distinguish a vertically extended X-ray corona from a single point-like lamppost. The extended corona is modeled as two point sources on the symmetry axis at heights h1=5 Rg and h2=100 Rg, with variable luminosity ratio, for a 1e8 solar mass black hole at Eddington ratio 1 and inclination 30 degrees. Using a Shakura-Sunyaev disk with perfect thermalization of incident flux, the authors compute transfer functions and wavelength-dependent delays (Sections 2–3), finding that after matching the single-lamp height at the longest wavelength, the maximum delay difference at 1000 Å is about 20% for a luminosity ratio of ~3 (Table 1). They further simulate light curves with a Timmer-Koenig power spectral density and compute ICCFs between 1000 Å and 7923 Å for 10 realizations; the single-lamp and two-lamp ICCFs overlap within the dispersion (Sections 3.3–3.4). The paper concludes that UV/optical reverberation mapping is not very sensitive to vertical corona extension and that the effective lamp position is a luminosity-weighted average height (Eq. 11).
Significance. If correct, the result is a valuable caution for the AGN reverberation-mapping community: corona heights fitted from continuum delays should be interpreted as luminosity-weighted averages rather than as direct geometric measurements of the vertical extent. The paper is a well-defined, falsifiable test: it uses standard thin-disk reprocessing, transfer functions, and identical driving light curves for the single- and two-lamp cases, which avoids the circularity of fitting to data. The central 20% deviation and the ICCF null result are concrete predictions for the chosen parameter set. The main limitations are the idealized two-lamp representation with perfectly coherent, zero-lag variability, and the lack of a formal statistical test on the ICCF comparison; these do not invalidate the specific calculations but do bound the generality of the conclusion.
major comments (3)
- [Sections 3.3–3.4, Table 2] The claim that the ICCF profiles of the two-lamp and single-lamp models are 'statistically indistinguishable' is not supported by a formal test. The paper compares mean ICCFs and dispersions over 10 realizations but does not report a p-value, confidence interval, or any null-hypothesis test for the peak-delay differences of 1.0 day (L1/L2=1) and 1.0 day (L1/L2=3) in Table 2. Because the realization-to-realization scatter is visibly large (Figure 6), a quantitative test is required before concluding that the models cannot be distinguished. Please add a permutation or bootstrap test that quantifies the probability of observing the measured mean shift under the null hypothesis of identical ICCF distributions.
- [Section 2.3] The assumption that both coronal components use 'the same dense curve, without any intrinsic delay between the coronal points' is a measure-zero subset of possible correlations in a real vertically extended corona. For the adopted parameters, the light-crossing time between h1=5 Rg and h2=100 Rg is about 0.5 days (for M=1e8 Msun), comparable to the sampling interval and to the delays being measured. If the upper and lower components are mutually delayed or only partially coherent, the two-lamp response function becomes asymmetric, potentially breaking the degeneracy with a single lamppost that the paper reports. The paper acknowledges this limitation but does not explore it. Please compute at least one test case with a fixed intrinsic delay between the two lamps (e.g., 0.5 days) and one with a coherence factor less than unity, and report how the 20% ceiling and the ICCF result change. Without this, the general conclusion that UV/optical reverberation mapping is insensitive to vertical extension is not established.
- [Abstract, Table 1, Figure 5] The central 20% result is presented as the maximum deviation of the wavelength-dependent delay curve, but Table 1 and Section 3.2 evaluate the deviation at a single wavelength, 1000 Å. The paper does not show that the deviation is maximal at 1000 Å over the range 1000–10000 Å, and indeed the text states the departure is measured 'at the shortest wavelengths,' leaving it possible that the deviation grows further below 1000 Å. Please present the deviation as a function of wavelength over the full computed range, or explicitly state that the 20% applies to 1000 Å only and adjust the abstract and conclusions accordingly.
minor comments (5)
- [Eqs. (1)–(4), Section 2.3] The notation for the lamp luminosities is inconsistent: Eq. (1) uses L12 and L21 for the two sources, while Eqs. (3)–(4) use L12 and L22, and the text says 'L12 and L21 are luminosities associated with the two sources.' Please use L1 and L2 throughout to avoid confusion.
- [Key words line] The key words list 'giant planet formation – κ-mechanism – stability of gas spheres' appears to be a copy-paste error from an unrelated paper; it should be replaced with keywords appropriate to AGN accretion disk reverberation mapping.
- [Figure 3 and Section 3.1] The text states the two-lamp response function 'can be approximated by summing the red and blue single-corona response functions,' but in the figure the two single-corona response functions are blue (h=5 Rg) and green (h=100 Rg). This should read 'blue and green.'
- [Section 3.4] The paper states that with 10 light curves 'the error of the mean would be a factor of sqrt(N) lower,' but it does not show the standard error of the mean in Figure 7; adding error bars to the mean ICCF curves would make the comparison more transparent.
- [General] The paper uses 'lamppost' and 'lampost' inconsistently; please standardize spelling.
Circularity Check
No significant circularity: the two-lamp/single-lamp delay comparison is a forward simulation with a fair one-parameter match, and the effective-height formula is a derived summary, not an input.
full rationale
The paper's central comparison is self-contained. Light curves for the two-lamp and single-lamp setups are generated from the same realization of a Timmer & Koenig (1995) driving signal, so the ICCF comparison isolates the response-function difference rather than importing the conclusion. The single-lamp height is fitted by matching the longest-wavelength delay before measuring the short-wavelength deviation (Section 3.2); this one-parameter matching does not force the reported at-most-20% deviation at 1000 A, because the fitted height alone cannot prescribe the shape of the delay curve across the full wavelength range. Equation (11), the luminosity-weighted effective height, is presented after the simulations as a summary of the fitted heights (e.g., h=52 Rg for L1/L2=1, matching (5+100)/2), so it is an output, not an input. The only self-citation, Jaiswal et al. (2023), supplies the disk-grid discretization and benchmark single-lamp delay profiles; it is not invoked as a uniqueness theorem or as a substitute for the new transfer-function and ICCF calculations. The zero-lag, perfectly coherent two-lamp assumption in Section 2.3 is a physical simplification and is explicitly acknowledged; it may limit the generality of the conclusion, but it is not a circular reduction of the derivation to its inputs. No equation in the paper is defined in terms of the quantity it claims to predict, and no fitted parameter is renamed as a prediction. The paper therefore exhibits no significant circularity.
Assumptions & free parameters
free parameters (8)
- Corona heights h1 and h2 =
5 Rg and 100 Rg
- Lamp luminosity ratio L1/L2 =
Scanned 0.01 to 50; maximum deviation at L1/L2 = 3
- Black hole mass MBH =
1e8 solar masses; 1e9 in the exploratory case
- Eddington ratio =
1.0; 0.01 in the exploratory case
- Viewing inclination i =
30 degrees
- Total lamp luminosity =
2e46 erg/s
- Timmer-Koenig PSD parameters (three slopes, two breaks, variance) =
Not specified in the text
- Pulse width for transfer function =
0.05 days
assumptions (6)
- domain assumption The accretion flow is a Shakura-Sunyaev geometrically thin, optically thick disk that extends down to ISCO at 6 Rg.
- domain assumption General relativistic effects are neglected; light propagation is approximated by geometrical optics.
- domain assumption Incident X-ray radiation is perfectly thermally absorbed and reprocessed, with no energy-dependent reflection.
- domain assumption Local disk emission is blackbody with no color correction.
- ad hoc to paper A vertically extended corona can be represented by two point lamps at different heights with identical variability and no intrinsic lag.
- domain assumption The Timmer-Koenig algorithm with three PSD slopes and two breaks is a valid representation of AGN X-ray variability.
invented entities (1)
-
Two discrete point-like corona lamps at heights h1 and h2
Cite this review
Pith. "Pith review of Testing the extended corona model with the optical/UV reverberation mapping of the accretion disk." pith.science (2026). https://pith.science/paper/7GIVQXDG
@misc{pith2026250100806,
  author       = {Pith},
  title        = {Pith review of: Testing the extended corona model with the optical/UV reverberation mapping of the accretion disk},
  year         = {2026},
  howpublished = {\url{https://pith.science/paper/7GIVQXDG}},
  note         = {Machine review of arXiv:2501.00806}
}
abstract
The illumination of the accretion disks is frequently studied assuming that the incident X-ray flux is a point-like source. The approach is referred as lamppost model.The most recent computations of the X-ray reprocessing by the disk take into account the departure from the simple lamppost models. However, in computations of the incident flux thermalization and subsequent re-emission in the optical-UV band the lamppost approximation is most frequently assumed. We test if the UV-optical reverberation mapping and time delay measurements are sensitive to this assumption. We assume that the incident radiation originates from a region extended along the symmetry axis. To model this, we adopt a simple setup by representing the emission as two lamps irradiating the disk simultaneously from two different heights. We then compare the resulting predictions with those obtained for a single lamppost located at an intermediate height. We show at the basis of the transfer function that the deviation of the wavelength-dependent delay curve shows at most a difference of 20% in comparison to a single lamppost, assuming the black hole mass of $10^8 M_{\odot}$, Eddington ratio 1, and the location of the lamps at 5 and 100 r$g$. The maximum deviation happens for the lamp luminosity ratio $\sim3$. When simulating light curves for a two-lamp setup and a standard lamppost with the same black hole mass and a sampling rate of 0.1 days, we find no measurable differences in the ICCF profiles between the two setups. Larger black hole mass and considerably lower Eddington ratio would allow to see larger differences between a single lamppost and a two-lampost model. UV/optical reverberation mapping is not very sensitive to the vertical extension of the corona.
Figures


Figures from the paper (5 more)



Reference graph
Works this paper leans on
-
[1]
R., Sudhakar, V ., Fairfax, D., et al
Ballantyne, D. R., Sudhakar, V ., Fairfax, D., et al. 2024, MNRAS, 530, 1603
work page 2024
-
[2]
Beloborodov, A. M. 1999, ApJ, 510, L123
work page 1999
-
[3]
C., Denney, K
Bentz, M. C., Denney, K. D., Grier, C. J., et al. 2013, ApJ, 767, 149
2013
-
[4]
M., Bentz, M
Cackett, E. M., Bentz, M. C., & Kara, E. 2021, iScience, 24, 102557
2021
-
[5]
M., Chiang, C.-Y ., McHardy, I., et al
Cackett, E. M., Chiang, C.-Y ., McHardy, I., et al. 2018, ApJ, 857, 53
2018
- [6]
-
[7]
Cackett, E. M., Gelbord, J., Barth, A. J., et al. 2023, ApJ, 958, 195
work page 2023
-
[8]
M., Gelbord, J., Li, Y .-R., et al
Cackett, E. M., Gelbord, J., Li, Y .-R., et al. 2020, ApJ, 896, 1
2020
Show all 65 references
-
[9]
M., Horne, K., & Winkler, H
Cackett, E. M., Horne, K., & Winkler, H. 2007, MNRAS, 380, 669
2007
-
[10]
M., Zoghbi, A., Reynolds, C., et al
Cackett, E. M., Zoghbi, A., Reynolds, C., et al. 2014, MNRAS, 438, 2980
2014
-
[11]
2019, The Astrophysical Journal, 878, 20
Chainakun, P. 2019, The Astrophysical Journal, 878, 20
2019
-
[12]
Collier, S., Horne, K., Wanders, I., & Peterson, B. M. 1999, MNRAS, 302, L24
1999
-
[13]
J., Horne, K., Kaspi, S., et al
Collier, S. J., Horne, K., Kaspi, S., et al. 1998, ApJ, 500, 162 De Marco, B. & Ponti, G. 2019, Astronomische Nachrichten, 340, 290 Dovˇciak, M., Karas, V ., & Yaqoob, T. 2004, ApJS, 153, 205
1998
-
[14]
M., Gelbord, J., et al
Edelson, R., Peterson, B. M., Gelbord, J., et al. 2024, ApJ, 973, 152
2024
-
[15]
M., & Papadakis, I
Emmanoulopoulos, D., McHardy, I. M., & Papadakis, I. E. 2011, MNRAS, 416, L94
2011
-
[16]
A., McClintock, J
Esin, A. A., McClintock, J. E., & Narayan, R. 1997, ApJ, 489, 865
1997
-
[17]
C., Iwasawa, K., Reynolds, C
Fabian, A. C., Iwasawa, K., Reynolds, C. S., & Young, A. J. 2000, PASP, 112, 1145
2000
-
[18]
C., Zoghbi, A., Ross, R
Fabian, A. C., Zoghbi, A., Ross, R. R., et al. 2009, Nature, 459, 540
2009
-
[19]
M., Denney, K
Fausnaugh, M. M., Denney, K. D., Barth, A. J., et al. 2016, ApJ, 821, 56
2016
-
[20]
A., Rosner, R., & Vaiana, G
Galeev, A. A., Rosner, R., & Vaiana, G. S. 1979, ApJ, 229, 318
1979
-
[21]
George, I. M. & Fabian, A. C. 1991, MNRAS, 249, 352
1991
-
[22]
& Proga, D
Giustini, M. & Proga, D. 2019, A&A, 630, A94
2019
-
[23]
& Maraschi, L
Haardt, F. & Maraschi, L. 1993, ApJ, 413, 507
1993
-
[24]
1994, ApJ, 432, L95
Haardt, F., Maraschi, L., & Ghisellini, G. 1994, ApJ, 432, L95
1994
-
[25]
J., & Chainakun, P
Hancock, S., Young, A. J., & Chainakun, P. 2023, MNRAS, 520, 180
2023
-
[26]
& Pelletier, G
Henri, G. & Pelletier, G. 1991, ApJ, 383, L7
1991
-
[27]
1977, ApJ, 214, 840
Ichimaru, S. 1977, ApJ, 214, 840
1977
-
[28]
C., Reynolds, C
Iwasawa, K., Fabian, A. C., Reynolds, C. S., et al. 1996, MNRAS, 282, 1038
1996
-
[29]
K., Prince, R., Panda, S., & Czerny, B
Jaiswal, V . K., Prince, R., Panda, S., & Czerny, B. 2023, A&A, 670, A147
2023
-
[30]
S., Papadakis, I
Kammoun, E. S., Papadakis, I. E., & Dovˇciak, M. 2019, ApJ, 879, L24
2019
-
[31]
S., Robin, L., Papadakis, I
Kammoun, E. S., Robin, L., Papadakis, I. E., Dov ˇciak, M., & Panagiotou, C. 2023, MNRAS, 526, 138
2023
-
[32]
C., Cackett, E
Kara, E., Fabian, A. C., Cackett, E. M., et al. 2013, MNRAS, 434, 1129
2013
-
[33]
F., Fabian, A
Kara, E., Steiner, J. F., Fabian, A. C., et al. 2019, Nature, 565, 198
2019
-
[34]
C., Bechtold, J., & Siemiginowska, A
Kelly, B. C., Bechtold, J., & Siemiginowska, A. 2009, ApJ, 698, 895
2009
-
[35]
Krolik, J. H. 1999, Active Galactic Nuclei. From the Central Black Hole to the Galactic Environment
1999
-
[36]
& Done, C
Kubota, A. & Done, C. 2018, MNRAS, 480, 1247
2018
-
[37]
A., Papadakis, I
Langis, D. A., Papadakis, I. E., Kammoun, E., Panagiotou, C., & Dov ˇciak, M. 2024, A&A, 691, A252
2024
-
[38]
V ., et al
Liu, T., Edelson, R., Hernández Santisteban, J. V ., et al. 2024, ApJ, 964, 167
2024
-
[39]
2023, ApJ, 951, 19
Lucchini, M., Mastroserio, G., Wang, J., et al. 2023, ApJ, 951, 19
2023
-
[40]
A., & Wilms, J
Markoff, S., Nowak, M. A., & Wilms, J. 2005, ApJ, 635, 1203
2005
-
[41]
C., & Piro, L
Matt, G., Perola, G. C., & Piro, L. 1991, A&A, 247, 25
1991
-
[42]
M., Arévalo, P., Uttley, P., et al
McHardy, I. M., Arévalo, P., Uttley, P., et al. 2007, MNRAS, 382, 985
2007
-
[43]
M., Cameron, D
McHardy, I. M., Cameron, D. T., Dwelly, T., et al. 2014, MNRAS, 444, 1469
2014
-
[44]
M., Connolly, S
McHardy, I. M., Connolly, S. D., Horne, K., et al. 2018, MNRAS, 480, 2881
2018
-
[45]
W., Guo, H., Barth, A
Montano, J. W., Guo, H., Barth, A. J., et al. 2022, ApJ, 934, L37
2022
-
[46]
A., Stewart, G
Nandra, K., Pounds, K. A., Stewart, G. C., Fabian, A. C., & Rees, M. J. 1989, MNRAS, 236, 39P
1989
-
[47]
Narayan, R. & Yi, I. 1994, ApJ, 428, L13
1994
-
[48]
L., Horne, K., Lyuty, V
Oknyanskij, V . L., Horne, K., Lyuty, V . M., et al. 2003, in Astronomical Soci- ety of the Pacific Conference Series, V ol. 290, Active Galactic Nuclei: From Central Engine to Host Galaxy, ed. S. Collin, F. Combes, & I. Shlosman, 119
2003
-
[49]
O., et al
Palit, B., Rozanska, A., Petrucci, P. O., et al. 2024, arXiv e-prints, arXiv:2406.14378
2024 arXiv
-
[50]
Peterson, B. M. 1988, Publications of the Astronomical Society of the Pacific, 100, 18
1988
-
[51]
Peterson, B. M. 1993, PASP, 105, 247
1993
-
[52]
M., Ferrarese, L., Gilbert, K
Peterson, B. M., Ferrarese, L., Gilbert, K. M., et al. 2004, The Astrophysical Journal, 613, 682
2004
-
[53]
Poindexter, S., Morgan, N., & Kochanek, C. S. 2008, ApJ, 673, 34
2008
-
[54]
A., Nandra, K., Stewart, G
Pounds, K. A., Nandra, K., Stewart, G. C., George, I. M., & Fabian, A. C. 1990, Nature, 344, 132
1990
-
[55]
1993, A&A, 272, 8 Ró˙ za´nska, A., Malzac, J., Belmont, R., Czerny, B., & Petrucci, P
Rokaki, E., Collin-Souffrin, S., & Magnan, C. 1993, A&A, 272, 8 Ró˙ za´nska, A., Malzac, J., Belmont, R., Czerny, B., & Petrucci, P. O. 2015, A&A, 580, A77
1993
-
[56]
Sergeeva, E. A. 2005, ApJ, 622, 129
2005
-
[57]
Shakura, N. I. & Sunyaev, R. A. 1973, A&A, 500, 33
1973
-
[58]
J., Horne, K., et al
Shen, Y ., Grier, C. J., Horne, K., et al. 2024, ApJS, 272, 26
2024
-
[59]
2020, A&A, 641, A89
Szanecki, M., Nied´ zwiecki, A., Done, C., et al. 2020, A&A, 641, A89
2020
-
[60]
& Koenig, M
Timmer, J. & Koenig, M. 1995, A&A, 300, 707
1995
-
[61]
M., McHardy, I., Cackett, E
Vincentelli, F. M., McHardy, I., Cackett, E. M., et al. 2021, Monthly Notices of the Royal Astronomical Society, 504, 4337–4353
2021
-
[62]
R., Cackett, E
Wilkins, D. R., Cackett, E. M., Fabian, A. C., & Reynolds, C. S. 2016, MNRAS, 458, 200
2016
-
[63]
Wilkins, D. R. & Fabian, A. C. 2012, MNRAS, 424, 1284
2012
-
[64]
2021, Nature Communications, 12, 1025 Zajaˇcek, M., Czerny, B., Martinez-Aldama, M
You, B., Tuo, Y ., Li, C., et al. 2021, Nature Communications, 12, 1025 Zajaˇcek, M., Czerny, B., Martinez-Aldama, M. L., et al. 2021, ApJ, 912, 10
2021
-
[65]
M., et al
Zoghbi, A., Reynolds, C., Cackett, E. M., et al. 2013, ApJ, 767, 121 Article number, page 9 of 9
2013
Reviewed August 10, 2026 · model on record in the stance chip above.
Discussion (0). Continue with ORCID to comment.