REVIEW 3 major objections 6 minor 117 references
XMM/HST monitoring of the ultra-soft highly accreting Narrow Line Seyfert 1 RBS 1332
T0 review · 3 major / 6 minor · reviewed 2026-08-10 · deepseek-v4-flash
Pith's one-line read Joint XMM-Newton and HST observations of RBS 1332 establish that its soft X-ray excess is dominated by warm Comptonization, with only a marginal contribution from relativistic reflection.
desk verdict Solid NLSy1 case study with a genuinely new UV outflow detection; the warm-Comptonization preference is statistically clear, but the 'marginal reflection' split relies on a reXcor grid that may not match this source's Eddington ratio. read the letter →
The pith
A machine-rendered reading of the paper's core claim, the machinery that carries it, and where it could break.
The reading
What carries the argument
The reXcor spectral model, defined as a table that self-consistently computes ionized relativistic reflection from a lamppost corona together with emission from a warm Comptonizing corona, is the object that carries the argument. It distributes the accretion power released inside 400 gravitational radii among the hot lamppost, the warm corona, and the disk; the fitted fractions fx (lamppost) and hf (warm corona), along with the warm-corona opacity τ, determine which mechanism dominates. The paper also uses AGNSED, an energetically coupled disk/warm-corona/hot-corona model, to translate the same components into radial sizes of about 10 gravitational radii for the hot corona and about 200 gravitational radii for the warm region.
What would settle it
Run the reXcor fit on the same data with the alternate grid values a=0.9 and h=20 Rg, including the sub-0.5 keV data; if the warm-corona dissipation fraction hf no longer consistently exceeds the lamppost fraction fx, the warm-corona-dominance claim would be overturned.
Extended reading notes
Core claim
The paper's central claim is that the broadband emission of RBS 1332 is the sum of a fairly constant outer disk, a warm Comptonizing region, and a soft hot coronal continuum, and that the prominent soft X-ray excess below about 2 keV is produced mainly by the optically thick warm corona rather than by relativistic reflection off the disk. Fitting the five-epoch XMM-Newton and HST data, the warm-Comptonization model reaches χ²=739 for 680 degrees of freedom, while a model in which relativistic reflection dominates gives χ²=882 for 691 degrees of freedom; the reXcor model, which treats both mechanisms together, returns a warm-corona dissipation fraction hf several times larger than the lamppost fraction fx in every epoch. The same reXcor fit requires excluding data below 0.5 keV because the model's photon-index range is too narrow, but the paper argues this does not change the energy partition. On this basis the paper concludes that warm Comptonization, not reflection, powers the soft excess, and that the two-coronae picture describes extreme high-accreting sources as well as ordinary Seyferts.
Load-bearing premise
The reXcor decomposition is computed on a fixed grid assuming black-hole spin a=0.99, lamppost height h=5 gravitational radii, seed-photon fraction λ=0.1, and a 10 percent Eddington ratio, and it excludes data below 0.5 keV; if RBS 1332's true spin or lamppost height lies outside this grid, the derived warm-corona dominance could be an artifact.
Editorial extensions
If this is right
- The two-coronae framework, with a standard disk, a warm Comptonizing corona, and a compact hot corona, reproduces the extreme ultra-soft spectrum of RBS 1332, so US-NLSy1 sources do not require reflection-dominated geometries.
- The soft X-ray excess variability is driven by the warm and hot coronae rather than by a reflecting disk, consistent with the lack of a detectable Fe Kα line.
- The hot corona is compact (about 10 gravitational radii) and steep (photon index about 2.2), while the warm corona extends to roughly 200 gravitational radii and its size grows with the accretion rate.
- Eddington-ratio estimates from X-ray variability (about 90 percent) and from the FUV spectrum (about 40 percent) both place RBS 1332 in the efficiently accreting regime, with the difference plausibly due to the smaller broad-line-region sizes of super-Eddington accretors.
Reading between the lines
- If the reXcor energy partition is correct, a deep observation designed to measure the faint broad ionized Fe K line predicted by the marginal lamppost fraction would provide an independent check of warm-corona dominance.
- The reXcor tables sample only two spin values, two lamppost heights, and two Eddington ratios; extending the grid to lower spin and larger height would reveal whether the hf > fx result is robust or a grid artifact.
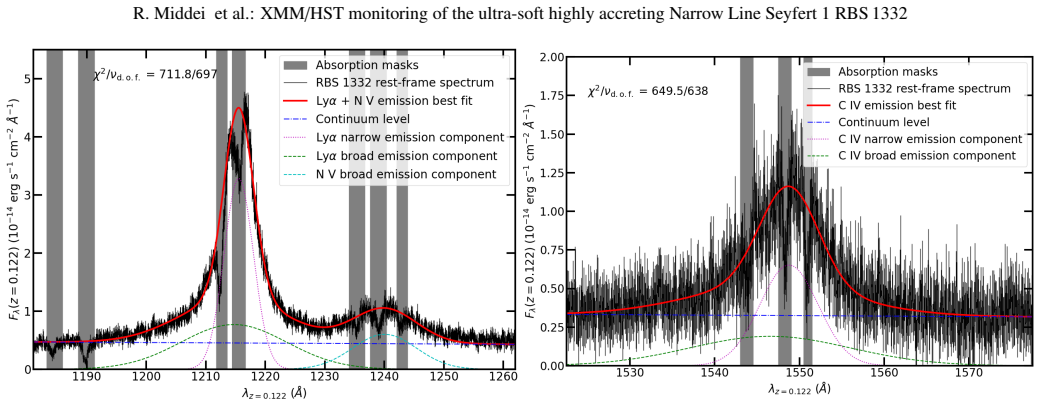
- The stable mini-BAL outflow seen in Lyα, N V, and C IV may be the same gas that seeds the warm corona; correlating UV trough variability with X-ray spectral changes over longer campaigns could connect the two systems.
- Repeating this HST plus XMM-Newton campaign design on other US-NLSy1 galaxies would test whether the two-coronae structure is a general property of the class.
Editorial analysis
A structured set of objections, weighed in public.
Referee Report
Summary. This paper presents a joint XMM-Newton/HST monitoring campaign of the ultra-soft narrow-line Seyfert 1 RBS 1332, consisting of five X-ray epochs and three HST/COS epochs. The UV analysis characterizes the continuum, broad emission lines, and a set of mini-BAL-like absorption troughs in Lyα, N V, and C IV, interpreted as an ionized outflow; from these data the authors derive MBH, Lbol, and Eddington ratio. The broadband UV-to-X-ray spectra are then modeled within three frameworks: pure relativistic reflection with relxillcp, warm Comptonization with the two-coronae model and with AGNSED, and the combined reXcor model. The warm Comptonization models fit better than pure reflection (χ²=739/680 vs 882/691), and the reXcor fit yields a large warm-corona dissipation fraction (h_f≈0.55–0.76) with a small lamppost fraction (f_x≲0.14), leading to the conclusion that the soft X-ray excess is dominated by warm Comptonization with only marginal relativistic reflection. The paper also reports X-ray variability, two independent Eddington-ratio estimates, and physical sizes of the hot and warm coronal regions.
Significance. If the quantitative decomposition holds, this is a valuable multiwavelength test of the warm-corona scenario in an extreme, highly accreting NLSy1, using a clean line of sight and simultaneous UV/X-ray coverage. The model comparison between pure reflection and warm Comptonization is transparent and the statistical preference for warm Comptonization is clear from the reported χ² values. The AGNSED fit adds physical plausibility by providing internally consistent radial scales for the warm and hot coronae. The main limitation is that the central 'marginal reflection' statement rests on reXcor tables computed for an Eddington ratio of 10%, whereas the paper itself estimates the source to accrete at roughly 40–90% of Eddington; this makes the quantitative warm-vs-lamppost split less secure than the qualitative preference for warm Comptonization.
major comments (3)
- [Section 4.3, Table 9] The reXcor decomposition uses a fixed table with Eddington ratio λ=0.1, while the paper's own estimates are ε_Edd≈0.4 from the FUV analysis (Sect. 3.1) and ≈0.9 from X-ray variability (Sect. 5). Because the warm-corona temperature, optical depth, and reflection ionization in reXcor depend on the assumed Eddington ratio, the fitted f_x and h_f values that support the 'marginal reflection' conclusion could be biased. The acknowledgement in Sect. 5 that the available grid has a 'moderate parameter range' is not a quantitative substitute for a sensitivity test; the authors should show whether f_x and h_f are stable when the Eddington ratio or other grid parameters are varied, or explicitly reinterpret the quoted h_f>f_x result as a grid-dependent upper limit.
- [Section 4.3] The reXcor fit excludes data below 0.5 keV because the model's photon-index range cannot reproduce the softest bins, and the paper states without supporting numbers that this exclusion does not modify f_x or h_f. Since RBS 1332 is ultra-soft and the excluded band is where the soft excess is strongest, this robustness claim is load-bearing and not verifiable from the reported tables. The authors should report the full-band reXcor fit, including its fit statistic and best-fit parameters even if the fit is formally poor, and compare those parameters with the truncated-band values.
- [Section 4.3, Table 9] The best-fit reXcor photon indices are at or above the upper limit of the table's allowed range (Γ>2.19 for three epochs and Γ=2.18 for the other two), so the solution sits at the boundary of the model grid. This boundary behavior could artificially force the decomposition toward small lamppost fractions, and the paper does not discuss whether f_x is also at a boundary or prior limit. The authors should check and report whether f_x is pegged at its allowed range and should compare the reXcor decomposition with the two-coronae model over the same 0.5–10 keV band to show that the quantitative warm-vs-lamppost split is not an artifact of the restricted grid.
minor comments (6)
- [Section 5] In the final paragraph, 'wavelentgh' should be 'wavelength'.
- [Section 4.2] The text refers to 'Thompson opacity'; the correct term is Thomson opacity.
- [Table 7] The flux entries are listed as negative numbers (e.g., −11.20) with no table caption or column header indicating that these are logarithms; please clarify the units and the convention used.
- [Section 5] The citation 'Tortosa et al. but see also 2023' is malformed and should be corrected to a proper reference.
- [Abstract and Section 3.2] The abstract states the absorption velocities as 'from ~1500 km s−1 to ~1700 km s−1', but the text in Sect. 3.2 gives the range as spanning from about −1500 to +1700 km s−1; the signs should be made explicit and consistent.
- [Figure 2] The y-axis label appears as 'Wl' and should be replaced with a meaningful label such as the observed flux or count rate, and the OM filter names in the legend should be defined.
Circularity Check
No significant circularity: the warm-corona vs lamppost conclusion is a fitted model comparison using external tables, not a derivation forced by its inputs.
full rationale
The paper's central claim, that the soft X-ray excess of RBS 1332 is dominated by warm Comptonization with only marginal lamppost reflection, is a model-selection result based on fitting new XMM-Newton and HST data with external spectral models (relxillcp, nthcomp, AGNSED, and reXcor). The reXcor tables come from Xiang et al. (2022) and Ballantyne et al. (2024); although one coauthor of the present paper appears among the reXcor authors, the model grid is independently published and the paper's conclusion is supported by the reported fit statistics (e.g., two-coronae chi2/d.o.f.=739/680 vs relativistic reflection 882/691). The quantities f_x and h_f in Table 9 are free parameters fitted to the data, not predictions derived from the model; the conclusion is an interpretation of those fitted values. The acknowledged limitations, namely the fixed reXcor grid (a=0.99, h=5 Rg, lambda=0.1) and the exclusion of data below 0.5 keV, are model-validity concerns rather than circular steps, because no input is defined in terms of the output and no fitted parameter is renamed as a prediction. There are self-citations to the two-coronae framework, but they are contextual and not load-bearing: the warm-Comptonization preference is independently earned by the broadband chi2 comparison. The derivation chain is therefore self-contained against external benchmarks, and no specific circular reduction can be exhibited.
Assumptions & free parameters
free parameters (3)
- reXcor fixed grid parameters (spin, lamppost height, lambda, Eddington ratio) =
a=0.99, h=5 Rg, lambda=0.1, Eddington ratio=10%
- Hot corona temperature kT =
50 keV (fixed)
- AGNSED fixed parameters (inclination, spin, scale height) =
inclination=30 deg, spin=0.5, HTmax=10 Rg
assumptions (4)
- standard math Standard Shakura-Sunyaev thin disk model with RISCO=6GM/c^2 for a non-rotating BH.
- domain assumption Comptonization models (nthcomp, thcomp) and reflection models (relxillcp, reXcor) as implemented in XSPEC accurately describe the emission processes.
- domain assumption The C IV-based BH mass scaling relation (Vestergaard & Peterson 2006) is valid for RBS 1332.
- domain assumption The UV absorption troughs are intrinsic to RBS 1332 and not due to intervening material or airglow.
Cite this review
Pith. "Pith review of XMM/HST monitoring of the ultra-soft highly accreting Narrow Line Seyfert 1 RBS 1332." pith.science (2026). https://pith.science/paper/PK6CNMLU
@misc{pith2026250109220,
  author       = {Pith},
  title        = {Pith review of: XMM/HST monitoring of the ultra-soft highly accreting Narrow Line Seyfert 1 RBS 1332},
  year         = {2026},
  howpublished = {\url{https://pith.science/paper/PK6CNMLU}},
  note         = {Machine review of arXiv:2501.09220}
}
read the original abstract
Ultra-soft narrow line Seyfert 1 (US-NLSy) are a poorly observed class of active galactic nuclei characterized by significant flux changes and an extreme soft X-ray excess. This peculiar spectral shape represents a golden opportunity to test whether the standard framework commonly adopted for modelling local AGN is still valid. We thus present the results on the joint XMM-Newton and HST monitoring campaign of the highly accreting US-NLSy RBS 1332. The optical-to-UV spectrum of RBS 1332 exhibits evidence of both a stratified narrow-line region and an ionized outflow, that produces absorption troughs over a wide range of velocities (from ~1500 km s-1 to ~1700 km s-1) in several high-ionization transitions (Lyalpha, N V, C IV). From a spectroscopic point of view, the optical/UV/FUV/X-rays emission of this source is due to the superposition of three distinct components which are best modelled in the context of the two-coronae framework in which the radiation of RBS 1332 can be ascribed to a standard outer disk, a warm Comptonization region and a soft coronal continuum. The present dataset is not compatible with a pure relativistic reflection scenario. Finally, the adoption of the novel model reXcor allowed us to determine that the soft X-ray excess in RBS 1332 is dominated by the emission of the optically thick and warm Comptonizing medium, and only marginal contribution is expected from relativistic reflection from a lamppost-like corona.
Figures


Figures from the paper (6 more)



Reference graph
Works this paper leans on
-
[1]
N., Vaughan, S., & Uttley, P
Alston, W. N., Vaughan, S., & Uttley, P. 2013, MNRAS, 435, 1511 Arévalo, P., Papadakis, I., Kuhlbrodt, B., & Brinkmann, W. 2005, A&A, 430, 435
2013
-
[2]
Arnaud, K. A. 1996, in Astronomical Society of the Pacific Conference Series, V ol. 101, Astronomical Data Analysis Software and Systems V , ed. G. H. Jacoby & J. Barnes, 17
1996
-
[3]
& Rothenflug, R
Arnaud, M. & Rothenflug, R. 1985, A&AS, 60, 425
1985
-
[4]
H., Engels, D., et al
Bade, N., Fink, H. H., Engels, D., et al. 1995, A&AS, 110, 469
1995
-
[5]
R., Sudhakar, V ., Fairfax, D., et al
Ballantyne, D. R., Sudhakar, V ., Fairfax, D., et al. 2024, MNRAS, 530, 1603
2024
-
[6]
A., Junkkarinen, V
Barlow, T. A., Junkkarinen, V . T., Burbidge, E. M., et al. 1992, ApJ, 397, 81
1992
-
[7]
& Mushotzky, R
Barr, P. & Mushotzky, R. F. 1986, Nature, 320, 421
1986
-
[8]
2009, A&A, 495, 421
Bianchi, S., Guainazzi, M., Matt, G., Fonseca Bonilla, N., & Ponti, G. 2009, A&A, 495, 421
2009
Show all 117 references
-
[9]
R., Bershady, M
Blanton, M. R., Bershady, M. A., Abolfathi, B., et al. 2017, AJ, 154, 28
2017
-
[10]
Boroson, T. A. & Green, R. F. 1992, ApJS, 80, 109
1992
-
[11]
Buisson, D. J. K., Lohfink, A. M., Alston, W. N., & Fabian, A. C. 2017, MNRAS, 464, 3194
2017
-
[12]
M., Gelbord, J., Barth, A
Cackett, E. M., Gelbord, J., Barth, A. J., et al. 2023, ApJ, 958, 195
2023
-
[13]
M., Binney, J., et al
Cattaneo, A., Faber, S. M., Binney, J., et al. 2009, Nature, 460, 213
2009
-
[14]
2018, Nature Astronomy, 2, 176
Cicone, C., Brusa, M., Ramos Almeida, C., et al. 2018, Nature Astronomy, 2, 176
2018
-
[15]
C., Gallo, L., & Ross, R
Crummy, J., Fabian, A. C., Gallo, L., & Ross, R. R. 2006, MNRAS, 365, 1067
2006
-
[16]
C., Proga, D., Waters, T., & Dyda, S
Dannen, R. C., Proga, D., Waters, T., & Dyda, S. 2020, ApJ, 893, L34
2020
-
[17]
J., et al
Dauser, T., García, J., Walton, D. J., et al. 2016, A&A, 590, A76
2016
-
[18]
Denney, K. D. 2012, ApJ, 759, 44
2012
-
[19]
W., Jin, C., Blaes, O., & Ward, M
Done, C., Davis, S. W., Jin, C., Blaes, O., & Ward, M. 2012, MNRAS, 420, 1848
2012
-
[20]
2015, ApJ, 806, 22
Du, P., Hu, C., Lu, K.-X., et al. 2015, ApJ, 806, 22
2015
-
[21]
2020, A&A, 636, A73
Duras, F., Bongiorno, A., Ricci, F., et al. 2020, A&A, 636, A73
2020
-
[22]
2019, ApJ, 870, 123
Edelson, R., Gelbord, J., Cackett, E., et al. 2019, ApJ, 870, 123
2019
-
[23]
M., Horne, K., et al
Edelson, R., Gelbord, J. M., Horne, K., et al. 2015, ApJ, 806, 129
2015
-
[24]
Fabian, A. C. 2012, ARA&A, 50, 455
2012
-
[25]
C., Lohfink, A., Kara, E., et al
Fabian, A. C., Lohfink, A., Kara, E., et al. 2015, MNRAS, 451, 4375
2015
-
[26]
J., Korista, K
Ferland, G. J., Korista, K. T., Verner, D. A., et al. 1998, PASP, 110, 761
1998
-
[27]
2018, in Revisiting Narrow-Line Seyfert 1 Galaxies and their Place in the Universe, 34 García, J., Dauser, T., Lohfink, A., et al
Gallo, L. 2018, in Revisiting Narrow-Line Seyfert 1 Galaxies and their Place in the Universe, 34 García, J., Dauser, T., Lohfink, A., et al. 2014, ApJ, 782, 76 García, J. A., Kara, E., Walton, D., et al. 2019, ApJ, 871, 88
2018
-
[28]
Gaskell, C. M. & Goosmann, R. W. 2016, Ap&SS, 361, 67
2016
-
[29]
George, I. M. & Fabian, A. C. 1991, MNRAS, 249, 352
1991
-
[30]
& Williams, J
Gliozzi, M. & Williams, J. K. 2020, MNRAS, 491, 532
2020
-
[31]
Goodrich, R. W. 1989, ApJ, 342, 224
1989
-
[32]
R., McHardy, I
Green, A. R., McHardy, I. M., & Lehto, H. J. 1993, MNRAS, 265, 664 R. Middei et al.: XMM /HST monitoring of the ultra-soft highly accreting Narrow Line Seyfert 1 RBS 1332
1993
-
[33]
C., Froning, C
Green, J. C., Froning, C. S., Osterman, S., et al. 2012, ApJ, 744, 60
2012
-
[34]
M., & Page, K
Grupe, D., Komossa, S., Leighly, K. M., & Page, K. L. 2010, ApJS, 187, 64
2010
-
[35]
J., Leighly, K
Grupe, D., Wills, B. J., Leighly, K. M., & Meusinger, H. 2004, AJ, 127, 156
2004
-
[36]
& Maraschi, L
Haardt, F. & Maraschi, L. 1991, ApJ, 380, L51
1991
-
[37]
& Maraschi, L
Haardt, F. & Maraschi, L. 1993, ApJ, 413, 507
1993
-
[38]
B., Anosov, K., White, R
Hall, P. B., Anosov, K., White, R. L., et al. 2011, MNRAS, 411, 2653 HI4PI Collaboration, Ben Bekhti, N., Flöer, L., et al. 2016, A&A, 594, A116
2011
-
[39]
C., Fabian, A
Jiang, J., Gallo, L. C., Fabian, A. C., Parker, M. L., & Reynolds, C. S. 2020, MNRAS, 498, 3888
2020
-
[40]
2018, A&A, 618, A6
Kakkad, D., Groves, B., Dopita, M., et al. 2018, A&A, 618, A6
2018
-
[41]
2016, A&A, 592, A148
Kakkad, D., Mainieri, V ., Padovani, P., et al. 2016, A&A, 592, A148
2016
-
[42]
S., Papadakis, I
Kammoun, E. S., Papadakis, I. E., & Dovˇciak, M. 2021, MNRAS, 503, 4163
2021
-
[43]
A., et al
Kamraj, N., Brightman, M., Harrison, F. A., et al. 2022, ApJ, 927, 42
2022
-
[44]
2024, NIST Atomic Spectra Database
Kramida, A., Ralchenko, Y ., Reader, J., & NIST ASD Team. 2024, NIST Atomic Spectra Database
2024
-
[45]
2010, ApJ, 724, L203
Krongold, Y ., Binette, L., & Hernández-Ibarra, F. 2010, ApJ, 724, L203
2010
-
[46]
& Done, C
Kubota, A. & Done, C. 2018, MNRAS, 480, 1247
2018
-
[47]
& Papadakis, I
Lawrence, A. & Papadakis, I. 1993, ApJ, 414, L85
1993
-
[48]
M., Reynolds, C
Lohfink, A. M., Reynolds, C. S., Vasudevan, R., Mushotzky, R. F., & Miller, N. A. 2014, ApJ, 788, 10
2014
-
[49]
Lynds, C. R. 1967, ApJ, 147, 396
1967
-
[50]
& Zdziarski, A
Magdziarz, P. & Zdziarski, A. A. 1995, MNRAS, 273, 837
1995
-
[51]
2014, ApJ, 782, L25
Malizia, A., Molina, M., Bassani, L., et al. 2014, ApJ, 782, L25
2014
-
[52]
N., Parker, M
Mallick, L., Alston, W. N., Parker, M. L., et al. 2018, MNRAS, 479, 615
2018
-
[53]
2022, A&A, 666, A169
Marinucci, A., Vietri, G., Piconcelli, E., et al. 2022, A&A, 666, A169
2022
-
[54]
2003, ApJ, 593, 96
Markowitz, A., Edelson, R., Vaughan, S., et al. 2003, ApJ, 593, 96
2003
-
[55]
O., Breeveld, A., Much, R., et al
Mason, K. O., Breeveld, A., Much, R., et al. 2001, A&A, 365, L36
2001
-
[56]
O., McHardy, I
Mason, K. O., McHardy, I. M., Page, M. J., et al. 2002, ApJ, 580, L117
2002
-
[57]
A., Nardini, E., Parker, M
Matzeu, G. A., Nardini, E., Parker, M. L., et al. 2020, MNRAS, 497, 2352
2020
-
[58]
M., Koerding, E., Knigge, C., Uttley, P., & Fender, R
McHardy, I. M., Koerding, E., Knigge, C., Uttley, P., & Fender, R. P. 2006, Nature, 444, 730
2006
-
[59]
S., Kriss, G
Mehdipour, M., Kaastra, J. S., Kriss, G. A., et al. 2015, A&A, 575, A22
2015
-
[60]
A., Kaastra, J
Mehdipour, M., Kriss, G. A., Kaastra, J. S., Costantini, E., & Mao, J. 2023, ApJ, 952, L5
2023
-
[61]
2018, A&A, 615, A163
Middei, R., Bianchi, S., Cappi, M., et al. 2018, A&A, 615, A163
2018
-
[62]
O., Bianchi, S., et al
Middei, R., Petrucci, P. O., Bianchi, S., et al. 2020, A&A, 640, A99
2020
-
[63]
O., Bianchi, S., et al
Middei, R., Petrucci, P. O., Bianchi, S., et al. 2023, A&A, 672, A101
2023
-
[64]
& Chiang, J
Murray, N. & Chiang, J. 1995, ApJ, 454, L105
1995
-
[65]
2019, MNRAS, 482, L134
Nardini, E., Lusso, E., & Bisogni, S. 2019, MNRAS, 482, L134
2019
-
[66]
Novikov, I. D. & Thorne, K. S. 1973, in Black Holes (Les Astres Occlus), 343– 450
1973
-
[67]
Osterbrock, D. E. 1977, ApJ, 215, 733
1977
-
[68]
M., Assef, R
Padovani, P., Alexander, D. M., Assef, R. J., et al. 2017, A&A Rev., 25, 2
2017
-
[69]
O., et al
Palit, B., Rozanska, A., Petrucci, P. O., et al. 2024, arXiv e-prints, arXiv:2406.14378
2024 arXiv
-
[70]
E., Brandt, W
Paolillo, M., Papadakis, I. E., Brandt, W. N., et al. 2023, A&A, 673, A68
2023
-
[71]
Papadakis, I. E. 2004, MNRAS, 348, 207
2004
-
[72]
2024, arXiv e-prints, arXiv:2411.13698
Perna, M., Arribas, S., Ji, X., et al. 2024, arXiv e-prints, arXiv:2411.13698
2024 arXiv
-
[73]
2015, A&A, 574, A82
Perna, M., Brusa, M., Cresci, G., et al. 2015, A&A, 574, A82
2015
-
[74]
2017, A&A, 606, A96
Perna, M., Lanzuisi, G., Brusa, M., Cresci, G., & Mignoli, M. 2017, A&A, 606, A96
2017
-
[75]
C., Matt, G., Fiore, F., et al
Perola, G. C., Matt, G., Fiore, F., et al. 2000, A&A, 358, 117
2000
-
[76]
O., Gronkiewicz, D., Rozanska, A., et al
Petrucci, P. O., Gronkiewicz, D., Rozanska, A., et al. 2020, A&A, 634, A85
2020
-
[77]
O., Paltani, S., Malzac, J., et al
Petrucci, P. O., Paltani, S., Malzac, J., et al. 2013, A&A, 549, A73
2013
-
[78]
O., Ursini, F., De Rosa, A., et al
Petrucci, P. O., Ursini, F., De Rosa, A., et al. 2018, A&A, 611, A59
2018
-
[79]
2004, MNRAS, 351, 161
Piconcelli, E., Jimenez-Bailón, E., Guainazzi, M., et al. 2004, MNRAS, 351, 161
2004
-
[80]
2012, A&A, 542, A83
Ponti, G., Papadakis, I., Bianchi, S., et al. 2012, A&A, 542, A83
2012
-
[81]
2024, A&A, 681, A40
Porquet, D., Hagen, S., Grosso, N., et al. 2024, A&A, 681, A40
2024
-
[82]
N., Grosso, N., Braito, V ., & Lobban, A
Porquet, D., Reeves, J. N., Grosso, N., Braito, V ., & Lobban, A. 2021, A&A, 654, A89
2021
-
[83]
N., Matt, G., et al
Porquet, D., Reeves, J. N., Matt, G., et al. 2018, A&A, 609, A42
2018
-
[84]
M., & Kallman, T
Proga, D., Stone, J. M., & Kallman, T. R. 2000, ApJ, 543, 686
2000
-
[85]
Reynolds, C. S. 1997, MNRAS, 286, 513
1997
-
[86]
& Elvis, M
Risaliti, G. & Elvis, M. 2010, A&A, 516, A89
2010
-
[87]
2011, MNRAS, 410, 1027
Risaliti, G., Nardini, E., Salvati, M., et al. 2011, MNRAS, 410, 1027
2011
-
[88]
Robertson, D. R. S., Gallo, L. C., Zoghbi, A., & Fabian, A. C. 2015, MNRAS, 453, 3455
2015
-
[89]
Rybicki, G. B. & Lightman, A. P. 1979, Radiative processes in astrophysics
1979
-
[90]
G., Bischetti, M., Piconcelli, E., et al
Saturni, F. G., Bischetti, M., Piconcelli, E., et al. 2018, A&A, 617, A118
2018
-
[91]
G., Trevese, D., Vagnetti, F., Perna, M., & Dadina, M
Saturni, F. G., Trevese, D., Vagnetti, F., Perna, M., & Dadina, M. 2016, A&A, 587, A43
2016
-
[92]
G., Vietri, G., Piconcelli, E., et al
Saturni, F. G., Vietri, G., Piconcelli, E., et al. 2021, A&A, 654, A154
2021
-
[93]
Savage, B. D. & Sembach, K. R. 1991, ApJ, 379, 245
1991
-
[94]
Schlafly, E. F. & Finkbeiner, D. P. 2011, ApJ, 737, 103
2011
-
[95]
Shakura, N. I. & Sunyaev, R. A. 1973, A&A, 24, 337
1973
-
[96]
& Vaughan, S
Smith, R. & Vaughan, S. 2007, MNRAS, 375, 1479 Strüder, L., Briel, U., Dennerl, K., et al. 2001, A&A, 365, L18
2007
-
[97]
Sunyaev, R. A. & Titarchuk, L. G. 1980, A&A, 86, 121
1980
-
[98]
Tortosa, A., Bianchi, S., Marinucci, A., Matt, G., & Petrucci, P. O. 2018, A&A, 614, A37
2018
-
[99]
2023, MNRAS, 526, 1687
Tortosa, A., Ricci, C., Arévalo, P., et al. 2023, MNRAS, 526, 1687
2023
-
[100]
G., Vagnetti, F., et al
Trevese, D., Saturni, F. G., Vagnetti, F., et al. 2013, A&A, 557, A91
2013
-
[101]
Turner, M. J. L., Abbey, A., Arnaud, M., et al. 2001, A&A, 365, L27
2001
-
[102]
O., Bianchi, S., et al
Ursini, F., Petrucci, P. O., Bianchi, S., et al. 2020, A&A, 634, A92
2020
-
[103]
O., Matt, G., et al
Ursini, F., Petrucci, P. O., Matt, G., et al. 2018, MNRAS, 478, 2663
2018
-
[104]
2016, A&A, 593, A55
Vagnetti, F., Middei, R., Antonucci, M., Paolillo, M., & Serafinelli, R. 2016, A&A, 593, A55
2016
-
[105]
2024, arXiv e-prints, arXiv:2405.13479 Vanden Berk, D
Vaia, B., Ursini, F., Matt, G., et al. 2024, arXiv e-prints, arXiv:2405.13479 Vanden Berk, D. E., Richards, G. T., Bauer, A., et al. 2001, AJ, 122, 549
2024 arXiv
-
[106]
S., & Uttley, P
Vaughan, S., Edelson, R., Warwick, R. S., & Uttley, P. 2003, MNRAS, 345, 1271
2003
-
[107]
& Peterson, B
Vestergaard, M. & Peterson, B. M. 2006, ApJ, 641, 689
2006
-
[108]
2018, A&A, 617, A81
Vietri, G., Piconcelli, E., Bischetti, M., et al. 2018, A&A, 617, A81
2018
-
[109]
J., Nardini, E., Fabian, A
Walton, D. J., Nardini, E., Fabian, A. C., Gallo, L. C., & Reis, R. C. 2013, MN- RAS, 428, 2901
2013
-
[110]
Wang, J. & Xu, D. W. 2015, A&A, 573, A15
2015
-
[111]
R., Costa, T., Harrison, C
Ward, S. R., Costa, T., Harrison, C. M., & Mainieri, V . 2024, arXiv e-prints, arXiv:2407.17593
2024 arXiv
-
[112]
J., Morris, S
Weymann, R. J., Morris, S. L., Foltz, C. B., & Hewett, P. C. 1991, ApJ, 373, 23
1991
-
[113]
R., Ward, M., & Collinson, J
Wildy, C., Landt, H., Goad, M. R., Ward, M., & Collinson, J. S. 2016, MNRAS, 461, 2085
2016
-
[114]
& Shen, Y
Wu, Q. & Shen, Y . 2022, ApJS, 263, 42
2022
-
[115]
R., Bianchi, S., et al
Xiang, X., Ballantyne, D. R., Bianchi, S., et al. 2022, MNRAS, 515, 353
2022
-
[116]
2021, MNRAS, 507, 3572
Xu, X., Ding, N., Gu, Q., Guo, X., & Contini, E. 2021, MNRAS, 507, 3572
2021
-
[117]
A., Johnson, W
Zdziarski, A. A., Johnson, W. N., & Magdziarz, P. 1996, MNRAS, 283, 193 ˙Zycki, P. T., Done, C., & Smith, D. A. 1999, MNRAS, 309, 561 Article number, page 13 of 13
1996
Reviewed August 10, 2026 · model on record in the stance chip above.
Discussion (0). Continue with ORCID to comment.