REVIEW 2 major objections 4 minor 56 references
WALLABY Pilot Survey & ASymba: Comparing HI Detection Asymmetries to the SIMBA Simulation
T0 review · 2 major / 4 minor · reviewed 2026-08-10 · deepseek-v4-flash
Pith's one-line read After matching mass and noise, WALLABY and SIMBA H I asymmetries agree, and the most asymmetric WALLABY systems are interactions or tidal tails.
desk verdict A careful pilot null result with a genuinely useful new mock method, but the size/resolution matching confound means the null is not yet robust. read the letter →
The pith
A machine-rendered reading of the paper's core claim, the machinery that carries it, and where it could break.
The reading
What carries the argument
Two objects carry the argument. The first is the 3D asymmetry $A_{\rm 3D}$, the ratio of squared odd to squared even parts of the H I datacube about a center, with a background correction $B = 2N\sigma^2$ that removes the Gaussian-noise contribution; the 1D asymmetry $A_{\rm 1D}$ is the same ratio on the flux summed over the spectral axis, equivalent to the channel-by-channel asymmetry. The second is the Scanline Tracing mock generator: it interpolates the smoothed density, line-of-sight velocity and velocity-dispersion fields of the simulation on a grid, evaluates a locally Gaussian spectrum at each scanline step, and then convolves with the 30 arcsecond beam. By enforcing locally Gaussian spectra, it avoids the velocity-space shot noise of the particle-based approach and changes $A_{\rm 3D}$ by up to roughly 0.3 for low-mass SIMBA galaxies.
What would settle it
Compute the distribution of on-sky sizes ($\mathrm{ell}_{\rm maj}$ or $R_{\rm HI}$) for the matched SIMBA mocks and compare it to the WALLABY detections: if SIMBA galaxies are systematically smaller at fixed H I mass, then the matched comparison is biased and the $p = 5.4\%$ cannot be read as evidence that the simulation reproduces observed asymmetry.
Extended reading notes
Core claim
The paper claims that, at current sample sizes, the WALLABY Pilot Survey and the SIMBA 50 Mpc simulation produce the same population of H I asymmetries once observing parameters are controlled. To reach this claim it introduces Scanline Tracing, a mock-observation method that samples simulated gas fields along lines of sight rather than adding a per-particle Gaussian spectrum; this removes shot noise that artificially raises asymmetry in low-particle-number mocks. Each WALLABY detection is matched to a SIMBA galaxy within 0.2 dex in H I mass, placed at the same distance and inclination, given Gaussian noise at the observed RMS, and then passed through the same source finder before $A_{\rm 1D}$ and $A_{\rm 3D}$ are measured. The resulting PQMass test gives $p = 5.4 \pm 0.2\%$ that the two point clouds in the $A_{\rm 1D}$--$A_{\rm 3D}$ plane come from the same distribution, so the paper concludes the distributions are consistent while noting an excess of high-$A_{\rm 3D}$ detections in WALLABY and an excess of moderate-$A_{\rm 1D}$, low-$A_{\rm 3D}$ mocks in SIMBA.
Load-bearing premise
The load-bearing premise is that a SIMBA galaxy selected only by H I mass (within 0.2 dex) and then projected at the WALLABY distance and inclination ends up with the same spatial resolution and disk sizes as real WALLABY detections; the paper itself flags in Section 4.2 that SIMBA disks may be smaller at fixed $M_{\rm HI}$, which would lower $A_{\rm 3D}$ in the mocks and make the agreement look better than it is.
Editorial extensions
If this is right
- $A_{\rm 3D} > 0.5$ can be used as a selection cut in untargeted H I surveys to find interacting galaxies and tidal features without multi-wavelength data.
- The Scanline Tracing recipe can produce WALLABY-like mocks from any SPH or MFM cosmological simulation, making asymmetry comparisons a standard morphometric test.
- Full WALLABY data will decide whether the apparent excess of extreme 3D asymmetries over SIMBA is real; if it is, it may indicate missing merger or tidal physics or environmental selection in the pilot fields.
- Kinematic modelling success is not strongly anti-correlated with asymmetry, so asymmetry adds independent information beyond rotation-curve fitting.
Reading between the lines
- If the high-$A_{\rm 3D}$ excess survives the full survey, the likely culprits are the hot SIMBA IGM suppressing cold bridges and tails, or the pilot fields' group and cluster environments preferentially selecting interactions; the paper names both candidates, and an environment-stratified comparison would separate them.
- The SIMBA overpopulation at moderate $A_{\rm 1D}$ and low $A_{\rm 3D}$ can be tested directly by measuring the H I size--mass relation in the matched mocks; if SIMBA disks are smaller than WALLABY's at fixed $M_{\rm HI}$, the low $A_{\rm 3D}$ is a resolution artifact and the agreement is partly built into the matching scheme.
- The same matched-mock protocol could be applied to the other SIMBA 50 Mpc feedback variants to see which subgrid physics moves the $A_{\rm 1D}$--$A_{\rm 3D}$ plane, turning the p-value into a physics discriminator rather than a pass/fail test.
Editorial analysis
A structured set of objections, weighed in public.
Referee Report
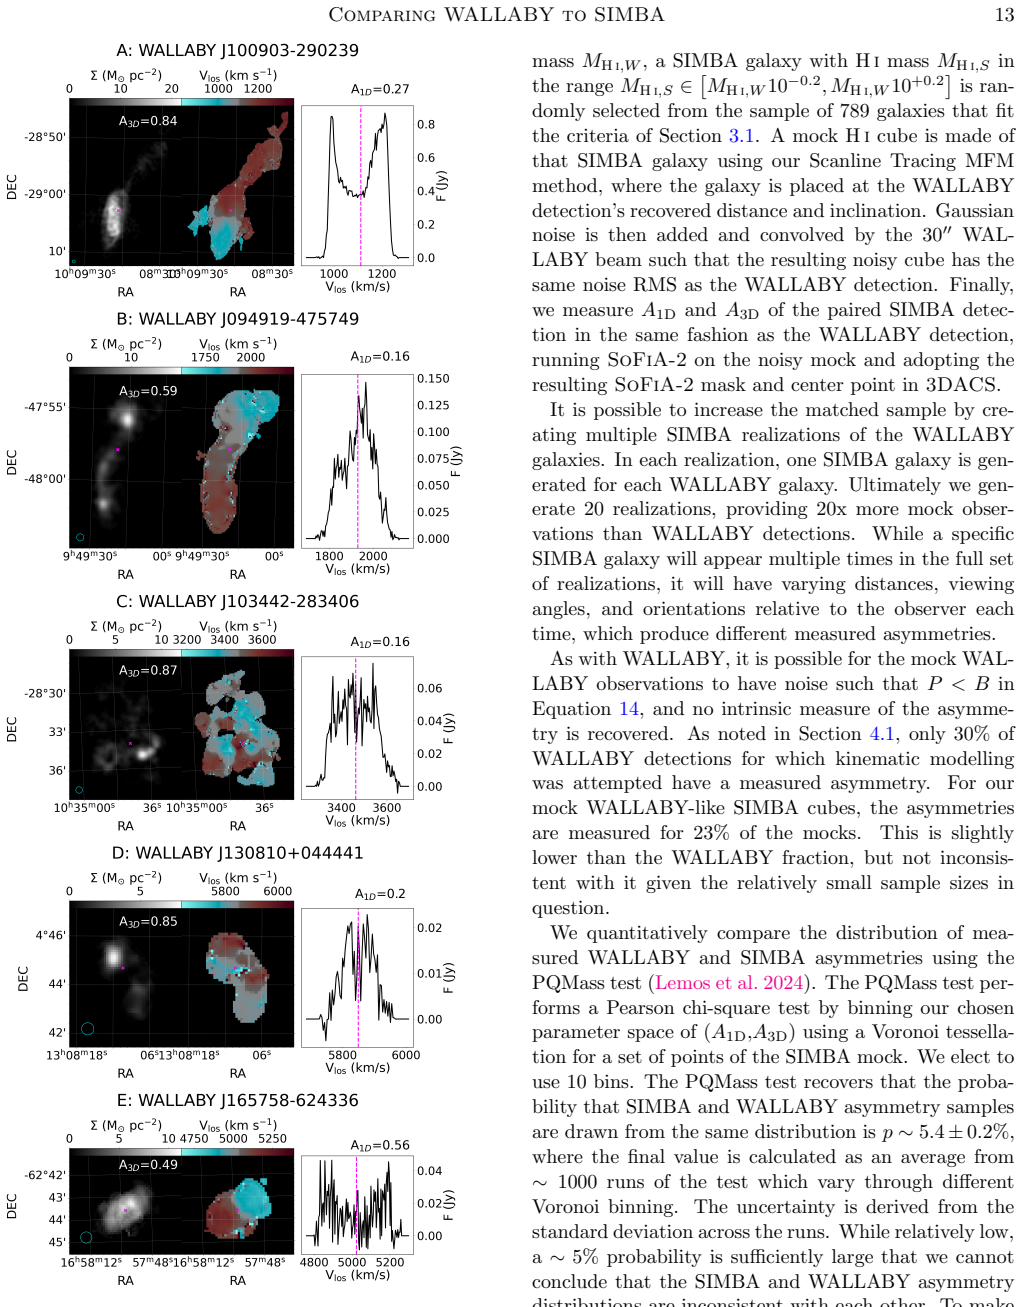
Summary. The paper presents the second ASymba study, comparing H I asymmetries in WALLABY Pilot Survey detections with mock observations constructed from the SIMBA 50 Mpc cosmological simulation. The authors introduce a Scanline Tracing method for building mock H I datacubes that reduces spectral shot noise compared to particle-based MARTINI mocks. Using the 3DACS code, they measure 1D and 3D asymmetries for 116 WALLABY detections with log10(M_HI/M_sun) >= 9.2 and for 20 WALLABY-like mock realizations matched in H I mass, distance, inclination, and noise RMS. They find that high-A3D WALLABY detections are predominantly interacting systems or systems with strong tidal features. A PQMass test yields p ~ 5.4 +/- 0.2%, which the authors interpret as no statistically significant difference between the WALLABY and SIMBA asymmetry distributions, while noting hints of excess at high A3D and a possible under-resolution of SIMBA mocks in the moderate-A1D, low-A3D region.
Significance. If the null result is robust, the paper provides one of the first quantitative comparisons of 3D H I asymmetries between an untargeted survey and a cosmological simulation, and it offers a mock-generation method that is valuable for low-particle-number regimes. The authors give explicit sample definitions, validate the Scanline Tracing method on noiseless cubes, and apply a formal two-sample statistical test (PQMass). The main limitation is that the central claim is a null result whose robustness depends on the matched mocks being comparable in angular resolution; this is not yet demonstrated. The work is a useful methodological contribution and a step toward larger survey-simulation comparisons, but the current evidence for the null result is not fully conclusive.
major comments (2)
- [Section 4.2 and Figure 11] The mock matching controls for H I mass (within 0.2 dex), distance, inclination, and noise RMS, but not for angular size or number of resolution elements. Because A3D is resolution-dependent, a systematic offset in H I disk size at fixed mass between SIMBA and WALLABY would suppress A3D in the mocks, biasing the PQMass p-value toward agreement. The authors acknowledge this possibility for the moderate-A1D, low-A3D region, but the same mechanism can also suppress the high-A3D, low-A1D tail where WALLABY shows an excess. In addition, the WALLABY sample is defined by the kinematic-modelling criteria (ell_maj > 2 beams or log10(S/N) > 1.25), yet these criteria are not applied to the SIMBA mocks. Please add a quantitative comparison of angular sizes (e.g., the ell_maj distribution) for the matched WALLABY and SIMBA samples, and/or perform a sensitivity test on a size-matched subsample, so that the null result is not an artifact of systematically smaller simulated disks.
- [Section 4.2, PQMass test] The 20 mock realizations repeatedly reuse the same 789 SIMBA galaxies, so the mock points are not independent draws from the simulation population. The quoted p-value uncertainty (+/- 0.2%) reflects only the variation over different Voronoi binnings, not the correlation induced by repeated galaxies viewed from different orientations. Because the same galaxy can appear many times with correlated intrinsic morphology, the effective sample size for the mock distribution may be substantially lower than 20 times the number of WALLABY detections. Please report the number of unique SIMBA galaxies that contribute to the mock sample and assess the sensitivity of the p-value to this correlation, for example by resampling over unique galaxies rather than over individual mock cubes.
minor comments (4)
- [Abstract and Section 4.2] The abstract states "p-value = 0.05" while the text reports "p ~ 5.4 +/- 0.2%"; please use a consistent value and clearly state the uncertainty in the abstract.
- [Section 3.2, near Figure 7] The sentence "We note that in Figure 6, the high and low mass mock cubes split along the 1:1 line..." refers to A3D versus A1D+A2D, which is shown in Figure 7, not Figure 6; please correct the cross-reference.
- [Table 1] The table uses "A3D >= 0" in some rows and "A3D > 0" in others; unify the notation to avoid ambiguity.
- [Figures 9 and 11] Individual error bars on A1D and A3D would aid the interpretation of the distribution comparison, or the authors should at least state the typical uncertainty in the measured asymmetries.
Circularity Check
No significant circularity: the WALLABY–SIMBA asymmetry comparison is not fitted to agree, and the self-cited ASymba/3DACS machinery is independently validated in this paper.
full rationale
The paper's derivation chain is self-contained: the central comparison measures A1D and A3D on WALLABY detections and on SIMBA mocks generated with the new Scanline Tracing method, then tests whether the two (A1D, A3D) distributions are consistent with PQMass. Nothing in this chain is fitted to the asymmetry values being compared. The mock-galaxy matching variables are H I mass (within 0.2 dex), distance, inclination, and noise RMS; asymmetry is the measured outcome, not an input, and the PQMass p ≈ 5.4 ± 0.2% is a result rather than a tuned target. The Scanline Tracing method is introduced and validated against the shot-noise artifacts of MARTINI in noiseless SIMBA cubes (Figures 1–5), so it is an independent methodological development rather than an ansatz whose conclusion is presupposed. Self-citations to Deg et al. (2023) and Glowacki et al. (2022) supply the asymmetry metric and the ASymba framework, but the paper independently demonstrates the metric's behavior on SIMBA mocks (Figures 6–7) and on WALLABY examples (Figure 10), and the load-bearing statistical comparison uses an external test (PQMass). The acknowledged resolution/size limitation in Section 4.2 is a possible systematic bias in the mock construction, not a circular reduction: matching by mass, distance, and noise does not by construction enforce agreement in A3D, and the paper reports a borderline p-value rather than forcing a predetermined conclusion.
Assumptions & free parameters
free parameters (4)
- WALLABY H I mass threshold =
log10(M_HI/Msun) >= 9.2
- PQMass number of bins =
10
- Number of mock realizations =
20
- H I mass matching tolerance =
10^-0.2 to 10^+0.2 times WALLABY M_HI
assumptions (6)
- domain assumption Each scanline sample emits a locally Gaussian spectrum with thermal velocity dispersion (Eq. 5).
- domain assumption Lines of sight are parallel and the small-angle approximation holds (Section 3.1.2).
- domain assumption SIMBA H I fractions and galaxy population are adequate representations of real H I galaxies for this comparison.
- domain assumption SoFiA-2 source-finding centers are unbiased proxies for the asymmetry center in both data and mocks.
- domain assumption Random matching on H I mass alone gives comparable size/resolution distributions.
- domain assumption Gaussian noise model for the background correction B = 2N sigma^2 (Eq. 14).
Cite this review
Pith. "Pith review of WALLABY Pilot Survey & ASymba: Comparing HI Detection Asymmetries to the SIMBA Simulation." pith.science (2026). https://pith.science/paper/7SLZORQU
@misc{pith2026250109547,
  author       = {Pith},
  title        = {Pith review of: WALLABY Pilot Survey & ASymba: Comparing HI Detection Asymmetries to the SIMBA Simulation},
  year         = {2026},
  howpublished = {\url{https://pith.science/paper/7SLZORQU}},
  note         = {Machine review of arXiv:2501.09547}
}
read the original abstract
An avenue for understanding cosmological galaxy formation is to compare morphometric parameters in observations and simulations of galaxy assembly. In this second paper of the ASymba: Asymmetries of HI in SIMBA Galaxies series, we measure atomic gas HI asymmetries in spatially-resolved detections from the untargetted WALLABY survey, and compare them to realizations of WALLABY-like mock samples from the SIMBA cosmological simulations. We develop a Scanline Tracing method to create mock galaxy HI datacubes which minimizes shot noise along the spectral dimension compared to particle-based methods, and therefore spurious asymmetry contributions. We compute 1D and 3D asymmetries for spatially-resolved WALLABY Pilot Survey detections, and find that the highest 3D asymmetries A3D>0.5 stem from interacting systems or detections with strong bridges or tails. We then construct a series of WALLABY-like mock realizations drawn from the SIMBA 50 Mpc simulation volume, and compare their asymmetry distributions. We find that the incidence of high A3D detections is higher in WALLABY than in the SIMBA mocks, but that difference is not statistically significant (p-value = 0.05). The statistical power of quantitative comparisons of asymmetries such as the one presented here will improve as the WALLABY survey progresses, and as simulation volumes and resolutions increase.
Figures


Figures from the paper (6 more)



Reference graph
Works this paper leans on
-
[1]
MARTINI: Mock Array Radio Telescope Interferometry of the Neutral ISM
thebibliography [1] 20pt to REFERENCES 6pt =0pt -12pt 10pt plus 3pt =0pt =0pt =1pt plus 1pt =0pt =0pt -12pt =13pt plus 1pt =20pt =13pt plus 1pt \@M =10000 =-1.0em =0pt =0pt 0pt =0pt =1.0em @enumiv\@empty 10000 10000 `\.\@m \@noitemerr \@latex@warning Empty `thebibliography' environment \@ifnextchar \@reference \@latexerr Missing key on reference command E...
arXiv 1989
-
[2]
W., Narayanan , D., Dav \'e , R., & Thompson , R
Abruzzo , M. W., Narayanan , D., Dav \'e , R., & Thompson , R. 2018, arXiv e-prints, arXiv:1803.02374, 10.48550/arXiv.1803.02374
-
[3]
Bilimogga, P. V., Oman, K. A., Verheijen, M. A. W., & van der Hulst, T. 2022, , 513, 5310, 10.1093/mnras/stac1213
-
[4]
Blyth , S., Baker , A. J., Holwerda , B., et al. 2016, in MeerKAT Science: On the Pathway to the SKA, 4, 10.22323/1.277.0004
-
[5]
Bok , J., Blyth , S. L., Gilbank , D. G., & Elson , E. C. 2019, , 484, 582, 10.1093/mnras/sty3448
- [6]
-
[7]
Conselice , C. J. 2003, , 147, 1, 10.1086/375001
doi:10.1086/375001 2003
-
[8]
2019, , 486, 2827, 10.1093/mnras/stz937
Davé, R., Anglés-Alcázar, D., Narayanan, D., et al. 2019, , 486, 2827, 10.1093/mnras/stz937
Show all 56 references
-
[9]
H., Thompson, R
Davé, R., Rafieferantsoa, M. H., Thompson, R. J., & Hopkins, P. F. 2017, , 467, 115, 10.1093/mnras/stx108
2017 doi
-
[10]
2020, , 495, 1984, 10.1093/mnras/staa1368
Deg, N., Blyth, S.-L., Hank, N., Kruger, S., & Carignan, C. 2020, , 495, 1984, 10.1093/mnras/staa1368
2020 doi
-
[11]
2023, , 523, 4340, 10.1093/mnras/stad1693
Deg, N., Perron-Cormier, M., Spekkens, K., et al. 2023, , 523, 4340, 10.1093/mnras/stad1693
2023 doi
-
[12]
2019, Mock Cube Generator Suite
Deg, N., & Spekkens, K. 2019, Mock Cube Generator Suite. https://github.com/CIRADA-Tools/MCGSuite
2019
-
[13]
2022, Publications of the Astronomical Society of Australia, 39, e059, 10.1017/pasa.2022.43
Deg, N., Spekkens, K., Westmeier, T., et al. 2022, Publications of the Astronomical Society of Australia, 39, e059, 10.1017/pasa.2022.43
2022 doi
-
[14]
2024, arXiv e-prints, arXiv:2411.06993
Deg , N., Arora , N., Spekkens , K., et al. 2024, arXiv e-prints, arXiv:2411.06993. 2411.06993
2024 arXiv
-
[15]
English , J., Richardson , M. L. A., Ferrand , G., & Deg , N. 2024, CosmosCanvas: Useful color maps for different astrophysical properties , Astrophysics Source Code Library, record ascl:2401.005
2024
-
[16]
K., et al
Espada , D., Verdes-Montenegro , L., Huchtmeier , W. K., et al. 2011, , 532, A117, 10.1051/0004-6361/201016117
2011 doi
-
[17]
2024, , 531, 1158, 10.1093/mnras/stae1217
Gensior, J., Feldmann, R., Reina-Campos, M., et al. 2024, , 531, 1158, 10.1093/mnras/stae1217
2024 doi
-
[18]
2016, , 461, 1656, 10.1093/mnras/stw1426
Giese, N., van der Hulst, T., Serra, P., & Oosterloo, T. 2016, , 461, 1656, 10.1093/mnras/stw1426
2016 doi
-
[19]
A., & Monaghan, J
Gingold, R. A., & Monaghan, J. J. 1977, Monthly Notices of the Royal Astronomical Society, 181, 375, 10.1093/mnras/181.3.375
1977 doi
-
[20]
2022, Monthly Notices of the Royal Astronomical Society, 517, 1282, 10.1093/mnras/stac2684
Glowacki, M., Deg, N., Blyth, S.-L., et al. 2022, Monthly Notices of the Royal Astronomical Society, 517, 1282, 10.1093/mnras/stac2684
2022 doi
-
[21]
2020, , 498, 3687, 10.1093/mnras/staa2616
Glowacki, M., Elson, E., & Davé, R. 2020, , 498, 3687, 10.1093/mnras/staa2616
2020 doi
-
[23]
P., Hogg, D
Haynes, M. P., Hogg, D. E., Maddalena, R. J., Roberts, M. S., & van Zee, L. 1998, The Astronomical Journal, 115, 62, 10.1086/300166
1998 doi
-
[24]
W., Pirzkal, N., de Blok, W
Holwerda, B. W., Pirzkal, N., de Blok, W. J. G., et al. 2011, , 416, 2401, 10.1111/j.1365-2966.2011.18938.x
2011
-
[25]
W., Bigiel , F., Bosma , A., et al
Holwerda , B. W., Bigiel , F., Bosma , A., et al. 2023, , 521, 1502, 10.1093/mnras/stad602
2023 doi
-
[26]
Hopkins, P. F. 2015, , 450, 53, 10.1093/mnras/stv195
2015 doi
-
[27]
W., Bunton , J
Hotan , A. W., Bunton , J. D., Chippendale , A. P., et al. 2021, , 38, e009, 10.1017/pasa.2021.1
2021 doi
-
[28]
S., Staveley-Smith, L., Westmeier, T., et al
Koribalski, B. S., Staveley-Smith, L., Westmeier, T., et al. 2020, Astrophysics and Space Science, 365, 118, 10.1007/s10509-020-03831-4
2020 doi
-
[29]
2014, , 445, 1694, 10.1093/mnras/stu1804
Lelli, F., Verheijen, M., & Fraternali, F. 2014, , 445, 1694, 10.1093/mnras/stu1804
2014 doi
-
[30]
2024, PQMass: Probabilistic Assessment of the Quality of Generative Models using Probability Mass Estimation
Lemos, P., Sharief, S., Malkin, N., Perreault-Levasseur, L., & Hezaveh, Y. 2024, PQMass: Probabilistic Assessment of the Quality of Generative Models using Probability Mass Estimation. 2402.04355
2024 arXiv
-
[31]
M., Jonsson , P., Cox , T
Lotz , J. M., Jonsson , P., Cox , T. J., & Primack , J. R. 2008, , 391, 1137, 10.1111/j.1365-2966.2008.14004.x
2008
-
[32]
2010, , 404, 590, 10.1111/j.1365-2966.2010.16269.x
---. 2010, , 404, 590, 10.1111/j.1365-2966.2010.16269.x
2010
-
[33]
Lucy , L. B. 1977, , 82, 1013, 10.1086/112164
1977 doi
-
[34]
2024, WALLABY Pilot Survey: Public data release of 1800 HI sources and high-resolution cut-outs from Pilot Survey Phase 2
Murugeshan, C., Deg, N., Westmeier, T., et al. 2024, WALLABY Pilot Survey: Public data release of 1800 HI sources and high-resolution cut-outs from Pilot Survey Phase 2. 2409.13130
2024 arXiv
-
[35]
2019, Computational Astrophysics and Cosmology, 6, 2, 10.1186/s40668-019-0028-x
Nelson, D., Springel, V., Pillepich, A., et al. 2019, Computational Astrophysics and Cosmology, 6, 2, 10.1186/s40668-019-0028-x
2019 doi
-
[36]
I., et al
O'Beirne , T., Staveley-Smith , L., Wong , O. I., et al. 2024, , 528, 4010, 10.1093/mnras/stae215
2024 doi
-
[37]
Oman , K. A. 2019, MARTINI: Mock spatially resolved spectral line observations of simulated galaxies , Astrophysics Source Code Library, record ascl:1911.005. 1911.005
2019
-
[38]
2024, The Journal of Open Source Software, 9, 6860, 10.21105/joss.06860
---. 2024, The Journal of Open Source Software, 9, 6860, 10.21105/joss.06860
2024 doi
-
[39]
A., Marasco , A., Navarro , J
Oman , K. A., Marasco , A., Navarro , J. F., et al. 2019, , 482, 821, 10.1093/mnras/sty2687
2019 doi
-
[40]
Ploeckinger, S., Nobels, F. S. J., Schaller, M., & Schaye, J. 2023, , 528, 2930, 10.1093/mnras/stad3935
2023 doi
-
[41]
2017, Astronomy and Computing, 19, 45, https://doi.org/10.1016/j.ascom.2017.03.004
Punzo, D., van der Hulst, J., Roerdink, J., Fillion-Robin, J., & Yu, L. 2017, Astronomy and Computing, 19, 45, https://doi.org/10.1016/j.ascom.2017.03.004
2017 doi
-
[42]
N., Westmeier, T., Staveley-Smith, L., Chauhan, G., & Lagos, C
Reynolds, T. N., Westmeier, T., Staveley-Smith, L., Chauhan, G., & Lagos, C. D. P. 2020, , 493, 5089, 10.1093/mnras/staa597
2020 doi
-
[43]
2023, , 518, 4646, 10.1093/mnras/stac3065
Rhee , J., Meyer , M., Popping , A., et al. 2023, , 518, 4646, 10.1093/mnras/stac3065
2023 doi
-
[44]
1995, , 447, 82, 10.1086/175858
Rix , H.-W., & Zaritsky , D. 1995, , 447, 82, 10.1086/175858
1995 doi
-
[45]
2008, The Astronomy and Astrophysics Review, 15, 189, 10.1007/s00159-008-0010-0
Sancisi, R., Fraternali, F., Oosterloo, T., & van der Hulst, T. 2008, The Astronomy and Astrophysics Review, 15, 189, 10.1007/s00159-008-0010-0
2008 doi
-
[46]
2024, RMS asymmetry: a robust metric of galaxy shapes in images with varied depth and resolution
Sazonova, E., Morgan, C., Balogh, M., et al. 2024, RMS asymmetry: a robust metric of galaxy shapes in images with varied depth and resolution. 2404.05792
2024 arXiv
-
[47]
2015, , 448, 1922, 10.1093/mnras/stv079
Serra , P., Westmeier , T., Giese , N., et al. 2015, , 448, 1922, 10.1093/mnras/stv079
2015 doi
-
[48]
D., Bryan, G
Smith, B. D., Bryan, G. L., Glover, S. C. O., et al. 2016, , 466, 2217, 10.1093/mnras/stw3291
2016 doi
-
[49]
D., Bluck, A
Thorp, M. D., Bluck, A. F. L., Ellison, S. L., et al. 2021, , 507, 886, 10.1093/mnras/stab2201
2021 doi
-
[50]
S., Serra, P., et al
Wang, J., Koribalski, B. S., Serra, P., et al. 2016, , 460, 2143, 10.1093/mnras/stw1099
2016 doi
-
[51]
B., Power, C., Catinella, B., Cortese, L., & Stevens, A
Watts, A. B., Power, C., Catinella, B., Cortese, L., & Stevens, A. R. H. 2020, Monthly Notices of the Royal Astronomical Society, 499, 5205, 10.1093/mnras/staa3200
2020 doi
-
[52]
B., Cortese , L., Catinella , B., et al
Watts , A. B., Cortese , L., Catinella , B., et al. 2023, , 519, 1452, 10.1093/mnras/stac3643
2023 doi
-
[53]
2021, , 506, 3962, 10.1093/mnras/stab1881
Westmeier , T., Kitaeff , S., Pallot , D., et al. 2021, , 506, 3962, 10.1093/mnras/stab1881
2021 doi
-
[54]
2022, Publications of the Astronomical Society of Australia, 39, e058, 10.1017/pasa.2022.50
Westmeier, T., Deg, N., Spekkens, K., et al. 2022, Publications of the Astronomical Society of Australia, 39, e058, 10.1017/pasa.2022.50
2022 doi
-
[55]
L., Bottrell, C., et al
Wilkinson, S., Ellison, S. L., Bottrell, C., et al. 2024, , 528, 5558, 10.1093/mnras/stae287
2024 doi
-
[56]
J., Somerville , R
Wright , R. J., Somerville , R. S., Lagos , C. d. P., et al. 2024, , 532, 3417, 10.1093/mnras/stae1688
2024 doi
-
[57]
1997, , 477, 118, 10.1086/303692
Zaritsky , D., & Rix , H.-W. 1997, , 477, 118, 10.1086/303692
1997 doi
Reviewed August 10, 2026 · model on record in the stance chip above.
Discussion (0). Continue with ORCID to comment.