REVIEW 4 major objections 4 minor 120 references
BASS XLV: Quantifying AGN Selection Effects in the Chandra COSMOS-Legacy Survey with BASS
T0 review · 4 major / 4 minor · reviewed 2026-08-10 · deepseek-v4-flash
Pith's one-line read Chandra's deep COSMOS-Legacy survey misses most obscured AGN and mislabels unobscured sources as Compton-thick, so reported obscuration evolution is likely overstated.
desk verdict A careful, transparent forward-model simulation that convincingly shows Chandra-like surveys severely miss obscured AGN and that low-count 2PL fits fabricate CT sources; the headline fractions are conditional on the local BASS prior but the central bias argument holds. read the letter →
The pith
A machine-rendered reading of the paper's core claim, the machinery that carries it, and where it could break.
The reading
What carries the argument
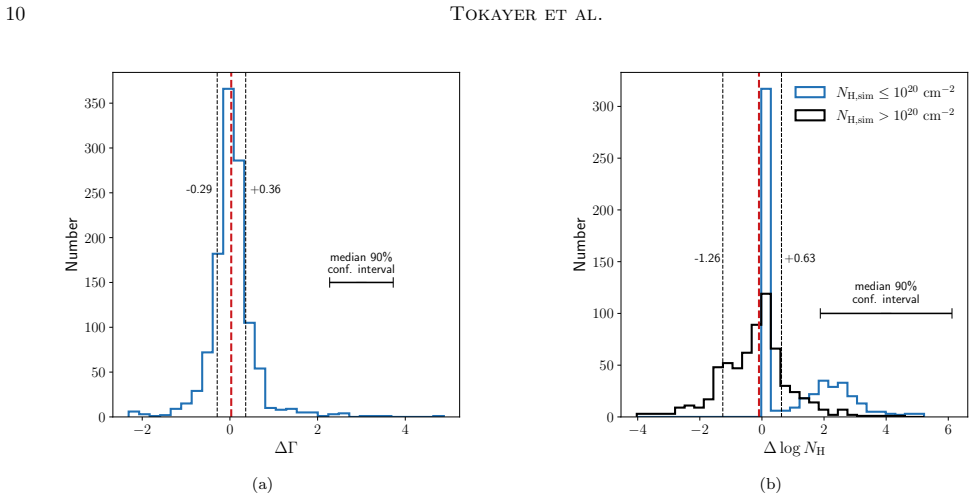
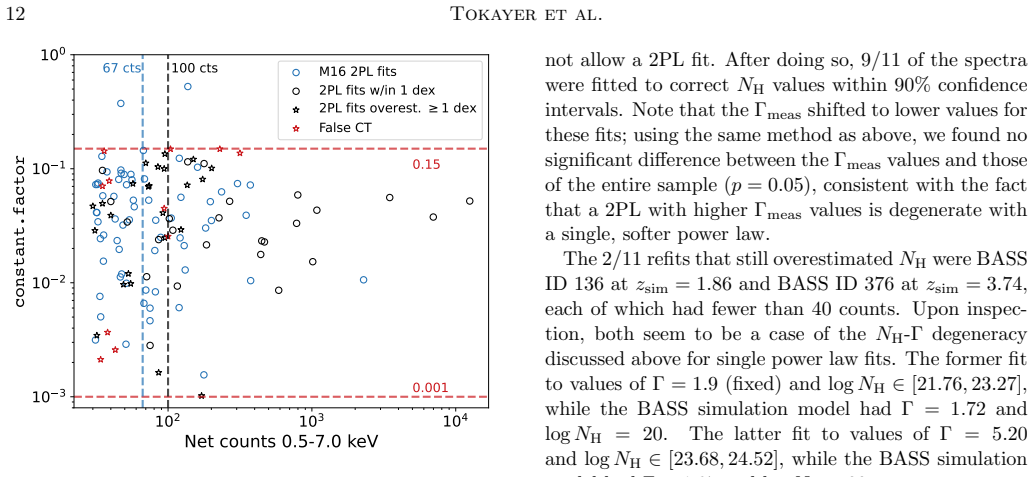
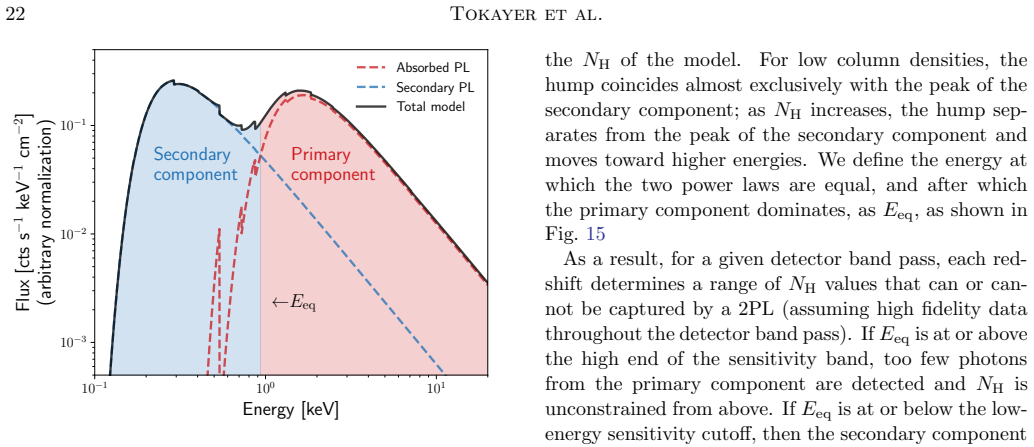
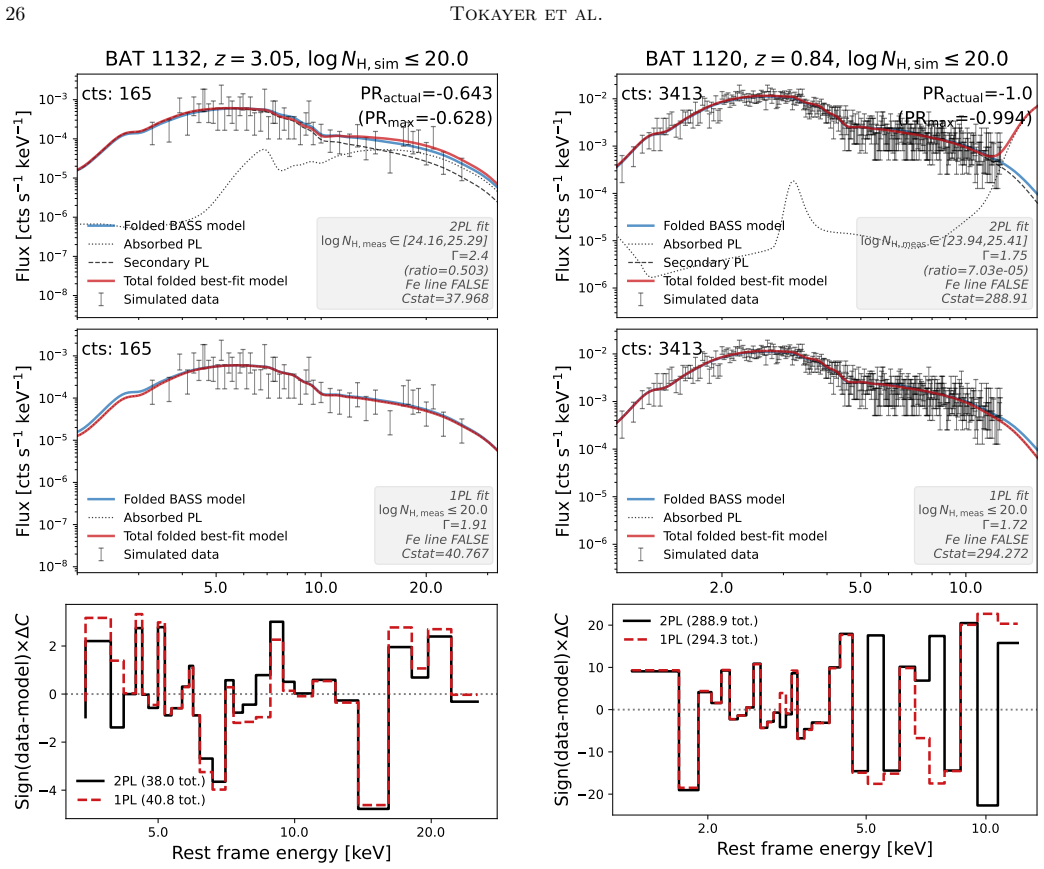
The forward-modeling pipeline and the double power-law degeneracy, quantified by the primary ratio (PR). The machinery is: (1) 380 BASS X-ray spectral templates with known column density, photon index, and iron line, built from spectra with a median of 1545 counts; (2) each template placed at six CCLS-like redshifts and exposure times and passed through Chandra ACIS response files; (3) the four-step phenomenological fitting procedure from Marchesi et al. (2016b), going from an absorbed power law with fixed photon index to a free photon index, a secondary unabsorbed power law, and an iron K$\alpha$ Gaussian; and (4) the PR diagnostic, $\mathrm{PR} = (n_p - n_s)/(n_p + n_s)$, the fraction of detected photons belonging to the primary versus secondary component. When the energy at which the two power laws cross lies outside Chandra's 0.5–7 keV band, the PR shows that the double power law cannot distinguish an unobscured single power law from a heavily obscured source with soft leakage, which is exactly what produces the false Compton-thick classifications. The PR is what makes the bias systematic and predictable rather than a random fitting artifact.
What would settle it
Re-observe the 27 CCLS sources with best-fit $\log N_H \ge 24$ from Marchesi et al. (2016b) with NuSTAR, or stack their Chandra data at their known redshifts: if most show an unobscured soft continuum with no hard-band excess, the false-Compton-thick claim is supported; if most show flat reflected hard spectra with $\log N_H \ge 24$, the central inference fails.
Extended reading notes
Core claim
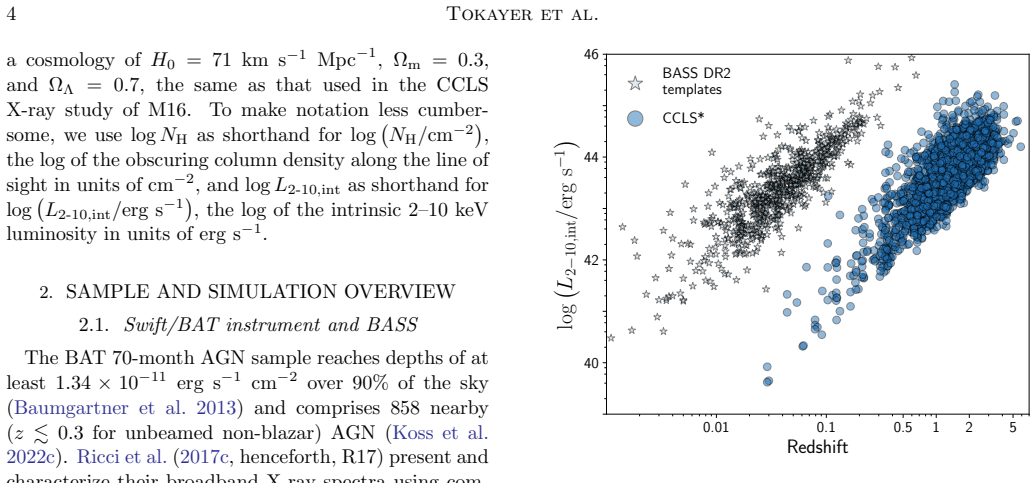
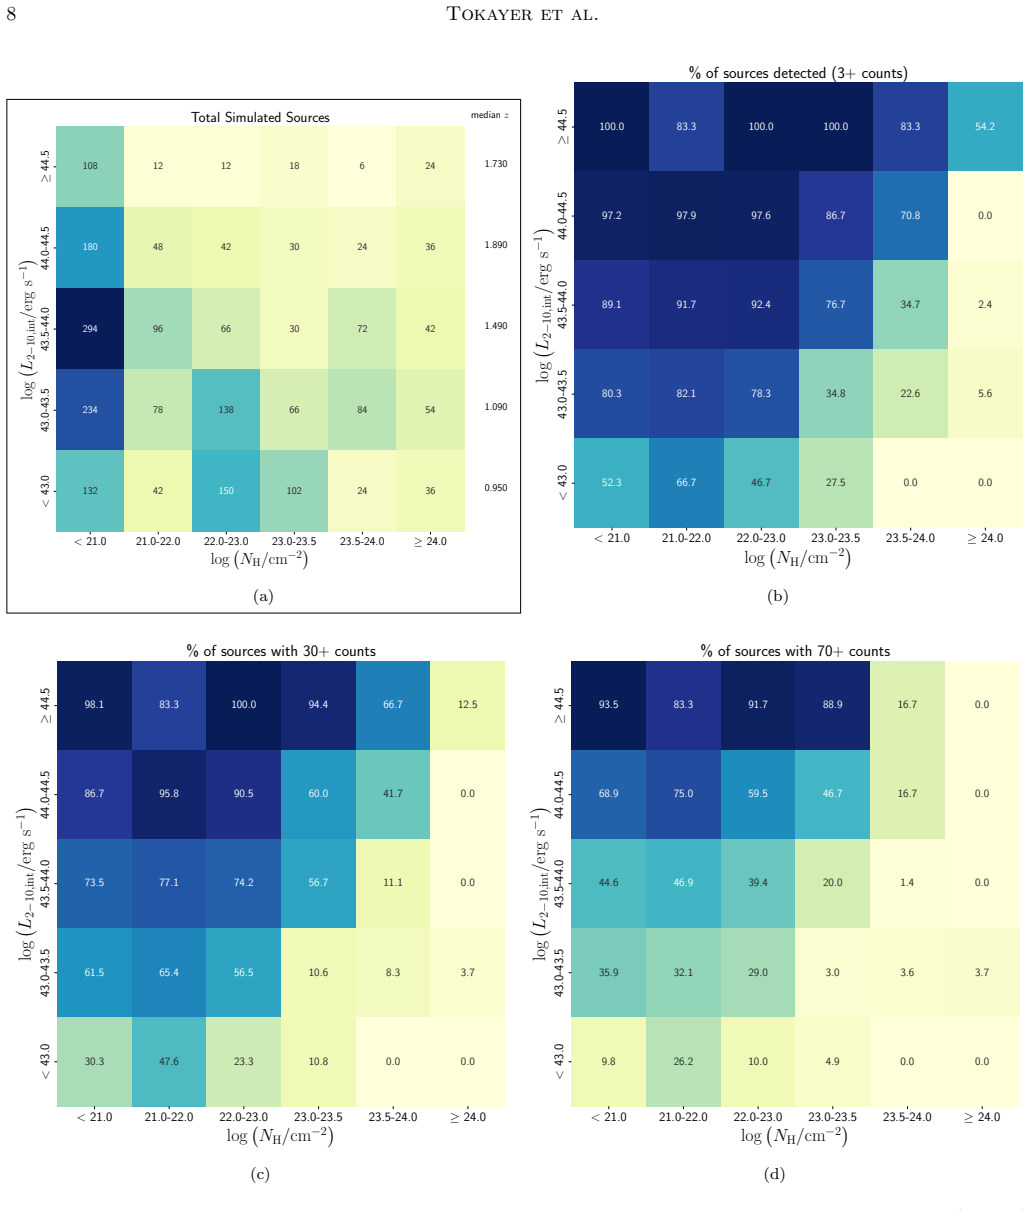
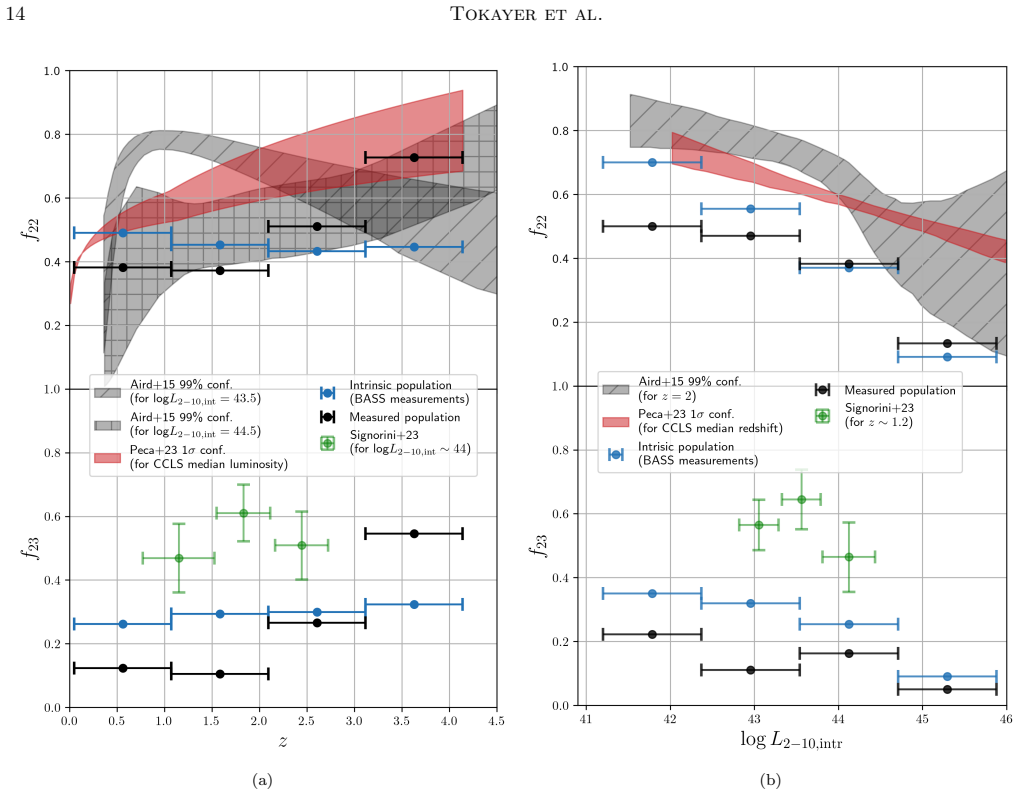
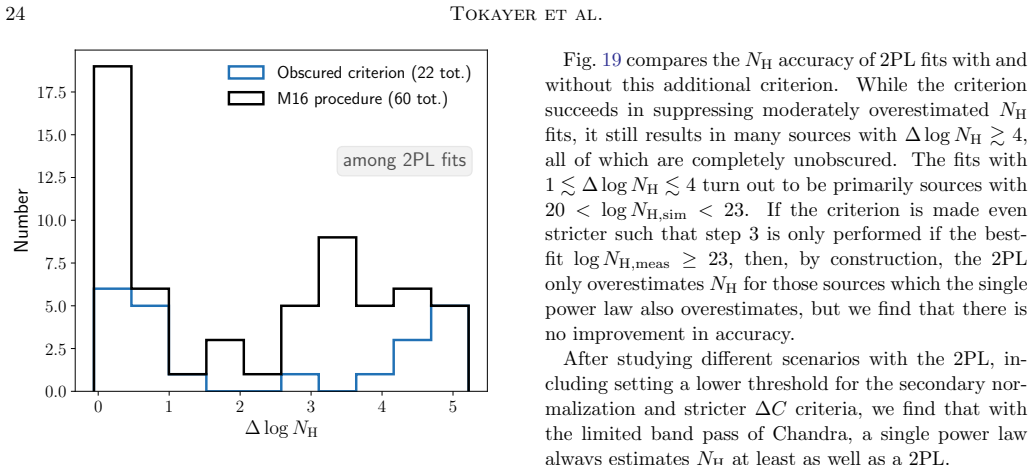
The central claim, stated as the authors would state it: at the depth of the Chandra COSMOS-Legacy Survey, the standard Chandra-based method for measuring AGN obscuration is not merely incomplete but asymmetrically biased. Given the CCLS redshift-luminosity distribution, Chandra would fail to detect 53.3% (563/1056) of obscured simulated BASS AGN ($N_H \ge 10^{22}\ \mathrm{cm}^{-2}$) and 91.1% (175/192) of Compton-thick AGN ($N_H \ge 10^{24}\ \mathrm{cm}^{-2}$). For detected spectra with at least 30 counts, fitting exactly as in Marchesi et al. (2016b) recovers column densities accurately on average (median $\Delta \log N_H = -0.10$ dex) but with a large tail of overestimates; among 27 spectra whose best fit placed them in Compton-thick territory, 18 (66.7%) were simulated from completely unobscured templates ($N_H \le 10^{20}\ \mathrm{cm}^{-2}$). A double power-law model with a scattered secondary component is the culprit: it lets a low-count unobscured spectrum masquerade as a heavily absorbed one. Consequently, the measured obscured fraction increases with redshift and declines with luminosity even when the underlying simulated population is flat or declining, so earlier X-ray surveys likely overstate obscuration evolution.
Load-bearing premise
The intrinsic X-ray spectra of local BASS AGN—continuum slope, reflection hump, soft excess, and iron line—are exactly what high-redshift CCLS AGN look like once redshifted, with no cosmic evolution of spectral shape or of the obscuration–luminosity relation.
Editorial extensions
If this is right
- Any flux-limited Chandra survey at CCLS-like depth will miss more than half of obscured AGN and nearly all Compton-thick AGN at $z \sim 0.5\text{--}3$, so census numbers drawn from such surveys are lower limits.
- Best-fit column densities from the standard phenomenological pipeline are unreliable for individual low-count sources; measured Compton-thick classifications need a physical torus refit, such as MYTorus, before being believed.
- The reported rise of the obscured fraction with redshift and the measured abundance of luminous obscured AGN are inflated; the true evolution is weaker than X-ray fitting alone suggests.
- A single power-law fit estimates $N_H$ at least as well as a double power-law fit for Chandra-quality data, so simpler models are preferable unless the data demand otherwise.
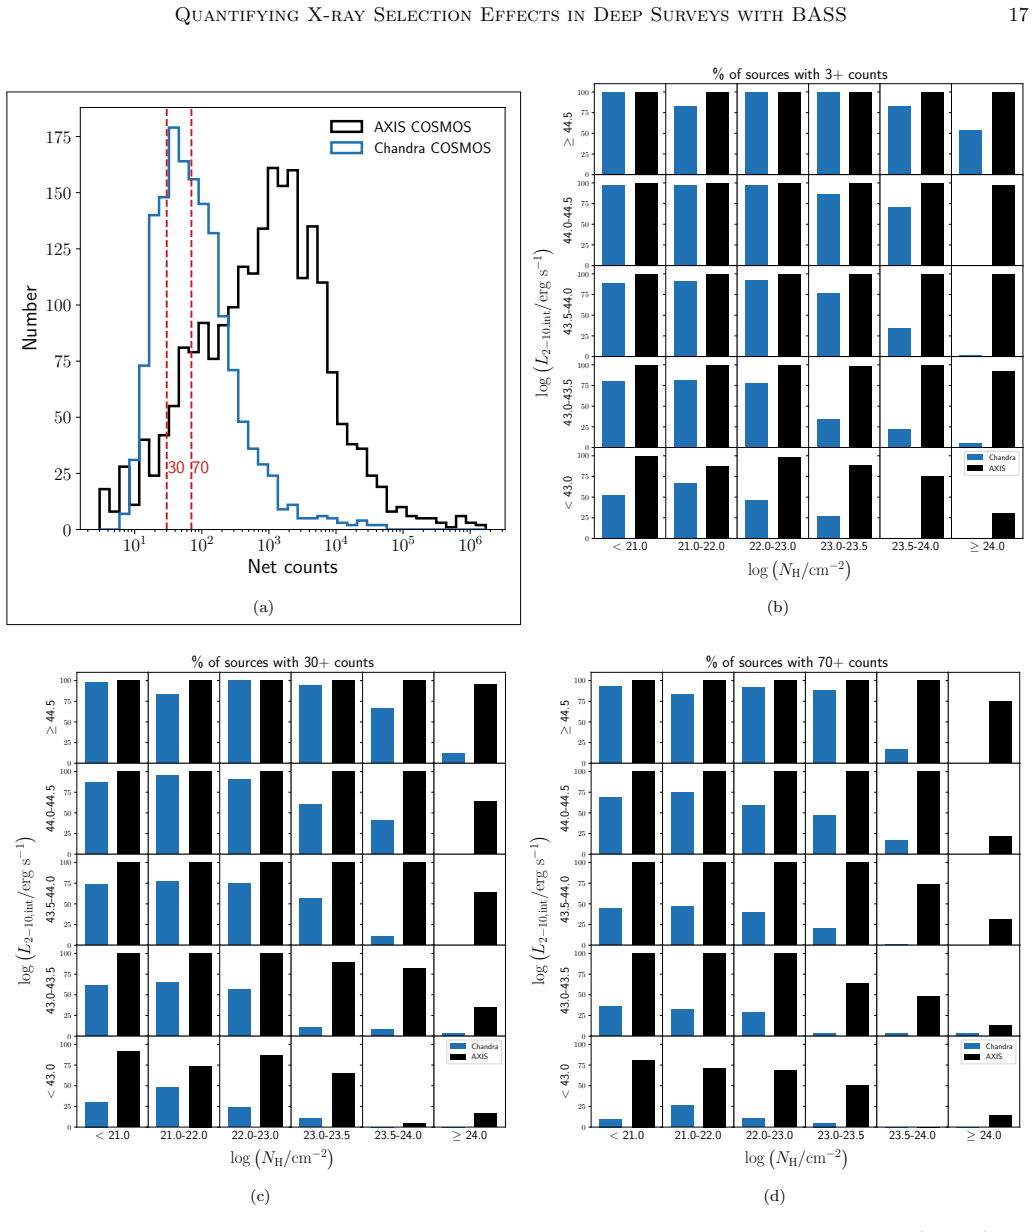
- A next-generation X-ray mission with roughly ten times Chandra's effective area, such as AXIS, would detect 97.5% of the simulated sources and 51.0% of Compton-thick sources at 30 or more counts, making the bias tractable.
Reading between the lines
- If the local-template assumption holds, the same selection function can be inverted to produce a debiased obscured fraction as a function of redshift and luminosity; the paper stops at demonstrating the bias, so constructing that corrected distribution is a natural next step.
- The false Compton-thick mechanism implies that multi-wavelength indicators—mid-infrared colors, X-ray-to-infrared flux ratios, or broad H$\beta$ presence—should be used to down-select X-ray Compton-thick candidates, especially at $z > 1$, rather than trusting X-ray best fits alone.
- The primary-ratio diagnostic could be turned into a survey-design tool: for any future mission bandpass and redshift window, one can precompute the range of $N_H$ values a double power-law fit can actually recover and quote completeness cells instead of point estimates.
- Because the templates are local and no cosmic evolution of X-ray spectra is modeled, if high-redshift AGN have systematically weaker soft excesses or different reflection, the quantitative biases would shift; this sensitivity argues for stacking tests on real CCLS spectra to check the template assumption.
Signed reviews
Editorial analysis
A structured set of objections, weighed in public.
Referee Report
Summary. The paper quantifies how the Chandra COSMOS-Legacy Survey (CCLS) selects against obscured AGN by forward-modeling 380 well-measured local BASS AGN spectral templates, placing them at CCLS redshifts, luminosities, and exposure times, simulating Chandra observations with fakeit, and then fitting the simulated spectra with the same phenomenological pipeline used by Marchesi et al. (2016b). The main quantitative results are that 53.3% (563/1056) of simulated obscured AGN (log N_H >= 22) are undetected, and that among the 27 simulated sources whose best fit implies Compton-thick column densities (log N_H >= 24), 66.7% (18/27) are actually unobscured (log N_H <= 22). The paper also studies photon-index recovery, the role of double power-law fits in producing false CT classifications, refits the false CT sources with MYTorus, and repeats the detection simulation for the proposed AXIS mission. The authors conclude that previous X-ray survey results may have significantly overestimated the growth of the obscured fraction with redshift and the fraction of luminous obscured AGN.
Significance. If the quantitative claims are taken as statements about the CCLS population, the paper is an important, first-of-its-kind large-sample quantification of obscuration bias in a deep Chandra survey, with clear implications for interpreting existing AGN population studies and for designing future missions such as AXIS. The forward-modeling design is a genuine strength: known BASS spectra are passed through a known detector response and a well-defined external fitting pipeline, so the inference is not circular. The paper is also transparent, with simulation catalogs (Tables 4 and 5), appendices testing the fakeit procedure and background assumptions, and concrete AXIS projections. The main limitation is that the simulated intrinsic N_H distribution is deliberately taken from the local BASS parent population rather than from CCLS or from a model of the high-redshift AGN population; all headline percentages are therefore conditional on that prior. This does not invalidate the forward-modeling approach, but it does mean the headline numbers and the redshift-evolution interpretation in Sec. 4.1 are not yet direct statements about the intrinsic CCLS population.
major comments (4)
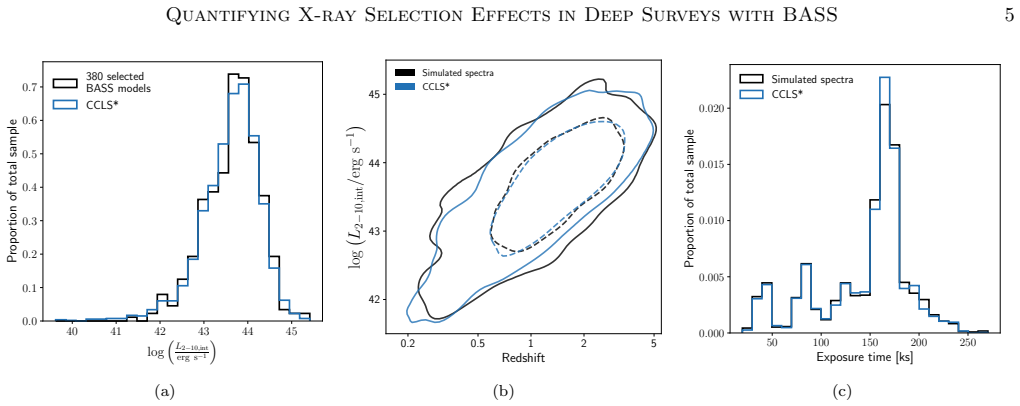
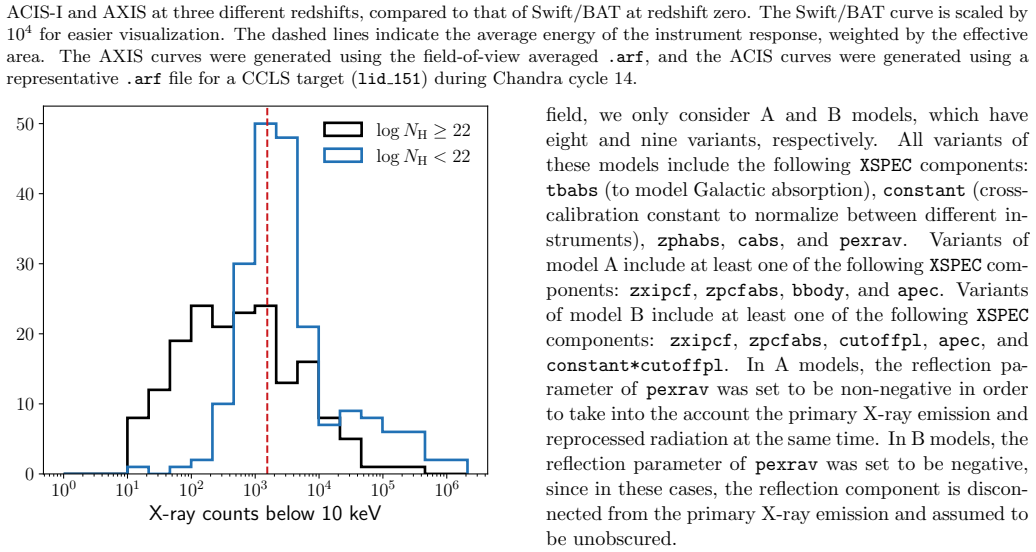
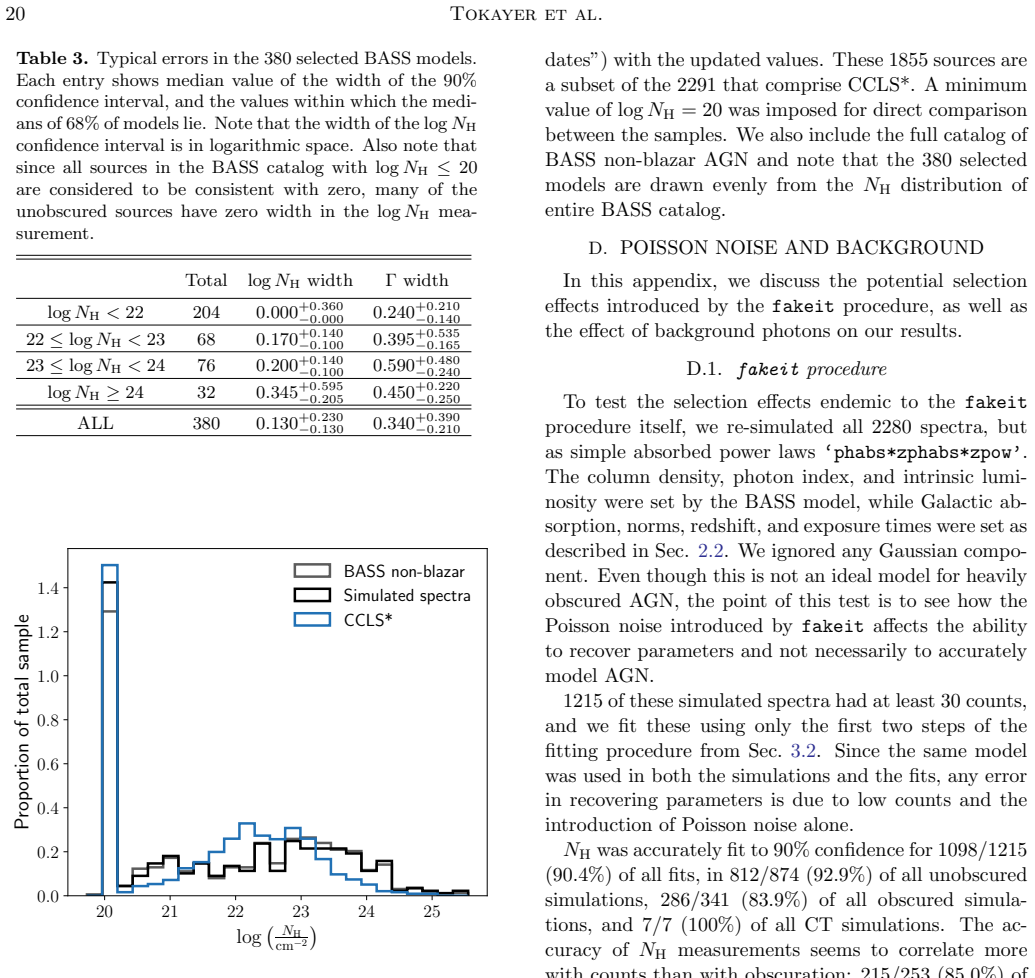
- [Sec. 2.2 and Appendix C] The headline missed-obscured fraction (53.3%; 563/1056) is computed from a simulated population whose intrinsic N_H distribution is the local BASS distribution, not the CCLS distribution. The authors state in Sec. 2.2 that they matched luminosity, redshift, and exposure time but explicitly did not match the CCLS N_H distribution, and Appendix C shows that the simulated N_H distribution differs strongly from CCLS (e.g., 204 of 380 templates have log N_H < 22). Because the detection fraction in Fig. 5 varies steeply with N_H (for example, only 5.6% of sources with log N_H >= 24 are detected at log L = 43.0-43.5, versus 80.3% for log N_H < 21), the 53.3% figure depends directly on the adopted BASS N_H prior. The paper should either state the headline result as conditional on that prior and quantify the sensitivity to alternative intrinsic N_H distributions (e.g., an increasing obscured fraction with redshift), or reweight the simulation to a plausible CCLS-like N_H prior. Without this, the abstract's phrasing that Chandra would fail to detect the majority of obscured sources 'given the observed redshift and luminosity distribution of the CCLS' is incomplete, since the N_H distribution is not observed in the same sense.
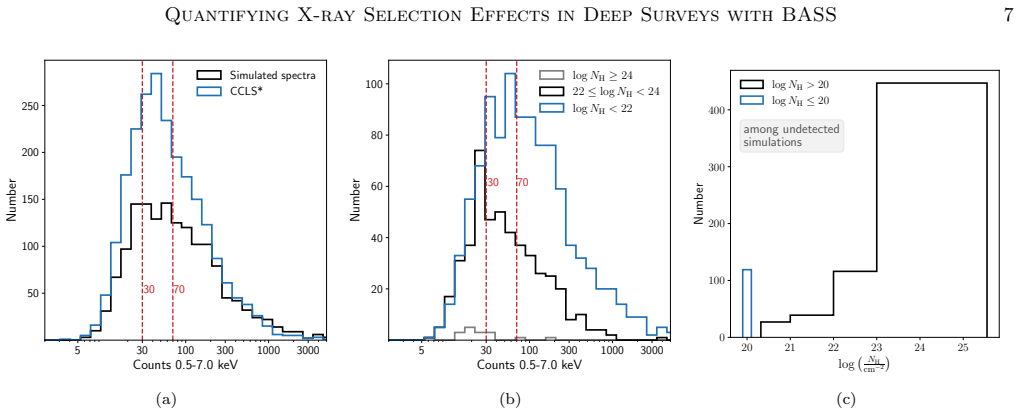
- [Sec. 3.4, Fig. 7, and abstract] The false-CT fraction (66.7%; 18/27) is prior-dominated and based on small numbers. The 27 best-fit CT sources are drawn from a simulation in which more than half of the templates are unobscured (204/380 with log N_H < 22), so the statement that most best-fit CT sources are actually unobscured is a property of the assumed BASS input population, not of CCLS. If the intrinsic high-redshift population has a higher obscured/CT fraction, as argued by X-ray background synthesis models and multiwavelength studies, the false-CT rate would be lower. The paper should report this fraction with an explicit binomial uncertainty (27 sources gives a 95% interval of roughly 46-83% for the 66.7% estimate) and should present the false-CT probability as a function of the assumed intrinsic obscured fraction, or at least prominently state that the number is conditional on the BASS N_H prior and is not a measured CCLS property.
- [Sec. 3.1 and Appendix D] The detection-fraction calculation relies on an incompletely specified 'selection function' correction for sources with fewer than 30 counts. The text says that 'we included a function to randomly reduce the number of sources at the same rate that Chandra would not detect because of background,' but the exact algorithm, the background model, and the matching procedure are not described in the main text, and Appendix D only gives a qualitative discussion (e.g., ~1.4 background counts per aperture, a 3-sigma threshold of ~12 net counts). Since the 67.2% overall detection fraction and thus the 53.3% missed-obscured headline both depend on this correction, the paper should specify the exact correction function, its parameters, and the resulting count-distribution match, and should show how the headline numbers change if the correction is varied or omitted.
- [Sec. 4.1 and Fig. 9] The inference that the observed increase in the obscured fraction with redshift is largely a measurement bias assumes no cosmic evolution of the intrinsic N_H distribution or of AGN spectral shapes. The manuscript acknowledges this in Sec. 4.1 ('does not account for any potential change to the intrinsic population of AGN over cosmic time'), but the discussion nevertheless concludes that 'the trend of increasing obscuration with redshift may be much less significant than previously believed' and that previous studies 'may have significantly overestimated' the redshift growth of the obscured fraction. These statements go beyond what the simulation alone can establish, because the simulated 'true' obscured fraction in Fig. 9 is itself derived from the local BASS N_H-luminosity relation. The paper should either restrict the conclusion to the conditional statement 'if the high-redshift population has the same intrinsic N_H distribution and spectral shapes as local BASS AGN, then the X-ray-measured trends overestimate the intrinsic trends,' or include a quantitative exploration of how the bias changes under simple evolutionary scenarios for the intrinsic N_H distribution.
minor comments (4)
- [Appendices G.3 and G.4] The figure cross-references appear to be swapped: Sec. G.3 ('high secondary normalization') refers to Fig. 23, but Fig. 23 shows a very low secondary normalization (ratio = 7.03e-05), while Sec. G.4 ('low secondary normalization') refers to Fig. 22, which shows ratio = 0.503. The text and figures should be matched.
- [Sec. 3.4 and Sec. 3.5] The paper uses 'unobscured' in two senses: in Sec. 3.4 the 18/27 false-CT sources are described as 'unobscured' with log N_H <= 22, whereas Sec. 3.5 defines false-CT sources as those with log N_H_sim <= 20. These definitions should be reconciled or explicitly distinguished to avoid confusion about which quantity is being reported.
- [Sec. 3.5 and Fig. 8 caption] The sentence 'It is notable that almost all of our fits that settled on a secondary normalization very near the upper limit turned out to be false CT source' is missing a period and should read 'false CT sources'; more generally, the caption would benefit from stating the number of false CT sources shown.
- [Sec. 3.1, footnote 3] The statement that 'the CCLS notes that there is significant incompleteness below 20 counts' should include a specific reference (e.g., Civano et al. 2016, with section or figure) so the reader can verify the incompleteness claim.
Circularity Check
No significant circularity: the paper is a forward-model sensitivity analysis whose headline percentages are conditional statements about simulated BASS AGN, not conclusions assumed in the inputs.
full rationale
The central derivation is a self-contained forward model: known BASS X-ray spectral models are redshifted, passed through Chandra response files, and refit with the M16 pipeline, and recovery is measured against the known simulation inputs. The headline claim that Chandra would miss 53.3% of obscured sources is explicitly conditional on the simulated BASS AGN population placed at CCLS redshifts, luminosities, and exposure times; it is not a claim that the CCLS intrinsic NH distribution has been measured or predicted. The false-CT fraction (66.7%; 18/27) is a posterior over simulation truth under the stated BASS NH prior, and the paper explicitly declines to match the CCLS NH distribution (Appendix C), so the statistic is presented as conditional rather than as an unconditional CCLS property. The paper also openly acknowledges the no-evolution assumption in Sec. 4.1 ('does not account for any potential change to the intrinsic population of AGN over cosmic time'), which is a stated limitation, not a hidden circular reduction. Self-citations to BASS/R17 and Koss et al. (2016) supply external template spectra and the hard-X-ray unbiased-selection rationale; these are independent data and evidence, not conclusions derived from the present paper's own outputs. No equation or fitting step reduces the reported detection or recovery fractions to the inputs by construction.
Assumptions & free parameters
free parameters (3)
- constant.factor upper limit =
0.15
- constant.factor lower limit =
0.001
- Delta C improvement threshold =
2.71
assumptions (4)
- domain assumption Local BASS AGN are representative analogs for high-redshift CCLS AGN at matched intrinsic 2-10 keV luminosity, both in spectral shape and in the intrinsic N_H-luminosity relation.
- domain assumption The X-ray spectral models of R17 (absorbed power law, pexrav reflection, soft excess, Fe line) are correct descriptions of the intrinsic AGN emission.
- domain assumption The Chandra response files and Poisson statistics used in fakeit accurately represent CCLS observations, including the effect of vignetting and off-axis positions.
- domain assumption The CCLS source catalog (M16) and the CCLS* subset with well-constrained luminosities are unbiased samples of the X-ray detected population.
Cite this review
Pith. "Pith review of BASS XLV: Quantifying AGN Selection Effects in the Chandra COSMOS-Legacy Survey with BASS." pith.science (2026). https://pith.science/paper/YWCZXBIJ
@misc{pith2026250116708,
  author       = {Pith},
  title        = {Pith review of: BASS XLV: Quantifying AGN Selection Effects in the Chandra COSMOS-Legacy Survey with BASS},
  year         = {2026},
  howpublished = {\url{https://pith.science/paper/YWCZXBIJ}},
  note         = {Machine review of arXiv:2501.16708}
}
abstract
Deep extragalactic X-ray surveys, such as the Chandra COSMOS-Legacy field (CCLS), are prone to be biased against active galactic nuclei (AGN) with high column densities due to their lower count rates at a given luminosity. To quantify this selection effect, we forward model nearby ($z\sim0.05$) AGN from the BAT AGN Spectroscopic Survey (BASS) with well-characterized ($\gtrsim$1000 cts) broadband X-ray spectra (0.5-195 keV) to simulate the CCLS absorption distribution. We utilize the BASS low-redshift analogs with similar luminosities to the CCLS ($L_\mathrm{2-10\ keV}^\mathrm{int}\sim10^{42-45}\ \mathrm{erg}\ \mathrm{s}^{-1}$), which are much less affected by obscuration and low-count statistics, as the seed for our simulations, and follow the spectral fitting of the CCLS. Our simulations reveal that Chandra would fail to detect the majority (53.3%; 563/1056) of obscured ($N_\mathrm{H}>10^{22}\ \mathrm{cm}^{-2}$) simulated BASS AGN given the observed redshift and luminosity distribution of the CCLS. Even for detected sources with sufficient counts ($\geq30$) for spectral modeling, the level of obscuration is significantly overestimated. This bias is most extreme for objects whose best fit indicates a high-column density AGN ($N_\mathrm{H}\geq10^{24}\ \mathrm{cm}^{-2}$), since the majority (66.7%; 18/27) of these are actually unobscured sources ($N_\mathrm{H}<10^{22}\ \mathrm{cm}^{-2}$). This implies that previous studies may have significantly overestimated the increase in the obscured fraction with redshift and the fraction of luminous obscured AGN. Our findings highlight the importance of directly considering obscuration biases and forward modeling in X-ray surveys, as well as the need for higher-sensitivity X-ray missions such as the Advanced X-ray Imaging Satellite (AXIS), and the importance of multi-wavelength indicators to estimate obscuration in distant supermassive black holes.
Figures

Figures from the paper (17 more)






Reference graph
Works this paper leans on
-
[1]
, " * write output.state after.block = add.period write newline
ENTRY address archivePrefix author booktitle chapter doi edition editor eprint howpublished institution journal key month number organization pages publisher school series title misctitle type volume year version url label extra.label sort.label short.list INTEGERS output.state before.all mid.sentence after.sentence after.block FUNCTION init.state.consts ...
-
[2]
write newline
" write newline "" before.all 'output.state := FUNCTION format.url url empty "" new.block "" url * "" * if FUNCTION format.eprint eprint empty "" archivePrefix empty "" archivePrefix "arXiv" = new.block " " eprint * " " * new.block " " eprint * " " * if if if FUNCTION format.doi doi empty "" " " doi * " " * if FUNCTION format.pid doi empty eprint empty ur...
-
[3]
thebibliography [1] 20pt to REFERENCES 6pt =0pt -12pt 10pt plus 3pt =0pt =0pt =1pt plus 1pt =0pt =0pt -12pt =13pt plus 1pt =20pt =13pt plus 1pt \@M =10000 =-1.0em =0pt =0pt 0pt =0pt =1.0em @enumiv\@empty 10000 10000 `\.\@m \@noitemerr \@latex@warning Empty `thebibliography' environment \@ifnextchar \@reference \@latexerr Missing key on reference command E...
arXiv 2021
-
[4]
Aird, J., Coil, A. L., Georgakakis, A., et al. 2015, Monthly Notices of the Royal Astronomical Society, 451, 1892, 10.1093/mnras/stv1062
-
[5]
2006, Astronomy and Astrophysics, 459, 693, 10.1051/0004-6361:20054632
Akylas, A., Georgantopoulos, I., Georgakakis, A., Kitsionas, S., & Hatziminaoglou, E. 2006, Astronomy and Astrophysics, 459, 693, 10.1051/0004-6361:20054632
-
[6]
Alexander, D. M., Stern, D., Moro, A. D., et al. 2013, ApJ, 773, 125, 10.1088/0004-637X/773/2/125
-
[7]
Ananna, T. T., Treister, E., Urry, C. M., et al. 2019, The Astrophysical Journal, 871, 240, 10.3847/1538-4357/aafb77
-
[8]
Annuar, A., Alexander, D. M., Gandhi, P., et al. 2020, Monthly Notices of the Royal Astronomical Society, 497, 229, 10.1093/mnras/staa1820
Show all 120 references
-
[9]
Arnaud, K. A. 1996, in Astronomical Society of the Pacific Conference Series , Vol. 101, Astronomical Data Analysis Software and Systems V , ed. G. H. Jacoby & J. Barnes, 17
1996
-
[10]
P., Tollerud, E
Astropy Collaboration , Robitaille, T. P., Tollerud, E. J., et al. 2013, aap, 558, A33, 10.1051/0004-6361/201322068
2013 doi
-
[11]
M., Sip Hocz, B
Astropy Collaboration , Price-Whelan , A. M., Sip Hocz, B. M., et al. 2018, aj, 156, 123, 10.3847/1538-3881/aabc4f
2018 doi
-
[12]
A., & Cabral, S
Balokovi \'c , M., Garc \'i a, J. A., & Cabral, S. E. 2019, Research Notes of the American Astronomical Society, 3, 173, 10.3847/2515-5172/ab578e
2019 doi
-
[13]
A., et al
Balokovi \'c , M., Brightman, M., Harrison, F. A., et al. 2018, The Astrophysical Journal, 854, 42, 10.3847/1538-4357/aaa7eb
2018 doi
-
[14]
D., Barbier, L
Barthelmy, S. D., Barbier, L. M., Cummings, J. R., et al. 2005, Space Science Reviews, 120, 143, 10.1007/s11214-005-5096-3
2005 doi
-
[15]
H., Tueller, J., Markwardt, C
Baumgartner, W. H., Tueller, J., Markwardt, C. B., et al. 2013, ApJS, 207, 19, 10.1088/0067-0049/207/2/19
2013 doi
-
[16]
2007, 924, 822, 10.1063/1.2774948
Bianchi, S., & Guainazzi, M. 2007, 924, 822, 10.1063/1.2774948
2007 doi
- [17]
-
[18]
2005, Annual Review of Astronomy and Astrophysics, 43, 827, 10.1146/annurev.astro.43.051804.102213
Brandt, W., & Hasinger, G. 2005, Annual Review of Astronomy and Astrophysics, 43, 827, 10.1146/annurev.astro.43.051804.102213
2005 arXiv
-
[19]
N., & Alexander, D
Brandt, W. N., & Alexander, D. M. 2015, Astron Astrophys Rev, 23, 1, 10.1007/s00159-014-0081-z
2015 doi
-
[20]
N., Laor, A., & Wills, B
Brandt, W. N., Laor, A., & Wills, B. J. 2000, The Astrophysical Journal, 528, 637, 10.1086/308207
2000 doi
-
[21]
N., & Yang, G
Brandt, W. N., & Yang, G. 2022, Surveys of the Cosmic X-Ray Background , 78, 10.1007/978-981-16-4544-0_130-1
2022 doi
-
[22]
2011, Monthly Notices of the Royal Astronomical Society, 413, 1206, 10.1111/j.1365-2966.2011.18207.x
Brightman, M., & Nandra, K. 2011, Monthly Notices of the Royal Astronomical Society, 413, 1206, 10.1111/j.1365-2966.2011.18207.x
2011
-
[23]
2014, Monthly Notices of the Royal Astronomical Society, 443, 1999, 10.1093/mnras/stu1175
Brightman, M., Nandra, K., Salvato, M., et al. 2014, Monthly Notices of the Royal Astronomical Society, 443, 1999, 10.1093/mnras/stu1175
2014 doi
-
[24]
2022, Astronomy and Astrophysics, 661, A1, 10.1051/0004-6361/202141266
Brunner, H., Liu, T., Lamer, G., et al. 2022, Astronomy and Astrophysics, 661, A1, 10.1051/0004-6361/202141266
2022 doi
-
[25]
2015, ApJ, 802, 89, 10.1088/0004-637X/802/2/89
Buchner, J., Georgakakis, A., Nandra, K., et al. 2015, ApJ, 802, 89, 10.1088/0004-637X/802/2/89
2015 doi
-
[26]
2011, The Astrophysical Journal, 728, 58, 10.1088/0004-637X/728/1/58
Burlon, D., Ajello, M., Greiner, J., et al. 2011, The Astrophysical Journal, 728, 58, 10.1088/0004-637X/728/1/58
2011 doi
-
[27]
2020, Astronomy and Astrophysics, 634, A114, 10.1051/0004-6361/201936321
Caglar, T., Burtscher, L., Brandl, B., et al. 2020, Astronomy and Astrophysics, 634, A114, 10.1051/0004-6361/201936321
2020 doi
-
[28]
J., Burtscher, L., et al
Caglar, T., Koss, M. J., Burtscher, L., et al. 2023, The Astrophysical Journal, 956, 60, 10.3847/1538-4357/acf11b
2023 doi
-
[29]
M., Kartaltepe, J
Casey, C. M., Kartaltepe, J. S., Drakos, N. E., et al. 2023, ApJ, 954, 31, 10.3847/1538-4357/acc2bc
2023 doi
-
[30]
1979, The Astrophysical Journal, 228, 939, 10.1086/156922
Cash, W. 1979, The Astrophysical Journal, 228, 939, 10.1086/156922
1979 doi
-
[31]
D., Caccianiga, A., Severgnini, P., et al
Ceca, R. D., Caccianiga, A., Severgnini, P., et al. 2008, A&A, 487, 119, 10.1051/0004-6361:20079319
2008 doi
-
[32]
2016, ApJ, 819, 62, 10.3847/0004-637X/819/1/62
Civano, F., Marchesi, S., Comastri, A., et al. 2016, ApJ, 819, 62, 10.3847/0004-637X/819/1/62
2016 doi
-
[33]
2024, Nat Astron, 1, 10.1038/s41550-024-02416-3
Cruise, M., Guainazzi, M., Aird, J., et al. 2024, Nat Astron, 1, 10.1038/s41550-024-02416-3
2024 doi
-
[34]
2000, AIP Conference Proceedings, 510, 415, 10.1063/1.1303243
Czerny, B., Abrassart, A., Collin-Souffrin , S., & Dumont, A.-M. 2000, AIP Conference Proceedings, 510, 415, 10.1063/1.1303243
2000 doi
-
[35]
S., Koss, M
den Brok , J. S., Koss, M. J., Trakhtenbrot, B., et al. 2022, The Astrophysical Journal Supplement Series, 261, 7, 10.3847/1538-4365/ac5b66
2022 doi
-
[36]
2020, A&A, 636, A73, 10.1051/0004-6361/201936817
Duras, F., Bongiorno, A., Ricci, F., et al. 2020, A&A, 636, A73, 10.1051/0004-6361/201936817
2020 doi
-
[37]
2000, The Astrophysical Journal, 545, 63, 10.1086/317778
Elvis, M. 2000, The Astrophysical Journal, 545, 63, 10.1086/317778
2000 doi
-
[38]
2009, ApJS, 184, 158, 10.1088/0067-0049/184/1/158
Elvis, M., Civano, F., Vignali, C., et al. 2009, ApJS, 184, 158, 10.1088/0067-0049/184/1/158
2009 doi
-
[39]
L., Fiore, F., Comastri, A., et al
Franca, F. L., Fiore, F., Comastri, A., et al. 2005, ApJ, 635, 864, 10.1086/497586
2005 doi
-
[40]
C., Allen, G
Fruscione, A., McDowell, J. C., Allen, G. E., et al. 2006, 6270, 62701V, 10.1117/12.671760
2006 doi
-
[41]
1986, The Astrophysical Journal, 303, 336, 10.1086/164079
Gehrels, N. 1986, The Astrophysical Journal, 303, 336, 10.1086/164079
1986 doi
-
[42]
2001, The Astrophysical Journal, 551, 624, 10.1086/320222
Giacconi, R., Rosati, P., Tozzi, P., et al. 2001, The Astrophysical Journal, 551, 624, 10.1086/320222
2001 doi
-
[43]
2007, Astronomy and Astrophysics, 463, 79, 10.1051/0004-6361:20066334
Gilli, R., Comastri, A., & Hasinger, G. 2007, Astronomy and Astrophysics, 463, 79, 10.1051/0004-6361:20066334
2007 doi
-
[44]
2022, Astronomy and Astrophysics, 666, A17, 10.1051/0004-6361/202243708
Gilli, R., Norman, C., Calura, F., et al. 2022, Astronomy and Astrophysics, 666, A17, 10.1051/0004-6361/202243708
2022 doi
-
[45]
A., Kocevski, D
Grogin, N. A., Kocevski, D. D., Faber, S. M., et al. 2011, ApJS, 197, 35, 10.1088/0067-0049/197/2/35
2011 doi
-
[46]
K., Ricci, C., Tortosa, A., et al
Gupta, K. K., Ricci, C., Tortosa, A., et al. 2021, Monthly Notices of the Royal Astronomical Society, 504, 428, 10.1093/mnras/stab839
2021 doi
-
[47]
A., Craig, W
Harrison, F. A., Craig, W. W., Christensen, F. E., et al. 2013, ApJ, 770, 103, 10.1088/0004-637X/770/2/103
2013 doi
-
[48]
2008, A&A, 490, 905, 10.1051/0004-6361:200809839
Hasinger, G. 2008, A&A, 490, 905, 10.1051/0004-6361:200809839
2008 doi
-
[49]
C., & Alexander, D
Hickox, R. C., & Alexander, D. M. 2018, Annual Review of Astronomy and Astrophysics, 56, 625, 10.1146/annurev-astro-081817-051803
2018 doi
-
[50]
F., Hernquist, L., Cox, T
Hopkins, P. F., Hernquist, L., Cox, T. J., et al. 2006, The Astrophysical Journal Supplement Series, 163, 1, 10.1086/499298
2006 doi
-
[51]
E., Brandt, W
Hornschemeier, A. E., Brandt, W. N., Garmire, G. P., et al. 2000, ApJ, 541, 49, 10.1086/309431
2000 doi
-
[52]
2017, ApJ, 835, 74, 10.3847/1538-4357/835/1/74
Ichikawa, K., Ricci, C., Ueda, Y., et al. 2017, ApJ, 835, 74, 10.3847/1538-4357/835/1/74
2017 doi
-
[53]
Kalberla, P. M. W., Burton, W. B., Hartmann, D., et al. 2005, A&A, 440, 775, 10.1051/0004-6361:20041864
2005 doi
-
[54]
2016, ApJ, 831, 37, 10.3847/0004-637X/831/1/37
Kawamuro, T., Ueda, Y., Tazaki, F., Terashima, Y., & Mushotzky, R. 2016, ApJ, 831, 37, 10.3847/0004-637X/831/1/37
2016 doi
-
[55]
2022, ApJ, 938, 87, 10.3847/1538-4357/ac8794
Kawamuro, T., Ricci, C., Imanishi, M., et al. 2022, ApJ, 938, 87, 10.3847/1538-4357/ac8794
2022 doi
-
[56]
2010, Phys
Khedekar, S., Majumdar, S., & Das, S. 2010, Phys. Rev. D, 82, 041301, 10.1103/PhysRevD.82.041301
2010 doi
-
[57]
2013, ApJL, 765, L26, 10.1088/2041-8205/765/2/L26
Koss, M., Mushotzky, R., Baumgartner, W., et al. 2013, ApJL, 765, L26, 10.1088/2041-8205/765/2/L26
2013 doi
-
[58]
2012, The Astrophysical Journal, 746, L22, 10.1088/2041-8205/746/2/L22
Koss, M., Mushotzky, R., Treister, E., et al. 2012, The Astrophysical Journal, 746, L22, 10.1088/2041-8205/746/2/L22
2012 doi
-
[59]
2010, The Astrophysical Journal, 716, L125, 10.1088/2041-8205/716/2/L125
Koss, M., Mushotzky, R., Veilleux, S., & Winter, L. 2010, The Astrophysical Journal, 716, L125, 10.1088/2041-8205/716/2/L125
2010 doi
-
[60]
2011, ApJ, 739, 57, 10.1088/0004-637X/739/2/57
Koss, M., Mushotzky, R., Veilleux, S., et al. 2011, ApJ, 739, 57, 10.1088/0004-637X/739/2/57
2011 doi
-
[61]
2017, The Astrophysical Journal, 850, 74, 10.3847/1538-4357/aa8ec9
Koss, M., Trakhtenbrot, B., Ricci, C., et al. 2017, The Astrophysical Journal, 850, 74, 10.3847/1538-4357/aa8ec9
2017 doi
-
[62]
J., Romero-Ca \ n izales , C., Baronchelli, L., et al
Koss, M. J., Romero-Ca \ n izales , C., Baronchelli, L., et al. 2015, The Astrophysical Journal, 807, 149, 10.1088/0004-637X/807/2/149
2015 doi
-
[63]
J., Assef, R., Balokovi \'c , M., et al
Koss, M. J., Assef, R., Balokovi \'c , M., et al. 2016, ApJ, 825, 85, 10.3847/0004-637X/825/2/85
2016 doi
-
[64]
J., Blecha, L., Bernhard, P., et al
Koss, M. J., Blecha, L., Bernhard, P., et al. 2018, Nature, 563, 214, 10.1038/s41586-018-0652-7
2018 doi
-
[65]
J., Strittmatter, B., Lamperti, I., et al
Koss, M. J., Strittmatter, B., Lamperti, I., et al. 2021, The Astrophysical Journal Supplement Series, 252, 29, 10.3847/1538-4365/abcbfe
2021 doi
-
[66]
J., Trakhtenbrot, B., Ricci, C., et al
Koss, M. J., Trakhtenbrot, B., Ricci, C., et al. 2022 a , The Astrophysical Journal Supplement Series, 261, 1, 10.3847/1538-4365/ac6c8f
2022 doi
-
[67]
2022 b , ApJS, 261, 6, 10.3847/1538-4365/ac650b
---. 2022 b , ApJS, 261, 6, 10.3847/1538-4365/ac650b
2022 doi
-
[68]
J., Ricci, C., Trakhtenbrot, B., et al
Koss, M. J., Ricci, C., Trakhtenbrot, B., et al. 2022 c , ApJS, 261, 2, 10.3847/1538-4365/ac6c05
2022 doi
-
[69]
M., et al
LaMassa, S., Peca, A., Urry, C. M., et al. 2024, The Astrophysical Journal, 974, 235, 10.3847/1538-4357/ad6e7d
2024 doi
-
[70]
M., Urry, C
LaMassa, S. M., Urry, C. M., Glikman, E., et al. 2013 a , Monthly Notices of the Royal Astronomical Society, 432, 1351, 10.1093/mnras/stt553
2013 doi
-
[71]
M., Urry, C
LaMassa, S. M., Urry, C. M., Cappelluti, N., et al. 2013 b , Monthly Notices of the Royal Astronomical Society, 436, 3581, 10.1093/mnras/stt1837
2013 doi
-
[72]
B., Alexander, D
Lansbury, G. B., Alexander, D. M., Aird, J., et al. 2017, ApJ, 846, 20, 10.3847/1538-4357/aa8176
2017 doi
-
[73]
2018, Monthly Notices of the Royal Astronomical Society, 480, 2578, 10.1093/mnras/sty2025
Lanzuisi, G., Civano, F., Marchesi, S., et al. 2018, Monthly Notices of the Royal Astronomical Society, 480, 2578, 10.1093/mnras/sty2025
2018 doi
-
[74]
2017, ApJS, 232, 8, 10.3847/1538-4365/aa7847
Liu, T., Tozzi, P., Wang, J.-X., et al. 2017, ApJS, 232, 8, 10.3847/1538-4365/aa7847
2017 doi
-
[75]
2022, Astronomy and Astrophysics, 661, A5, 10.1051/0004-6361/202141643
Liu, T., Buchner, J., Nandra, K., et al. 2022, Astronomy and Astrophysics, 661, A5, 10.1051/0004-6361/202141643
2022 doi
-
[76]
2016, Monthly Notices of the Royal Astronomical Society, 459, 1602, 10.1093/mnras/stw753
Liu, Z., Merloni, A., Georgakakis, A., et al. 2016, Monthly Notices of the Royal Astronomical Society, 459, 1602, 10.1093/mnras/stw753
2016 doi
-
[77]
2014, Annual Review of Astronomy and Astrophysics, 52, 415, 10.1146/annurev-astro-081811-125615
Madau, P., & Dickinson, M. 2014, Annual Review of Astronomy and Astrophysics, 52, 415, 10.1146/annurev-astro-081811-125615
2014 doi
-
[78]
K., Garc \'i a, J
Madsen, K. K., Garc \'i a, J. A., Stern, D., et al. 2024, Front. Astron. Space Sci., 11, 10.3389/fspas.2024.1357834
2024
-
[79]
2018, The Astrophysical Journal, 854, 49, 10.3847/1538-4357/aaa410
Marchesi, S., Ajello, M., Marcotulli, L., et al. 2018, The Astrophysical Journal, 854, 49, 10.3847/1538-4357/aaa410
2018 doi
-
[80]
2016 a , The Astrophysical Journal, 817, 34, 10.3847/0004-637X/817/1/34
Marchesi, S., Civano, F., Elvis, M., et al. 2016 a , The Astrophysical Journal, 817, 34, 10.3847/0004-637X/817/1/34
2016 doi
-
[81]
2016 b , The Astrophysical Journal, 830, 100, 10.3847/0004-637X/830/2/100
Marchesi, S., Lanzuisi, G., Civano, F., et al. 2016 b , The Astrophysical Journal, 830, 100, 10.3847/0004-637X/830/2/100
2016 doi
-
[82]
2020, A&A, 642, A184, 10.1051/0004-6361/202038622
Marchesi, S., Gilli, R., Lanzuisi, G., et al. 2020, A&A, 642, A184, 10.1051/0004-6361/202038622
2020 doi
-
[83]
P., Brammer, G., et al
Matthee, J., Naidu, R. P., Brammer, G., et al. 2024, ApJ, 963, 129, 10.3847/1538-4357/ad2345
2024 doi
-
[84]
2023, Monthly Notices of the Royal Astronomical Society, 526, 5072, 10.1093/mnras/stad2974
McKaig, J., Ricci, C., Paltani, S., et al. 2023, Monthly Notices of the Royal Astronomical Society, 526, 5072, 10.1093/mnras/stad2974
2023 doi
-
[85]
E., Trakhtenbrot, B., Koss, M
Mej \'i a-Restrepo , J. E., Trakhtenbrot, B., Koss, M. J., et al. 2022, ApJS, 261, 5, 10.3847/1538-4365/ac6602
2022 doi
-
[86]
L., Merloni, A., Georgakakis, A., et al
Menzel, M. L., Merloni, A., Georgakakis, A., et al. 2016, Monthly Notices of the Royal Astronomical Society, 457, 110, 10.1093/mnras/stv2749
2016 doi
-
[87]
1983, The Astrophysical Journal, 270, 119, 10.1086/161102
Morrison, R., & McCammon, D. 1983, The Astrophysical Journal, 270, 119, 10.1086/161102
1983 doi
-
[88]
D., & Yaqoob, T
Murphy, K. D., & Yaqoob, T. 2009, Monthly Notices of the Royal Astronomical Society, 397, 1549, 10.1111/j.1365-2966.2009.15025.x
2009
-
[89]
2013, The Hot and Energetic Universe : A White Paper Presenting the Science Theme Motivating the Athena + Mission, 10.48550/arXiv.1306.2307
Nandra, K., Barret, D., Barcons, X., et al. 2013, The Hot and Energetic Universe : A White Paper Presenting the Science Theme Motivating the Athena + Mission, 10.48550/arXiv.1306.2307
- [90]
-
[91]
B., et al
Oh, K., Koss, M., Markwardt, C. B., et al. 2018, The Astrophysical Journal Supplement Series, 235, 4, 10.3847/1538-4365/aaa7fd
2018 doi
-
[92]
J., Ueda, Y., et al
Oh, K., Koss, M. J., Ueda, Y., et al. 2022, ApJS, 261, 4, 10.3847/1538-4365/ac5b68
2022 doi
-
[93]
2024, Universe, 10, 245, 10.3390/universe10060245
Peca, A., Cappelluti, N., Marchesi, S., Hodges-Kluck , E., & Foord, A. 2024, Universe, 10, 245, 10.3390/universe10060245
2024 doi
-
[94]
2021, The Astrophysical Journal, 906, 90, 10.3847/1538-4357/abc9c7
Peca, A., Vignali, C., Gilli, R., et al. 2021, The Astrophysical Journal, 906, 90, 10.3847/1538-4357/abc9c7
2021 doi
-
[95]
M., et al
Peca, A., Cappelluti, N., Urry, C. M., et al. 2023, The Astrophysical Journal, 943, 162, 10.3847/1538-4357/acac28
2023 doi
-
[96]
W., Ricci, C., Boorman, P
Pfeifle, R. W., Ricci, C., Boorman, P. G., et al. 2022, ApJS, 261, 3, 10.3847/1538-4365/ac5b65
2022 doi
-
[97]
2021, Astronomy and Astrophysics, 647, A1, 10.1051/0004-6361/202039313
Predehl, P., Andritschke, R., Arefiev, V., et al. 2021, Astronomy and Astrophysics, 647, A1, 10.1051/0004-6361/202039313
2021 doi
- [98]
-
[99]
S., Kara, E
Reynolds, C. S., Kara, E. A., Mushotzky, R. F., et al. 2023, 12678, 126781E, 10.1117/12.2677468
2023 doi
-
[100]
J., et al
Ricci, C., Ueda, Y., Koss, M. J., et al. 2015, ApJ, 815, L13, 10.1088/2041-8205/815/1/L13
2015 doi
-
[101]
J., et al
Ricci, C., Trakhtenbrot, B., Koss, M. J., et al. 2017 a , Nature, 549, 488, 10.1038/nature23906
2017 doi
-
[102]
E., Treister, E., et al
Ricci, C., Bauer, F. E., Treister, E., et al. 2017 b , Monthly Notices of the Royal Astronomical Society, 468, 1273, 10.1093/mnras/stx173
2017 doi
-
[103]
J., et al
Ricci, C., Trakhtenbrot, B., Koss, M. J., et al. 2017 c , ApJS, 233, 17, 10.3847/1538-4365/aa96ad
2017 doi
-
[104]
C., Pfeifle, R
Ricci, C., Privon, G. C., Pfeifle, R. W., et al. 2021, Monthly Notices of the Royal Astronomical Society, 506, 5935, 10.1093/mnras/stab2052
2021 doi
-
[105]
T., Temple, M
Ricci, C., Ananna, T. T., Temple, M. J., et al. 2022, ApJ, 938, 67, 10.3847/1538-4357/ac8e67
2022 doi
-
[106]
2023 a , The Astrophysical Journal, 959, 27, 10.3847/1538-4357/ad0733
Ricci, C., Ichikawa, K., Stalevski, M., et al. 2023 a , The Astrophysical Journal, 959, 27, 10.3847/1538-4357/ad0733
2023 doi
-
[107]
2023 b , ApJL, 952, L28, 10.3847/2041-8213/acda27
Ricci, C., Chang, C.-S., Kawamuro, T., et al. 2023 b , ApJL, 952, L28, 10.3847/2041-8213/acda27
2023 doi
-
[108]
2007, ApJS, 172, 1, 10.1086/516585
Scoville, N., Aussel, H., Brusa, M., et al. 2007, ApJS, 172, 1, 10.1086/516585
2007 doi
-
[109]
2023, Astronomy and Astrophysics, 676, A49, 10.1051/0004-6361/202346364
Signorini, M., Marchesi, S., Gilli, R., et al. 2023, Astronomy and Astrophysics, 676, A49, 10.1051/0004-6361/202346364
2023 doi
-
[110]
T., & Bauer, F
Simmonds, C., Buchner, J., Salvato, M., Hsu, L. T., & Bauer, F. E. 2018, Astronomy and Astrophysics, 618, A66, 10.1051/0004-6361/201833412
2018 doi
-
[111]
L., Mushotzky, R
Smith, K. L., Mushotzky, R. F., Koss, M., et al. 2020, Monthly Notices of the Royal Astronomical Society, 492, 4216, 10.1093/mnras/stz3608
2020 doi
-
[112]
2022, The Astrophysical Journal Supplement Series, 260, 30, 10.3847/1538-4365/ac5f59
Tanimoto, A., Ueda, Y., Odaka, H., Yamada, S., & Ricci, C. 2022, The Astrophysical Journal Supplement Series, 260, 30, 10.3847/1538-4365/ac5f59
2022 doi
-
[113]
2006, Astronomy and Astrophysics, Volume 451, Issue 2, May IV 2006, pp.457-474, 451, 457, 10.1051/0004-6361:20042592
Tozzi, P., Gilli, R., Mainieri, V., et al. 2006, Astronomy and Astrophysics, Volume 451, Issue 2, May IV 2006, pp.457-474, 451, 457, 10.1051/0004-6361:20042592
2006 doi
-
[114]
Treister, E., & Urry, C. M. 2006, The Astrophysical Journal, 652, L79, 10.1086/510237
2006 doi
-
[115]
M., & Virani, S
Treister, E., Urry, C. M., & Virani, S. 2009, The Astrophysical Journal, 696, 110, 10.1088/0004-637X/696/1/110
2009 doi
-
[116]
Ueda, Y., Akiyama, M., Hasinger, G., Miyaji, T., & Watson, M. G. 2014, The Astrophysical Journal, 786, 104, 10.1088/0004-637X/786/2/104
2014 doi
-
[117]
2007, The Astrophysical Journal, 664, L79, 10.1086/520576
Ueda, Y., Eguchi, S., Terashima, Y., et al. 2007, The Astrophysical Journal, 664, L79, 10.1086/520576
2007 doi
- [118]
-
[119]
S., & Colbert, E
Wilson, A. S., & Colbert, E. J. M. 1995, The Astrophysical Journal, 438, 62, 10.1086/175054
1995 doi
-
[120]
1997, The Astrophysical Journal, 479, 184, 10.1086/303843
Yaqoob, T. 1997, The Astrophysical Journal, 479, 184, 10.1086/303843
1997 doi
Reviewed August 10, 2026 · model on record in the stance chip above.
Discussion (0). Continue with ORCID to comment.