REVIEW 3 major objections 6 minor 29 references
Experimental Study of AM and PM Noise in Cascaded Amplifiers
T0 review · 3 major / 6 minor · reviewed 2026-08-10 · deepseek-v4-flash
Pith's one-line read For a fixed output power, adding amplifier stages can lower the effective noise figure.
desk verdict Solid experimental study with a useful NF design rule, but the coherence-peak story needs a clear statement about per-power quadrature calibration before I'd trust it. read the letter →
The pith
A machine-rendered reading of the paper's core claim, the machinery that carries it, and where it could break.
The reading
What carries the argument
The argument is carried by the I-Q receiver measurement setup, which simultaneously demodulates AM and PM noise and computes the coherence function, the normalized cross-power spectral density between the two noise channels, ranging from zero for uncorrelated to one for fully correlated. The cascade analysis rests on a simple noise-accounting rule: each stage amplifies the AM and PM modulation noise arriving from earlier stages and adds its own noise, so when the output power is held fixed the last stage's added noise is identical and the earlier stages' contributions are weighted down by the gain that follows. For the correlation result, the key object is the measured AM-to-PM derivative, whose peaking near the 1 dB compression point tracks the peaking of the coherence function.
What would settle it
Measure the effective NF of one-, two-, three-, and four-stage chains while keeping the final stage's output power fixed but changing only the gain placed before it, for example by inserting a calibrated attenuator between stages; if the final stage's noise contribution changes with the number or gain of preceding stages, the cascade argument fails.
Extended reading notes
Core claim
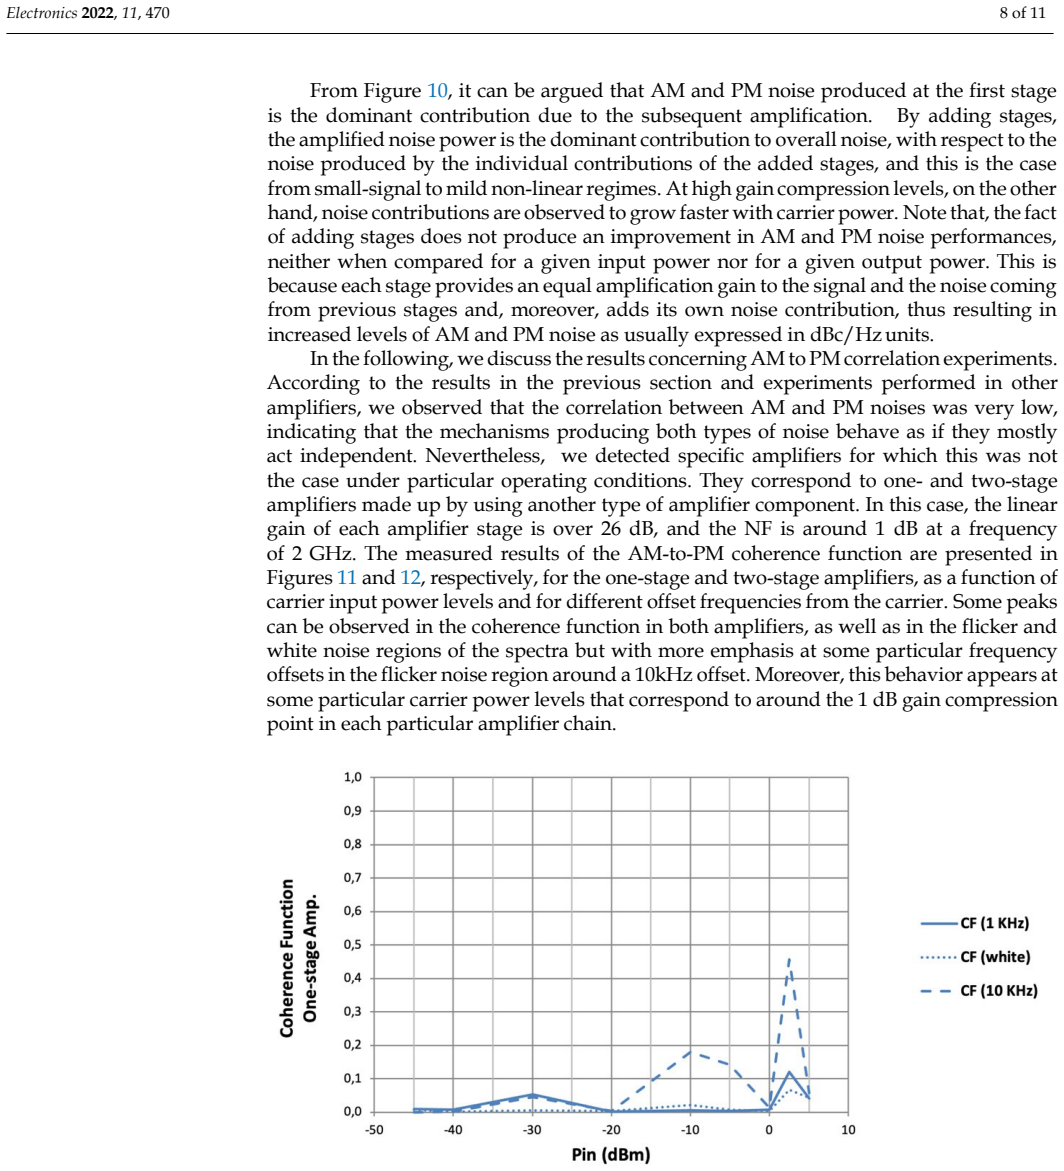
The authors claim that, for a cascade of identical amplifier stages, the effective noise figure at a given carrier output power is improved by increasing the number of stages. Their reasoning is that at equal output power the final stage adds the same noise regardless of how many stages precede it, while the noise added by earlier stages is reduced by the gain of the stages after them and is generated at lower drive levels. Measured effective noise figures from AM and PM white noise in one- to four-stage amplifiers support this: at low input power the cascade follows the standard noise-figure behavior, and under compression the effective NF rises for all chains, but the absolute degradation is larger for the chains with fewer stages. A separate finding is that AM-to-PM coherence is generally low, yet some amplifier configurations show clear correlation peaks close to the 1 dB gain compression point, in both flicker and white noise regions, and the same peaking appears in the derivative of the AM-to-PM characteristic, linking the underlying noise-conversion mechanisms to the device's large-signal AM-PM response.
Load-bearing premise
The conclusion that more stages improve effective noise figure at a fixed output power assumes that each identical stage adds a noise power depending only on its own output power, so the final stage contributes the same noise whether it is preceded by one stage or by three.
Editorial extensions
If this is right
- For a fixed carrier output power, a cascade with more identical stages can exhibit a lower effective NF than a shorter chain, even though the same chain has worse AM/PM noise figures when compared at the same input power.
- Adding stages moves the onset of gain compression to lower input power levels, so input-referred AM/PM noise performance degrades faster with drive as the stage count grows.
- Under small-signal conditions the effective NF is nearly independent of the number of stages, and slightly worse with more stages, consistent with the standard cascade noise-figure formula.
- AM and PM noise in the tested amplifiers are mostly independent, so an amplifier's AM noise performance cannot be inferred from its PM noise performance; both must be measured.
- In some devices, operating near the 1 dB compression point can create significant AM-to-PM correlation at specific offset frequencies, meaning noise at those offsets should not be treated as two independent channels.
Reading between the lines
- A testable design extension: if the cascade result generalizes to other transistor technologies, system designers could deliberately lower the drive level of early stages and add gain later to reduce effective NF at a fixed output power, accepting extra stages and DC consumption.
- The coincidence of coherence peaks with AM-to-PM derivative peaks suggests that a static AM-PM measurement could serve as a screening test for operating points where AM and PM noise become correlated, before full noise measurements are made.
- The load-bearing assumption that a stage's added noise depends only on its own output power is unlikely to hold in strong compression, where noise conversion becomes input-dependent; the reported NF improvement may vanish or reverse in that regime.
- Because cyclostationary noise theory allows AM-PM correlation to grow under strong periodic drive, the observed near-compression peaks are consistent with that picture, but the device-dependence of the peaks points to a role for specific bias and matching conditions.
Editorial analysis
A structured set of objections, weighed in public.
Referee Report
Summary. The manuscript reports an experimental study of AM and PM noise in cascaded amplifier chains built from one to four identical stages, measured at 2 GHz from small-signal to strong compression. Using an I-Q receiver with simultaneous AM and PM detection, the authors determine flicker and white noise contributions, compute an 'effective noise figure' from the white AM and PM noise spectra, and measure the AM-to-PM coherence function. The main reported findings are (i) that effective noise figure degrades with input power but, for a fixed output power, improves as the number of stages increases, and (ii) that AM-PM coherence is generally low but shows peaks near the 1 dB compression point in a second amplifier family, coinciding with peaking in the measured AM-PM derivative. The paper includes measured spectra, coherence plots, and effective NF curves, with comparisons across one to four stages.
Significance. If valid, the result that adding stages can improve effective noise figure at a fixed output power is of practical interest for amplifier chain design, and the observed coherence peaks near compression are relevant for nonlinear noise modeling. The paper's strengths are its simultaneous AM/PM measurement capability, the use of a previously published calibration procedure [17] giving a 0.15 dB uncertainty claim, and the lack of any fitted parameters in the reported trends. The experimental data are presented clearly and the main trends are internally consistent. However, the two central claims (effective NF comparison and coherence peaks) rely on the I-Q receiver actually separating AM and PM noise, and the manuscript does not document that the quadrature condition is maintained as the DUT's AM-PM phase shift varies with power. This unresolved calibration issue is the key correctness risk and prevents acceptance in the present form.
major comments (3)
- [Section 2 (Measurement Setup) and Figures 11–13] The paper does not state that the 90° phase condition between the DUT path and the LO path is re-optimized at every carrier input power. The text only says the phase shifter 'must be adjusted to obtain proper settings' and refers to [17] for the calibration procedure. Since Figure 13 shows that the AM-PM derivative (and hence the DUT insertion phase versus power) peaks near the 1 dB compression point, a fixed phase-shifter setting would produce a quadrature error that grows with power in exactly that region. This would cause AM noise to leak into the PM channel and PM noise into the AM channel, artificially raising the coherence function near compression and biasing the white-noise levels used to compute effective NF. The authors need to either document that the quadrature is re-optimized at each power step or provide a quantitative error budget for quadrature misalignment in the nonlinear regime; without one, the coherence peaks in Figures 11 and 12 and the effective NF comparison in Figures 8 and 9 are not fully trustworthy.
- [Section 4 (Discussion), argument on last-stage noise contribution] The sentence 'achieving an identical output power implies that the noise power contribution of the last stage is identical for all of the amplifiers, independent of their number of stages' assumes that each stage's added noise depends only on its own output power and is independent of the noise content of its input or the compression state of preceding stages. This assumption is not tested or justified in the paper. While the reported NF improvement is an experimental observation, this argument is used to explain it, and a failure of the assumption could alter the interpretation. The authors should either provide a direct test (for example, comparing the output noise of a single stage driven at the same output power as the final stage of a chain) or explicitly state this as a limitation.
- [Figures 11–13 and Section 3] The coherence peaks are reported for a second amplifier family ('another type of amplifier component') with only the linear gain and noise figure stated (over 26 dB and around 1 dB at 2 GHz). No details of the device technology, bias, or matching conditions are given, even though the paper's own introduction notes that AM and PM noise levels depend on bias and matching conditions. Without this information, the claim that these peaks occur in 'some particular amplifier configurations' is not reproducible, and the reader cannot assess whether the effect is specific to the device or an artifact of the measurement conditions.
minor comments (6)
- [Abstract and Section 3] The abstract states the effective noise figure 'decreases with the number of stages for a given carrier output power level,' but the results in Section 3 (Figure 9) are phrased as 'significantly improved by adding some amplification stages, except under small-signal conditions for which it remains essentially constant or, more precisely, slightly worse.' Please harmonize the wording so the small-signal caveat is reflected in the abstract or in the conclusion.
- [Section 2] There is a typo: 'allowing for the simultaneously measuring of AM and PM noise' should read 'allowing the simultaneous measurement of AM and PM noise.'
- [Section 2] The sentence 'The desired phase difference can be obtained simply by tuning the phase shifter' is misleading: the phase shifter may introduce loss and its own noise, and the word 'simply' understates the need for the calibration procedure of [17]. Consider rewording.
- [Figures 8 and 9] No error bars are shown on the effective NF data. Since the paper cites a 0.15 dB uncertainty from the calibration procedure, it would be helpful to include error bars or a statement that the uncertainties are smaller than the symbol size.
- [Section 4] The sentence 'the fact of adding stages does not produce an improvement in AM and PM noise performances' appears to contradict the later statement about improved effective NF. Clarify that AM and PM noise in dBc/Hz worsen with the number of stages, while the effective NF computed from those spectra can nonetheless improve at a fixed output power because the carrier power also increases with gain.
- [References] Reference [15] (Adamian and Uhlir) is listed in the bibliography but not cited in the text; reference [19] (Friis) is cited in Section 3 and 4 but appears after [18] in the reference list. Please check the citation order.
Circularity Check
No significant circularity: the central measured trends and the cascade argument rest on new experimental data, while prior self-citations supply definitions and calibration methods rather than the reported results.
full rationale
The paper's central claims are the measured effective noise-figure trend versus stage count at fixed output power and the measured AM-to-PM coherence peaks near the 1 dB compression point. These are presented as raw measurement results (Figures 6-13), not as outputs of a fitted model. The cascade argument in Section 4 uses standard Friis-type reasoning that each stage amplifies prior noise and adds its own contribution; this is an explanatory model consistent with the data, not a quantity fitted to the data and then renamed as a prediction. The effective NF definition is imported from the authors' earlier work (ref. 12) and the measurement/calibration procedure from ref. 17, and the AM-PM derivative link from ref. 13, but those citations provide definitions, calibration methodology, and a qualitative hypothesis, not the reported data or the central trend. No parameter is fitted to a subset of the data and then used to predict a closely related quantity, and no quantity is defined in terms of the quantity it is said to explain. The observed coherence peaks and the measured AM-PM derivatives are independent measurements that are compared qualitatively. The skeptical concern about quadrature crosstalk is a measurement-validity question, not a circularity of the derivation chain, and therefore does not raise the circularity score. Overall, the derivation chain is self-contained once the cited measurement definitions are accepted.
Assumptions & free parameters
assumptions (5)
- domain assumption Noise in amplifiers can be modeled as small-index AM and PM modulation sidebands superimposed on the carrier.
- domain assumption The coherence function computed from measured cross-spectral density gives the true AM-PM correlation of the DUT.
- domain assumption Effective NF derived from AM and PM white noise spectra equals the standard noise figure under linear operation.
- domain assumption The AM-PM derivative of the amplifier's steady-state input-output characteristic is directly related to the mechanisms producing AM-PM noise correlation.
- domain assumption Noise contributions of individual stages add in power and are amplified by the gain of subsequent stages following the Friis formula, even under mild compression.
Cite this review
Pith. "Pith review of Experimental Study of AM and PM Noise in Cascaded Amplifiers." pith.science (2026). https://pith.science/paper/X7JMOPC5
@misc{pith2026250118235,
  author       = {Pith},
  title        = {Pith review of: Experimental Study of AM and PM Noise in Cascaded Amplifiers},
  year         = {2026},
  howpublished = {\url{https://pith.science/paper/X7JMOPC5}},
  note         = {Machine review of arXiv:2501.18235}
}
read the original abstract
An experimental study of amplitude modulation and phase modulation noise spectra in cascaded amplifiers was carried out as a function of the number of amplification stages and the input power. Flicker and white noise contributions were determined, as well as effective noise figure from AM and PM noise spectra from small signal to large signal regimes. Simultaneous measurements of AM and PM noise were performed, and associated correlation was measured as a function of the offset frequency from the carrier. Measurements exhibited, in general, quite low AM PM correlation levels both in the flicker and white noise parts of the spectrum. In some particular amplifier configurations, however, measurements showed some peaks in the correlation at some specific input power levels in the transition zone, from a quasi-linear to strong compression. The results show that the effective noise figure decreases with the number of stages for a given carrier output power level.
Figures


Figures from the paper (5 more)




Reference graph
Works this paper leans on
-
[17]
Howe, D.; Ostrick, J. 100-GHz cooled amplifier residual pm and am noise measurements, noise figure, and jitter calculations. IEEE Trans. Microw. Theory Tech. 2003, 51, 2235–2242. [CrossRef]
work page 2003
-
[1]
Schematic of the experimental setup for the measurements. The system is settled in order to measure the DUT AM noise from the I branch output, eliminating PM noise contributions from the source and the DUT itself, and to obtain the PM noise produced by the DUT from the Q branch output, eliminating in this case the DUT AM noise contribution, as well as the...
work page 2022
-
[2]
Residual phase noise measurements of VHF, UHF, and microwave components
Montress, G.; Parker, T.; Loboda, M. Residual phase noise measurements of VHF, UHF, and microwave components. IEEE Trans. Ultrason. Ferroelectr. Freq. Control 1994, 41, 664–679. [CrossRef]
work page 1994
-
[3]
PM noise power spectra of one-stage amplifier with the carrier input power as a parameter. Electronics 2022, 11, 470 4 of 11 The simultaneous measure of the AM and PM noise spectra allows us to determine the AM to PM correlation by the evaluation of the coherence function, which is defined as a function of the offset frequency from the carrier. The cohere...
work page 2022
-
[4]
Comparison of 1/f PM noise in commercial amplifiers
Aramburu, M.C.D.; Ferre-Pikal, E.S.; Walls, F.L.; Ascarrunz, H.D. Comparison of 1/f PM noise in commercial amplifiers. In Proceedings of the International Frequency Control Symposium, Orlando, FL, USA, 30 May 1997; pp. 470–477
work page 1997
-
[5]
AM-to-PM coherence function, measured at 1 KHz offset frequency, versus carrier input power for one- to four-stage amplifiers. AM and PM noise performances as a function of input power and for 1–4 amplification stages are shown in terms of single-sideband noise power, with respect to carrier power [18], in Figures 6 and 7 for the white portion of the spec...
work page 2022
-
[6]
AM noise impact on low level phase noise measurements
Cibiel, G.; Régis, M.; Tournier, E.; Llopis, O. AM noise impact on low level phase noise measurements. IEEE Trans. Ultrason. Ferroelectr. Freq. Control 2002, 49, 784–788. [CrossRef] [PubMed]
work page 2002
-
[7]
AM and PM noise measured at 1 KHz offset frequency versus carrier input power, corre- sponding to one- to four-stage amplifiers. It is also interesting to observe the noise behavior in terms of effective NF (see Figure 8), which is obtained from AM and PM noise in the white region of the noise spectra around the carrier [12]. It can be observed that effec...
work page 2022
Show all 29 references
-
[8]
A Study of the Correlation Between High-Frequency Noise and Phase Noise in Low-Noise Silicon-Based Transistors
Cibiel, G.; Escotte, L.; Llopis, O. A Study of the Correlation Between High-Frequency Noise and Phase Noise in Low-Noise Silicon-Based Transistors. IEEE Trans. Microw. Theory Tech. 2004, 52, 183–190. [CrossRef] Electronics 2022, 11, 470 11 of 11
2004
-
[9]
It can be argued that achieving an identical output power implies that the noise power contribution of the last stage is identical for the all of the amplifiers, independent of their number of stages. Nevertheless, by adding stages, their contributions are minimized by the gai...
2022
-
[10]
Electronics 2022, 11, 470 8 of 11 From Figure 10, it can be argued that AM and PM noise produced at the first stage is the dominant contribution due to the subsequent amplification
AM and PM noise power measured at 1 KHz offset frequency versus carrier input power, produced into one- to four-stage amplifiers. Electronics 2022, 11, 470 8 of 11 From Figure 10, it can be argued that AM and PM noise produced at the first stage is the dominant contribution du...
2022
-
[11]
It is well known that the correlation is zero as far as additive white noise is con- cerned [22]
Measured AM-to-PM derivative versus carrier input power. It is well known that the correlation is zero as far as additive white noise is con- cerned [22]. Due to the particular noise mechanisms that control AM and PM noise conversion around the carrier, it can be conjectured t...
2022
-
[12]
Phase noise and AM noise measurements in the frequency domain
Lance, A.L.; Seal, W.D.; Labaar, F. Phase noise and AM noise measurements in the frequency domain. Infrared Millim. Waves 1984, 11, 239–289
1984
-
[13]
A noticeable similar peaking behavior is obtained in such derivatives at identical input power conditions compared to the peaks Electronics 2022, 11, 470 9 of 11 in the coherence function results of Figures 11 and
2022
-
[14]
As carrier power grows, measurements and simulations have shown that both flicker and white noise contributions are not the same for the AM and PM cases [12,13]
or cold source [15]. As carrier power grows, measurements and simulations have shown that both flicker and white noise contributions are not the same for the AM and PM cases [12,13]. In particular, flicker AM and PM noise power levels are different even when they are measured ...
2022
-
[15]
Measurement of Frequency, Phase Noise and Amplitude Noise
Walls, F.L.; Ferre-Pikal, E.S. Measurement of Frequency, Phase Noise and Amplitude Noise. IMS Wiley Encycl. Electr. Electron. Eng. 1999, 12, 459–473
1999
-
[16]
Noise figure vs
Hati, A.; Howe, D.; Walls, F.; Walker, D. Noise figure vs. PM noise measurements: A study at microwave frequencies. In Proceed- ings of the 2000 IEEE/EIA International Frequency Control Symposium and Exhibition, Kansas City, MO, USA, 9 June 2000; pp. 516–520
2000
-
[18]
IEEE: Piscataway, NJ, USA,
IEEE Standard 1139–1999; IEEE Standard Definitions of Physical Quantities for Fundamental Frequency and Time Metrology— Random Instabilities. IEEE: Piscataway, NJ, USA,
1999
-
[19]
The Room Temperature Multi-Channel Heterodyne Receiver Section of the PHAROS2 Phased Array Feed
Navarrini, A.; Scalambra, A.; Rusticelli, S.; Maccaferri, A.; Cattani, A.; Perini, F.; Ortu, P.; Roda, J.; Marongiu, P.; Saba, A.; et al. The Room Temperature Multi-Channel Heterodyne Receiver Section of the PHAROS2 Phased Array Feed. Electronics 2019, 8,
2019
-
[20]
Accurately Modeling of Zero Biased Schottky-Diodes at Millimeter- Wave Frequencies
Gutiérrez, J.; Zeljami, K.; Fernández, T.; Pascual, J.P.; Tazón, A. Accurately Modeling of Zero Biased Schottky-Diodes at Millimeter- Wave Frequencies. Electronics 2019, 8,
2019
-
[21]
Noise as a diagnostic tool for quality and reliability of electronic devices
Vandamme, J.K.J. Noise as a diagnostic tool for quality and reliability of electronic devices. IEEE Trans. Electron Devices 1994, 41, 2176–2187. [CrossRef]
1994
-
[22]
Investigations of AM, PM noise, and noise figure in an SiGe-HBT amplifier operating in linear and non- linear regime
Garmendia, N.; Portilla, J. Investigations of AM, PM noise, and noise figure in an SiGe-HBT amplifier operating in linear and non- linear regime. IEEE Trans. Microw. Theory Tech. 2010, 58, 807–813. [CrossRef]
2010
-
[23]
Effect of the Input and Output Impedance on Amplifier Large-Signal Noise Performances
Garmendia, N.; Portilla, J. Effect of the Input and Output Impedance on Amplifier Large-Signal Noise Performances. IEEE Trans. Microw. Theory Tech. 2011, 59, 1571–1578. [CrossRef]
2011
-
[24]
A Novel Procedure for Receiver Noise Characterization
Adamian, V.; Uhlir, A. A Novel Procedure for Receiver Noise Characterization. IEEE Trans. Instrum. Meas. 1973, 22, 181–182. [CrossRef]
1973
-
[25]
Optimum-setting and calibration procedures for heterodyne measurements of amplitude and phase noise in high-frequency amplifiers
Jauregui, R.; Portilla, J. Optimum-setting and calibration procedures for heterodyne measurements of amplitude and phase noise in high-frequency amplifiers. IEEE Trans. Microw. Theory Tech. 2014, 62, 1239–1248. [CrossRef]
2014
-
[27]
Noise Figures of Radio Receivers
Friis, H. Noise Figures of Radio Receivers. Proc. IRE 1944, 32, 419–422. [CrossRef]
1944
-
[28]
General noise analysis of nonlinear microwave circuits by the piecewise harmonic-balance technique
Rizzoli, V.; Mastri, F.; Masotti, D. General noise analysis of nonlinear microwave circuits by the piecewise harmonic-balance technique. IEEE Trans. Microw. Theory Tech. 1994, 42, 807–819. [CrossRef]
1994
-
[29]
Physics-based simulation techniques for small- and large-signal device noise analysis in RF applications
Bonani, F.; Guerrieri, S.D.; Ghione, G. Physics-based simulation techniques for small- and large-signal device noise analysis in RF applications. IEEE Trans. Electron Devices 2003, 50, 633–644. [CrossRef]
2003
-
[470]
This is more noticeable as the amplifiers are driven into compression
https://doi.org/10.3390/electronics11030470 https://www.mdpi.com/journal/electronics Electronics 2022, 11, 470 2 of 11 ± LPF ADC CW DUT 90º LPF ADC either for a given input or output carrier power level. This is more noticeable as the amplifiers are driven into compression. Ne...
2022 doi
Reviewed August 10, 2026 · model on record in the stance chip above.
Discussion (0). Continue with ORCID to comment.