REVIEW 4 major objections 4 minor 1 cited by
Flexible Bayesian Tensor Decomposition for Verbal Autopsy Data
T0 review · 4 major / 4 minor · reviewed 2026-08-09 · deepseek-v4-flash
Pith's one-line read Modeling symptom groups with a collapsed Tucker decomposition makes verbal autopsy cause assignment more accurate and more interpretable.
desk verdict Solid VA modeling paper with a real interpretability payoff, but the abstract overclaims predictive accuracy; the simulation is a within-family recovery test and the real-data gain is CSMF-specific. read the letter →
The pith
A machine-rendered reading of the paper's core claim, the machinery that carries it, and where it could break.
The reading
What carries the argument
The central object is the conditional symptom probability tensor $p(X \mid Y)$, a $p$-way binary tensor per cause. The key mechanism is the collapsed Tucker (c-Tucker) decomposition: each cause's distribution is a mixture over $r$ group-level latent classes, and the joint mixing weight $\lambda_{c,k_1,\dots,k_r}$ is itself written as a rank-$h$ PARAFAC, $\lambda_{c,k_1,\dots,k_r} = \sum_{l=1}^h \nu_{c l} \prod_{s=1}^r \psi_{c l s k_s}$. The factors $\phi_{c k j}$ are Bernoulli probabilities for symptom $j$ under latent class $k$, and the grouping $s_{c j}$ is estimated from data rather than fixed. The r-group independent PARAFACs model is the special case $h=1$, and standard PARAFAC is $h=r=1$, so the approach interpolates between conditional independence and full Tucker structure. This decomposition carries the argument: it replaces one global latent class with many small group-level classes, cutting the profile count from $K^r$ to $pK$ and making the learned groups directly interpretable.
What would settle it
Fit the c-Tucker model on one population's labeled verbal autopsies and apply it to a target population whose symptom-reporting patterns for the same underlying causes are known to differ (for example, a different questionnaire translation or care-seeking context), then compare the predicted cause-of-death fractions against medically certified causes. If CSMF accuracy falls well below the level reported on the PHMRC resampling experiment, the label-shift assumption is the point of failure.
Extended reading notes
Core claim
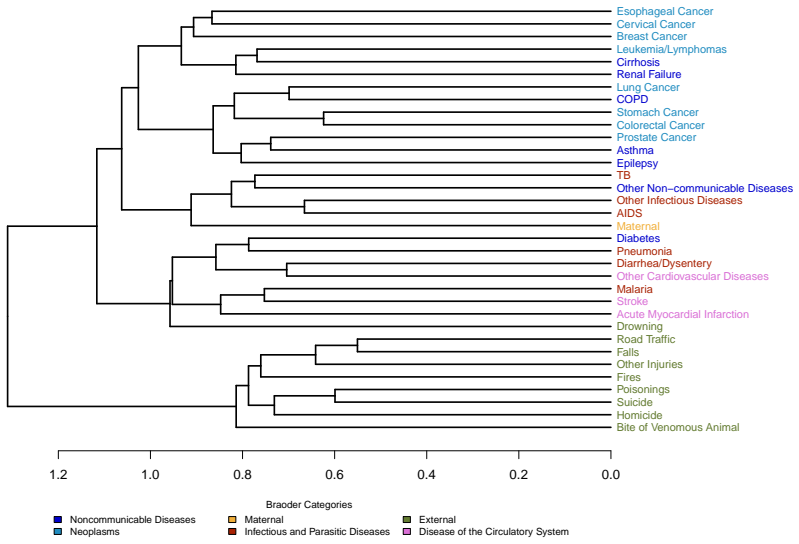
The paper's central claim is that the probability tensor $p(X \mid Y)$ of binary symptoms conditional on cause of death can be approximated by a dimension-grouped tensor decomposition that is both more flexible and more parsimonious than a single PARAFAC/latent class model. With symptom groups indexed by $s=1,\dots,r$, each cause $c$ is described by group-specific latent class indicators $Z_{is}$ and symptom sub-profiles $\phi_{c k j}$; the r-group independent PARAFACs model treats the group indicators as independent given cause, while the c-Tucker model couples them through a higher-level latent variable $H_i$ whose mixing weights $\nu_c$ and group factors $\psi_{c l s}$ form another PARAFAC. This lets the model express up to $K^r$ distinct latent symptom profiles using only $pK$ profile parameters. On the PHMRC dataset the fitted c-Tucker model ($K=4$, $r=8$, $h=3$) is reported to match LCVA on top-cause accuracy and exceed all compared methods on CSMF accuracy, and the posterior symptom groups reproduce recognizable clusters (e.g., stroke and AIDS each get distinct but overlapping symptom topics) while the cause-level dendrogram aligns with broad disease categories.
Load-bearing premise
The method assumes label shift: the chance of reporting each symptom given a cause is identical in the training and target populations, so only the cause-of-death prevalence may differ; if symptom reporting changes, predicted causes will be biased.
Editorial extensions
If this is right
- With $r$ symptom groups and $K$ latent classes, c-Tucker represents a dependence structure that a standard PARAFAC would need $K^r$ latent profiles to express, so complex symptom dependence is captured with far fewer parameters.
- The estimated symptom groups and the cause-level dendrogram give a descriptive summary of which symptoms cluster together for each cause, and the dendrogram aligns with broad medical categories such as infectious, circulatory, neoplastic, and external causes.
- On the PHMRC resampled target datasets, c-Tucker achieves the highest CSMF accuracy among InSilicoVA, LCVA, PARAFAC, and r-group independent PARAFACs, meaning better estimates of population cause-of-death fractions.
- In the simulation study, both grouped models maintain higher top-cause and CSMF accuracy than standard PARAFAC and LCVA even under a misspecified distribution shift, indicating that the flexible grouped structure is more robust to model error.
- The model provides a practical selection rule for latent dimensions: fit with large $K$ and $r$, then choose the smallest values whose groups and classes are utilized in more than 5% of posterior samples.
Reading between the lines
- Editorial inference: the estimated symptom groups, especially the anchor symptoms with high group-assignment probability, could be used to shorten verbal autopsy questionnaires without much loss of classification accuracy.
- Editorial inference: the Scenario II simulation suggests the grouped latent structure can absorb some cause-conditional distribution shift, so the c-Tucker model may serve as a building block for multi-source domain adaptation even though the paper does not implement it.
- Editorial inference: the Adjusted Rand Index-based cause dendrogram could be used to decide when rare causes should be merged in a cause hierarchy, a decision VA users currently make ad hoc.
- Editorial inference: because the empirical comparison uses only the PHMRC dataset, the claim that c-Tucker beats LCVA on CSMF accuracy would be strengthened by replication on independent gold-standard VA data such as WHO-2016.
Signed reviews
Editorial analysis
A structured set of objections, weighed in public.
Referee Report
Summary. The paper proposes two Bayesian hierarchical tensor decomposition models for verbal autopsy data: r-group independent PARAFACs and collapsed Tucker (c-Tucker). Symptoms are partitioned into groups, with cause-specific grouping indicators; each group has its own latent class sub-profile, and c-Tucker adds a higher-level mixture over group weights. The authors present Gibbs sampling updates, a simulation study, and an application to the PHMRC gold-standard dataset, claiming better predictive accuracy than LCVA and InSilicoVA along with a more parsimonious and interpretable latent representation.
Significance. If the comparative accuracy claim held, the tensor-decomposition framework would be a valuable addition to VA methodology because it combines flexible symptom dependence with interpretable symptom clusters. The paper has real strengths: the hierarchical representation in Section 2.3 is clearly specified, the MCMC updates in Section 3 are explicit and complete, and the PHMRC analysis includes comparisons with LCVA and InSilicoVA and exposes clinically coherent groupings (Figures 6-8). The central problem is that the headline claim of 'better predictive accuracy than existing VA methods' is not supported by the evidence: the simulation is a within-family recovery experiment, and the real-data results show c-Tucker is slightly worse than LCVA on top-cause accuracy (Figure 9). The methodological contribution is promising, but the evidence base needs revision before the comparative claims can be accepted.
major comments (4)
- [Abstract; Section 4; Section 5.4] The comparative claim in the Abstract that the proposed methods 'achieve better predictive accuracy than existing VA methods' is not supported by the evidence as presented. In Section 4, the synthetic data are generated from the proposed c-Tucker model with K=3, r=5, h=3 and the proposed models are fitted under the same K, r, h; the comparators are standard PARAFAC with K=5, 10, 15 and LCVA with K=10. Figure 3 therefore largely demonstrates that c-Tucker can recover its own generative process. The non-circular comparison on PHMRC (Figure 9) shows that c-Tucker has slightly lower top-cause accuracy than LCVA and only a CSMF-accuracy advantage. I recommend either adding simulations that generate data from competing or out-of-family models, or revising the abstract and conclusions to claim 'comparable top-cause accuracy and improved CSMF accuracy on PHMRC'.
- [Section 2.3, Eqs. (12)-(13); Section 4, Scenario II] The label-shift assumption stated in Section 2.3--p(X|Y) is the same in training and target, with only p(Y) changing--is load-bearing for transfer to unlabeled target data. Scenario II of the simulation changes the mixing weights ψ(g) between training and target, but the data are still generated from the same c-Tucker family, so this tests only a restricted form of misspecification. The text in Section 4 stating that the proposed models are 'more robust to distribution shift' is stronger than warranted; realistic violations such as differential symptom reporting or questionnaire changes are not examined, and the Discussion acknowledges this limitation. Please add a sensitivity analysis with a genuinely different target distribution, or temper the robustness claims.
- [Section 5.2, Figure 7] The interpretability analysis relies on posterior means of the latent parameters ϕ, ν, and ψ (e.g., Figure 7), but the paper does not address label switching or permutation invariance of the Bayesian mixture/tensor decomposition. Without a relabeling constraint or post-processing, posterior averages across MCMC iterations can mix different permutations of the latent classes, making the reported 'posterior mean' profiles and the cause dendrogram difficult to interpret. Please either justify that label switching is resolved in the sampler or use label-invariant summaries (e.g., clustering-based relabeling, or summaries of permutation-invariant quantities).
- [Section 5.1] The PHMRC results are conditional on model dimensions selected by the utilization-rate heuristics in Section 5.1 (r=8, K=4, h=3 for c-Tucker; r=6, K=5 for rIndep), with no sensitivity analysis around these choices. Since the headline comparison in Figure 9 depends on these settings, the reported advantage could be an artifact of tuning. Please report accuracy for nearby values of K and r (and h) and describe how sensitive the conclusions are.
minor comments (4)
- [Section 2.2, Eqs. (3)-(4)] There is a notational inconsistency: Eq. (3) uses sj for symptom group membership, while the hierarchical representation in Eqs. (7)-(8) and the MCMC update in Step 8 use scj, which is cause-specific. Please clarify whether the grouping is shared across causes or cause-specific and align the notation throughout.
- [Section 5.2] The text says the analysis is illustrated 'in one synthetic dataset' even though Section 5 analyzes the PHMRC data. Since the PHMRC target datasets are resampled, please clarify whether this refers to one resampled target dataset or a simulated dataset.
- [Section 5.4, Figure 9] The boxplots in Figure 9 are informative, but numerical means and credible intervals for top-cause accuracy and CSMF accuracy across the 50 target datasets would make the comparison easier to assess, especially because the differences between c-Tucker and LCVA appear small.
- [Introduction, paragraph 4] There is a typo, 'Specicically' instead of 'Specifically'.
Circularity Check
No significant circularity; the central real-data comparison is external (PHMRC), and self-citations are contextual rather than load-bearing.
full rationale
The paper's derivation chain is not circular by the paper's own equations. The c-Tucker and r-group independent PARAFAC models are explicitly attributed to Johndrow et al. (2017), so the tensor decomposition formulation is not derived from the authors' own prior results. The main predictive claim is evaluated on the PHMRC gold-standard dataset against external baselines LCVA and InSilicoVA, and the paper reports the results honestly: c-Tucker shows lower top-cause accuracy than LCVA but higher CSMF accuracy, with an explicit caution against overinterpreting this single dataset. The simulation study does generate data from the proposed c-Tucker model at the same K, r, h settings used for fitting, which is a favorable within-model benchmark, but this is disclosed, is standard practice for checking recovery, and is supplemented by the external real-data comparison. Self-citations to Li et al. (2024) and Wu et al. (2024) are used to motivate the latent class framework and to justify LCVA as a strong baseline, but they do not supply a uniqueness theorem or otherwise force the paper's conclusions. The label-shift assumption is stated explicitly as an assumption, not defined in terms of the method's output. No fitted parameter is renamed as a prediction, and no equation reduces to its own input by construction. The main weakness of the paper is that the abstract overstates the predictive-accuracy advantage relative to the PHMRC top-cause results, but this is a correctness/calibration concern, not a circularity concern.
Assumptions & free parameters
free parameters (3)
- K (number of latent classes per symptom group) =
4 for c-Tucker, 5 for rIndep on PHMRC; 3 in simulation
- r (number of symptom groups) =
8 for c-Tucker, 6 for rIndep on PHMRC; 5 in simulation
- h (number of higher-level latent components in c-Tucker) =
3 in PHMRC analysis and simulation
assumptions (3)
- domain assumption Label shift between training and target datasets
- domain assumption Conditional independence of symptoms given latent class membership within each symptom group
- domain assumption Between-group independence for the r-group independent PARAFACs model
Cite this review
Pith. "Pith review of Flexible Bayesian Tensor Decomposition for Verbal Autopsy Data." pith.science (2026). https://pith.science/paper/DY3NCCXN
@misc{pith2026250200171,
  author       = {Pith},
  title        = {Pith review of: Flexible Bayesian Tensor Decomposition for Verbal Autopsy Data},
  year         = {2026},
  howpublished = {\url{https://pith.science/paper/DY3NCCXN}},
  note         = {Machine review of arXiv:2502.00171}
}
read the original abstract
Cause-of-death data is fundamental for understanding population health trends and inequalities as well as designing and evaluating public health interventions. A significant proportion of global deaths, particularly in low- and middle-income countries (LMICs), do not have medically certified causes assigned. In such settings, verbal autopsy (VA) is a widely adopted approach to estimate disease burdens by interviewing caregivers of the deceased. Recently, latent class models have been developed to model the joint distribution of symptoms and perform probabilistic cause-of-death assignment. A large number of latent classes are usually needed in order to characterize the complex dependence among symptoms, making the estimated symptom profiles challenging to summarize and interpret. In this paper, we propose a flexible Bayesian tensor decomposition framework that balances the predictive accuracy of the cause-of-death assignment task and the interpretability of the latent structures. The key to our approach is to partition symptoms into groups and model the joint distributions of group-level symptom sub-profiles. The proposed methods achieve better predictive accuracy than existing VA methods and provide a more parsimonious representation of the symptom distributions. We show our methods provide new insights into the clustering patterns of both symptoms and causes using the PHMRC gold-standard VA dataset.
Figures


Figures from the paper (6 more)



Forward citations
Cited by 1 Pith paper
-
Calibration of answer probabilities in verbal autopsies: Working Paper
Imputation accuracy over left-out question blocks can identify and roughly correct wrong cause-of-death probability tables in verbal autopsies using only unlabeled questionnaires, under a block-conditional-independenc...
Reference graph
Works this paper leans on
-
[1]
write newline
" write newline "" before.all 'output.state := FUNCTION article output.bibitem format.authors "author" output.check author format.key output output.year.check new.block format.title "title" output.check new.block crossref missing format.jour.vol output format.article.crossref output.nonnull format.pages output if new.block note output fin.entry FUNCTION b...
-
[2]
Arora, Sanjeev, Ge, Rong, Halpern, Yonatan, Mimno, David, Moitra, Ankur, Sontag, David, Wu, Yichen and Zhu, Michael . (2013). A practical algorithm for topic modeling with provable guarantees. In: International conference on machine learning\/ . PMLR. pp.\ 280--288
work page 2013
-
[3]
Byass, Peter . (2014). Usefulness of the population health metrics research consortium gold standard verbal autopsy data for general verbal autopsy methods. BMC medicine\/ 12, 1--10
work page 2014
-
[4]
Byass, Peter, Hussain-Alkhateeb, Laith, D’Ambruoso, Lucia, Clark, Samuel, Davies, Justine, Fottrell, Edward, Bird, Jon, Kabudula, Chodziwadziwa, Tollman, Stephen, Kahn, Kathleen and others . (2019). An integrated approach to processing who-2016 verbal autopsy data: the interva-5 model. BMC Medicine\/ 17(1), 1--12
work page 2019
-
[5]
Clark, Samuel J, Li, Zehang R and McCormick, Tyler H . (2018). Quantifying the contributions of training data and algorithm logic to the performance of automated cause-assignment algorithms for verbal autopsy. arXiv: 1803.07141\/
work page Pith review arXiv 2018
-
[6]
Dunson, David B and Xing, Chuanhua . (2009). Nonparametric Bayes modeling of multivariate categorical data. Journal of the American Statistical Association\/ 104(487), 1042--1051
work page 2009
-
[7]
Hitchcock, Frank Lauren . (1927). The expression of a tensor or a polyadic as a sum of products. Journal of Mathematics and Physics\/ 6, 164--189
work page 1927
-
[8]
Johndrow, James E., Bhattacharya, Anirban and Dunson, David B. (2017). Tensor decompositions and sparse log-linear models . The Annals of Statistics\/ 45(1), 1 -- 38
work page 2017
Show all 26 references
-
[9]
(2008, 09)
King, Gary and Lu, Ying . (2008, 09). Verbal autopsy methods with multiple causes of death. Statistical Science\/ 23
2008
-
[10]
Kunihama, Tsuyoshi, Li, Zehang R, Clark, Samuel J and McCormick, Tyler H . (2020). Bayesian factor models for probabilistic cause of death assessment with verbal autopsies . The Annals of Applied Statistics\/
2020
-
[11]
Li, Mengbing, Stephenson, Briana and Wu, Zhenke . (2023). Tree-regularized bayesian latent class analysis for improving weakly separated dietary pattern subtyping in small-sized subpopulations. arXiv preprint arXiv:2306.04700\/
2023 arXiv
-
[12]
and Clark, Samuel J
Li, Zehang Richard, McComick, Tyler H. and Clark, Samuel J. (2020, 09). Using Bayesian latent G aussian graphical models to infer symptom associations in verbal autopsies. Bayesian Analysis\/ 15(3), 781--807
2020
-
[13]
Li, Zehang Richard, Wu, Zhenke, Chen, Irena and Clark, Samuel J . (2024). Bayesian nested latent class models for cause-of-death assignment using verbal autopsies across multiple domains. Annals of Applied Staitstics\/ 18(2), 1137--1159
2024
-
[14]
(2010, 03)
Maher, D., Biraro, S., Hosegood, Victoria, Isingo, R., Lutalo, Tom, Mushati, P., Ngwira, Bagrey, Nyirenda, Makandwe, Todd, Jim and Zaba, Basia . (2010, 03). Translating global health research aims into action: The example of the ALPHA network. 15, 321 -- 328
2010
-
[15]
McCormick, Tyler H, Li, Zehang R, Calvert, Clara, Crampin, Amelia C, Kahn, Kathleen and Clark, Samuel J . (2016). Probabilistic cause-of-death assignment using verbal autopsies. Journal of the American Statistical Association\/ 111(515), 1036--1049
2016
-
[16]
Moran, Gemma Elyse, Sridhar, Dhanya, Wang, Yixin and Blei, David . (2022). Identifiable deep generative models via sparse decoding. Transactions on Machine Learning Research\/
2022
-
[17]
Moran, Kelly R, Turner, Elizabeth L, Dunson, David and Herring, Amy H . (2021). Bayesian hierarchical factor regression models to infer cause of death from verbal autopsy data. Journal of the Royal Statistical Society: Series C (Applied Statistics)\/
2021
-
[18]
Murray, Christopher JL, Lopez, Alan D, Black, Robert, Ahuja, Ramesh, Ali, Said M, Baqui, Abdullah, Dandona, Lalit, Dantzer, Emily, Das, Vinita, Dhingra, Usha and others . (2011). Population health metrics research consortium gold standard verbal autopsy validation study: desig...
2011
-
[19]
(2020, 01)
Nkengasong, John, Gudo, Eduardo, Macicame, Ivalda, Maunze, Xadreque, Amouzou, Agbessi, Banke, Kathryn, Dowell, Scott and Jani, Ilesh . (2020, 01). Improving birth and death data for A frican decision making. The Lancet Global Health\/ 8, e35--e36
2020
-
[20]
Rand, William M. (1971). Objective criteria for the evaluation of clustering methods. Journal of the American Statistical Association\/ 66(336), 846--850
1971
-
[21]
(2012, 06)
Sankoh, Osman and Byass, Peter . (2012, 06). The indepth network: Filling vital gaps in global epidemiology. International Journal of Epidemiology\/ 41, 579--88
2012
-
[22]
Hafizur, Dandona, Rakhi and others
Serina, Peter, Riley, Ian, Stewart, Andrea, James, Spencer, Flaxman, Abraham, Lozano, Rafael, Hernández-Prado, Bernardo, Mooney, Meghan, Luning, Richard, Black, Robert, Ahuja, Ramesh, Alam, Nurul, Alam, Sayed Saidul, Ali, Said, Atkinson, Charles, Baqui, Abdullah, Chowdhury, Dr...
2015
-
[23]
Storkey, Amos . (2009). When training and test sets are different: characterizing learning transfer. Dataset shift in machine learning\/ 30, 3--28
2009
-
[24]
Tucker, Ledyard . (1966). Some mathematical notes on three-mode factor analysis. Psychometrika\/ 31(3), 279--311
1966
-
[25]
(2024, 02)
Wu, Zhenke, Li, Zehang Richard, Chen, Irena and Li, Mengbing . (2024, 02). Tree-informed B ayesian multi-source domain adaptation: cross-population probabilistic cause-of-death assignment using verbal autopsy. Biostatistics\/ , kxae005
2024
-
[26]
and Dunson, David B
Zhou, Jing, Bhattacharya, Anirban, Herring, Amy H. and Dunson, David B. (2015). Bayesian factorizations of big sparse tensors. Journal of the American Statistical Association\/ 110(512), 1562--1576. PMID: 31210707
2015
Reviewed August 9, 2026 · model on record in the stance chip above.
Discussion (0). Continue with ORCID to comment.