REVIEW 4 major objections 5 minor 101 references
Bayesian Spatiotemporal Nonstationary Model Quantifies Robust Increases in Daily Extreme Rainfall Across the Western Gulf Coast
T0 review · 4 major / 5 minor · reviewed 2026-08-09 · deepseek-v4-flash
Pith's one-line read The paper claims that a hierarchical Bayesian model pooling daily rainfall extremes across space and letting the distribution shift with atmospheric CO2 shows 100-year daily rainfall return levels in the Western Gulf Coast rose 10 to 35…
desk verdict A useful, well-validated hierarchical Bayesian framework for nonstationary extreme rainfall, but the 'robust 10–35% increase' claim is not yet supported by the reported uncertainty or the model-comparison scores. read the letter →
The pith
A machine-rendered reading of the paper's core claim, the machinery that carries it, and where it could break.
The reading
What carries the argument
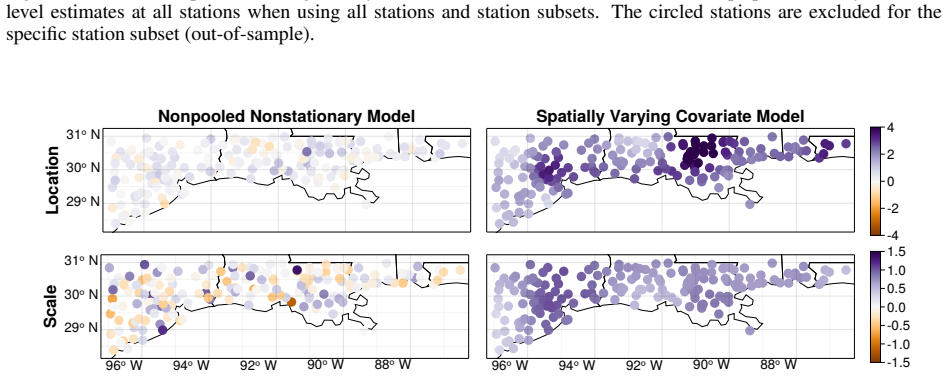
The load-bearing object is the Spatially Varying Covariates Model: a hierarchical Bayesian model in which each site's annual maximum follows a GEV distribution whose location $\mu(s,t)=\alpha_\mu(s)+\beta_\mu(s)x(t)$ and scale $\sigma(s,t)=\exp(\log\alpha_\sigma(s)+\beta_\sigma(s)x(t))$ are linear functions of $\ln(\mathrm{CO}_2)$, with the four spatially varying fields ($\alpha_\mu$, $\log\alpha_\sigma$, $\beta_\mu$, $\beta_\sigma$) drawn from independent Gaussian processes using an exponential kernel, and with a single shape parameter held constant across space and time. The Gaussian process layer is the regionalization mechanism: it lets nearby stations borrow strength from one another, smoothing away the noisy and physically implausible coefficient maps produced by separate station-by-station fits, while still allowing the climate response to vary in space. The $\ln(\mathrm{CO}_2)$ covariate is the nonstationarity driver, chosen as a low-noise proxy for anthropogenic warming, and it is this combination of spatial pooling and a process-informed covariate that carries the argument that nonstationary return levels can be estimated robustly.
What would settle it
Refit the model on the same 181 stations allowing the GEV shape parameter to vary in space and time and adding an ENSO index as a second covariate; if the posterior distributions for the 1940-to-2022 change in 100-year rainfall then include zero over most of the study region, the paper's central claim of robust 10 to 35 percent increases is falsified.
Extended reading notes
Core claim
The central discovery is that regionalizing the climate-covariate response, not just the GEV parameters, makes nonstationary extreme-value trends estimable from short and uneven gauge records. On the Western Gulf Coast, the posterior mean of the $\ln(\mathrm{CO}_2)$ coefficient is positive for both the GEV location and scale parameters across most of the domain, implying that the daily-extreme distribution is shifting upward and widening, with the strongest trends near Houston and New Orleans. Return levels for both 10-year and 100-year events increase throughout the study area, with 100-year levels up 10 to 35 percent from 1940 to 2022. In cross-validation, the nonstationary model matches a stationary pooled model on overall scores and beats an unpooled station-by-station nonstationary model, especially for the upper quantiles, which supports the claim that the trend signal is robust rather than an artifact of overfitting. Comparison with NOAA Atlas 14 shows the stationary guidance underestimates current 24-hour rainfall in places such as New Orleans, Galveston, and Mobile while overestimating Houston today; under RCP6 emissions the model projects Atlas 14 will understate Houston's 100-year rainfall after about 2025.
Load-bearing premise
The whole trend result rides on the assumption that the change in extreme rainfall is fully captured by a straight-line regression of the GEV location and scale on $\ln(\mathrm{CO}_2)$, with the shape parameter held fixed in space and time; if the real relationship is nonlinear or shaped by other drivers, the estimated 10 to 35 percent return-level increases could be biased.
Editorial extensions
If this is right
- If current stationary intensity-duration-frequency guidance is used for design, present-day 100-year rainfall is understated in parts of the Western Gulf Coast, and the gap widens under continued emissions.
- The model yields smooth return-level estimates at ungauged locations, because the Gaussian process layer can interpolate the distribution parameters anywhere in the study domain.
- The framework can be adapted to other durations and other regions whenever a credible climate covariate is available, and it accommodates stations with uneven record lengths.
- Cross-validation shows that pooling nonstationarity across space performs as well as a stationary pooled model on overall scores and better at the 50-year and 100-year quantiles, so the nonstationary estimates are not bought at the cost of predictive skill.
Reading between the lines
- Because the model fixes the GEV shape parameter in space and time, a natural stress test is to let shape vary; if shape is actually changing, the reported return-level increases could be misallocated between the center and the tail of the distribution.
- The choice of $\ln(\mathrm{CO}_2)$ as the sole covariate leaves an opening for natural variability such as ENSO; a model that includes such a covariate could separate forced change from internal variability, which the paper explicitly sets aside.
- The 10 to 35 percent range is observation-based, and a testable extension is to compare these return-level maps with radar-based or reanalysis-based estimates over the same period, which the paper notes as future work with alternative data sources.
- Because the spatial pooling smooths the climate response, the method may understate localized trends driven by urbanization or land-surface change, since the paper does not include elevation or land-cover covariates.
Editorial analysis
A structured set of objections, weighed in public.
Referee Report
Summary. The paper proposes a hierarchical Bayesian spatial model, the Spatially Varying Covariates Model, for nonstationary frequency analysis of daily extreme precipitation. GEV location and scale parameters are regressed on ln(CO2) with spatially varying coefficients modeled by Gaussian processes, while the shape parameter is constant in space and time. The model is applied to annual maxima from 181 GHCN stations in the Western Gulf Coast. Validation includes temporal and spatial cross-validation, MCMC diagnostics, and comparison with NOAA Atlas 14. The main scientific claim is that 100-year (and 10-year) return levels increased by 10–35% from 1940 to 2022 throughout the study region, with larger increases near Houston and New Orleans, and that future RCP6.0 projections exceed Atlas 14 at several cities.
Significance. If the central claim is correct, the paper has direct practical relevance: it would imply that stationary guidance such as NOAA Atlas 14 underestimates current and future extreme rainfall in parts of the Gulf Coast. Methodologically, the model is a sensible synthesis of regionalization and process-informed nonstationarity, and it is reasonably validated: the authors provide out-of-sample temporal and spatial cross-validation, multiple scoring rules, MCMC trace plots and R-hat checks, and publicly available code. The paper is also honest about limitations (fixed shape, independence conditional on parameters, computational cost). The main weakness is that the headline 'robust increase throughout the study area' is not backed by the uncertainty quantification that the Bayesian framework is designed to provide, and the model comparison does not clearly favor the nonstationary model over a stationary pooled alternative.
major comments (4)
- [Section 3.2.2, Figs. 7 and A4] The central claim that 'return levels have increased by between 10 and 35% over the past 80 years throughout the study region' is presented only as posterior means on maps, with no credible intervals, no posterior probability that the increase exceeds zero, and no spatial summary of uncertainty. Because the MCMC chains already exist, this is a reporting gap rather than a methodological limitation. Please add, for the percentage-change maps, either (a) maps of posterior standard deviation or 95% credible interval width, (b) a map of the posterior probability that the change is positive, or (c) interval estimates for representative grid cells or regions. Without this, the adjectives 'robust' in the Abstract and Section 5 and 'throughout the study area' in Section 3.2.2 are not supported.
- [Table 2] The out-of-sample comparison does not favor the Spatially Varying Covariates Model over the Pooled Stationary Model: the stationary model has lower LogS (1.9322 vs. 1.9495), lower CRPS (0.2548 vs. 0.2574), and lower QS at p=0.9 (0.4671 vs. 0.4712). The nonstationary model improves QS only at p=0.98 and p=0.99 (0.1680 vs. 0.1689 and 0.1018 vs. 0.1027). The text in Section 3.3.1 and Section 5 states that the model 'performs similarly to the stationary framework' and 'outperforms the nonstationary framework at individual stations,' which is fair, but the stronger framing in the Introduction and Conclusions that the model is validated 'through cross-validation and multiple performance metrics' should be calibrated to this result. Please report uncertainty in the score differences (e.g., block bootstrap or per-station score distributions) or a formal model-comparison statistic such as DIC/WAIC, so readers can see whether the observed differences are meaningful rather than noise.
- [Section 2.3.2 and Eqs. (10)–(11)] The nonstationary signal is entirely captured by a linear regression on ln(CO2), with no other time-varying covariates and with the shape parameter fixed in space and time. The paper gives reasonable physical and statistical justifications for these choices, but it does not test whether the conclusions are sensitive to them. Given that the pooled stationary model performs comparably out-of-sample, a reader cannot rule out that the estimated trends are a consequence of the linear-in-ln(CO2) assumption rather than a robust feature of the data. Please add a sensitivity analysis: for example, include an ENSO index or a quadratic time term as an additional covariate, or allow the shape parameter to vary slowly in space, and report whether the 10–35% return-level increase persists. A qualitative statement about the plausible direction of bias is not sufficient for the strength of the claim.
- [Section 3.1, Fig. 3] The probability integral transform (PIT) histogram in Fig. 3 is described as 'generally displaying a nearly uniform shape,' but no quantitative calibration test is provided. Because this is one of the main pieces of evidence for model adequacy, please report a formal uniformity test (e.g., Anderson–Darling or a chi-square statistic on the PIT values) or, failing that, the number of observations falling in each decile. This is a relatively small issue compared to the previous two, but it would strengthen the validation section.
minor comments (5)
- [Section 2.3.3, Eq. (21)] The kernel subscript in Eq. (21) reads K_{βσ0}; this is likely a typo for K_{βσ}. Please fix.
- [Section 2.3 heading] The heading 'Nonpooled Nonstatioanry Model' contains a typo; it should be 'Nonpooled Nonstationary Model.'
- [Section 2.5] The sentence 'The Bayesian framework is built in R and the stan programming language,,' has a double comma and should be rephrased.
- [Figure 7 and A4] The color scales for the 'Difference' rows use a map that starts at 10% and ends at 35%; it would be helpful to state explicitly in the caption that values below 10% or above 35% are not present in the posterior mean, or to use a diverging scale that includes zero so the reader can see where changes are near zero.
- [Section 3.3.2, Fig. 9] The caption for Fig. 9 refers to 'RCP 6' but the text in Section 3.3.2 says 'RCP6'; please use one consistent abbreviation throughout.
Circularity Check
No significant circularity: the nonstationary trends are estimated from the data and validated out-of-sample; the self-citations are contextual and not load-bearing.
full rationale
The derivation is self-contained and non-circular. The Spatially Varying Covariates Model (Eqs. 17-24) specifies GEV location and scale parameters as linear functions of ln CO2 with spatially varying coefficients assigned symmetric Normal(0,1) priors, so the sign and magnitude of the estimated trends are learned from the data rather than imposed by construction. The central return-level changes (Section 3.2.2) are deterministic evaluations of the fitted nonstationary GEV at 1940 and 2022 CO2 values; this is a legitimate model summary and not a renamed input. The RCP6 projections (Section 3.3.2) extrapolate the fitted response to an external emissions scenario, which is genuine prediction rather than a restatement of the training data. Temporal cross-validation on even/odd years and spatial cross-validation with five station subsets (Section 2.4) provide out-of-sample checks, and comparisons to NOAA Atlas 14 provide an external benchmark. The self-citations to Lee and Haran (2022), Doss-Gollin et al. (2019), Farnham et al. (2018), and Sharma et al. (2021) are contextual: they motivate hierarchical spatial modeling or moving-window limitations, but they do not supply any fitted quantity, uniqueness claim, or ansatz used to derive the central result. Concerns that Fig. 7 and Fig. A4 report only posterior means without credible intervals, and that Table 2 shows the Spatially Varying Covariates Model does not beat the Pooled Stationary Model on LogS and CRPS, are statistical-evidence and robustness concerns rather than circularity, so they do not raise the circularity score.
Assumptions & free parameters
free parameters (4)
- GEV location intercept and slope (mu0(s), beta_mu(s)) for ln CO2 =
Posterior means mapped in Fig. 6
- GEV log-scale intercept and slope (log sigma0(s), beta_sigma(s)) for ln CO2 =
Posterior means mapped in Fig. 6
- GEV shape parameter xi =
Posterior mean not reported numerically
- GP kernel variance alpha_k and length rho_k for each of four GPs =
Posterior values shown in Fig. A3 trace plots
assumptions (5)
- domain assumption Annual maxima follow a GEV distribution with a shape parameter constant across space and time.
- domain assumption The nonstationary signal is captured by a linear (in ln CO2) relationship for GEV location and scale parameters.
- domain assumption Annual maxima at different stations are independent conditional on the latent GP parameters.
- domain assumption The exponential covariance kernel adequately represents spatial dependence of GEV parameters.
- domain assumption GP mean fixed at zero is adequate.
Cite this review
Pith. "Pith review of Bayesian Spatiotemporal Nonstationary Model Quantifies Robust Increases in Daily Extreme Rainfall Across the Western Gulf Coast." pith.science (2026). https://pith.science/paper/Y7A3457I
@misc{pith2026250202000,
  author       = {Pith},
  title        = {Pith review of: Bayesian Spatiotemporal Nonstationary Model Quantifies Robust Increases in Daily Extreme Rainfall Across the Western Gulf Coast},
  year         = {2026},
  howpublished = {\url{https://pith.science/paper/Y7A3457I}},
  note         = {Machine review of arXiv:2502.02000}
}
read the original abstract
Precipitation exceedance probabilities are widely used in engineering design, risk assessment, and floodplain management. While common approaches like NOAA Atlas 14 assume that extreme precipitation characteristics are stationary over time, this assumption may underestimate current and future hazards due to anthropogenic climate change. However, the incorporation of nonstationarity in the statistical modeling of extreme precipitation has faced practical challenges that have restricted its applications. In particular, random sampling variability challenges the reliable estimation of trends and parameters, especially when observational records are limited. To address this methodological gap, we propose the Spatially Varying Covariates Model, a hierarchical Bayesian spatial framework that integrates nonstationarity and regionalization for robust frequency analysis of extreme precipitation. This model draws from extreme value theory, spatial statistics, and Bayesian statistics, and is validated through cross-validation and multiple performance metrics. Applying this framework to a case study of daily rainfall in the Western Gulf Coast, we identify robustly increasing trends in extreme precipitation intensity and variability throughout the study area, with notable spatial heterogeneity. This flexible model accommodates stations with varying observation records, yields smooth return level estimates, and can be straightforwardly adapted to the analysis of precipitation frequencies at different durations and for other regions.
Figures


Figures from the paper (6 more)




Reference graph
Works this paper leans on
-
[1]
Conditional diffusion models for downscaling & bias correction of Earth system model precipitation, April 2024
Michael Aich, Philipp Hess, Baoxiang Pan, Sebastian Bathiany, Yu Huang, and Niklas Boers. Conditional diffusion models for downscaling & bias correction of Earth system model precipitation, April 2024
2024
-
[2]
Improving the utility of weather radar for the spatial frequency analysis of extreme precipitation
Nehal Ansh Srivastava and Giuseppe Mascaro. Improving the utility of weather radar for the spatial frequency analysis of extreme precipitation. Journal of Hydrology, 624: 0 129902, September 2023. ISSN 0022-1694. doi:10.1016/j.jhydrol.2023.129902
arXiv 2023
-
[3]
Pragalathan Apputhurai and Alec G. Stephenson. Spatiotemporal hierarchical modelling of extreme precipitation in Western Australia using anisotropic Gaussian random fields. Environmental and Ecological Statistics, 20 0 (4): 0 667--677, December 2013. ISSN 1573-3009. doi:10.1007/s10651-013-0240-9
-
[4]
2015 Memorial Day Flood Impacts for Changing Watershed Conditions in Houston
Benjamin Bass, Andrew Juan, Avantika Gori, Zheng Fang, and Bedient Philip. 2015 Memorial Day Flood Impacts for Changing Watershed Conditions in Houston . Natural Hazards Review, 18 0 (3): 0 05016007, August 2017. doi:10.1061/(asce)nh.1527-6996.0000241
arXiv 2015
-
[5]
Sabrina Bentzien and Petra Friederichs. Decomposition and graphical portrayal of the quantile score: Quantile Score Decomposition and Portrayal . Quarterly Journal of the Royal Meteorological Society, 140 0 (683): 0 1924--1934, July 2014. ISSN 00359009. doi:10.1002/qj.2284
-
[6]
An introduction to multivariate probabilistic forecast evaluation
Mathias Blicher Bjerreg rd, Jan Kloppenborg M ller, and Henrik Madsen. An introduction to multivariate probabilistic forecast evaluation. Energy and AI, 4: 0 100058, June 2021. ISSN 2666-5468. doi:10.1016/j.egyai.2021.100058
arXiv 2021
-
[7]
J. Blanchet, D. Ceresetti, G. Molini \'e , and J.-D. Creutin. A regional GEV scale-invariant framework for Intensity -- Duration -- Frequency analysis. Journal of Hydrology, 540: 0 82--95, September 2016. ISSN 00221694. doi:10.1016/j.jhydrol.2016.06.007
-
[8]
Evaluating raw ensembles with the continuous ranked probability score
Jochen Br \"o cker. Evaluating raw ensembles with the continuous ranked probability score. Quarterly Journal of the Royal Meteorological Society, 138 0 (667): 0 1611--1617, July 2012. ISSN 0035-9009, 1477-870X. doi:10.1002/qj.1891
Show all 101 references
-
[9]
Donald H. Burn. Evaluation of regional flood frequency analysis with a region of influence approach. Water Resources Research, 26 0 (10): 0 2257--2265, 1990. ISSN 1944-7973. doi:10.1029/WR026i010p02257
1990 doi
-
[10]
Cannon, Stephen R
Alex J. Cannon, Stephen R. Sobie, and Trevor Q. Murdock. Bias Correction of GCM Precipitation by Quantile Mapping : How Well Do Methods Preserve Changes in Quantiles and Extremes ? September 2015. doi:10.1175/JCLI-D-14-00754.1
2015 doi
-
[11]
Stan: A probabilistic programming language
Bob Carpenter, Andrew Gelman, Matthew D Hoffman, Daniel Lee, Ben Goodrich, Michael Betancourt, Michael A Brubaker, Jiqiang Guo, Peter Li, and Allen Riddell. Stan: A probabilistic programming language. Journal Of Statistical Software, 76 0 (1): 0 1--29, January 2017. doi:10.186...
2017 doi
-
[12]
Practical strategies for generalized extreme value-based regression models for extremes
Daniela Castro-Camilo, Rapha \"e l Huser, and H vard Rue. Practical strategies for generalized extreme value-based regression models for extremes. Environmetrics, 33 0 (6): 0 e2742, September 2022. ISSN 1180-4009, 1099-095X. doi:10.1002/env.2742
2022 doi
-
[13]
Nonstationary precipitation intensity-duration-frequency curves for infrastructure design in a changing climate
Linyin Cheng and Amir AghaKouchak. Nonstationary precipitation intensity-duration-frequency curves for infrastructure design in a changing climate. Scientific Reports, 4 0 (1): 0 7093, November 2014. ISSN 2045-2322. doi:10.1038/srep07093
2014 doi
-
[14]
Assessing the relationships between elevation and extreme precipitation with various durations in southern Taiwan using spatial regression models
Hone-Jay Chu. Assessing the relationships between elevation and extreme precipitation with various durations in southern Taiwan using spatial regression models. Hydrological Processes, 26 0 (21): 0 3174--3181, October 2012. ISSN 0885-6087, 1099-1085. doi:10.1002/hyp.8403
2012 doi
-
[15]
An Introduction to Statistical Modeling of Extreme Values
Stuart Coles. An Introduction to Statistical Modeling of Extreme Values. Springer Series in Statistics. Springer, London ;, 2001. ISBN 1-85233-459-2
2001
-
[16]
Cook, Seth McGinnis, and Constantine Samaras
Lauren M. Cook, Seth McGinnis, and Constantine Samaras. The effect of modeling choices on updating intensity-duration-frequency curves and stormwater infrastructure designs for climate change. Climatic Change, 159 0 (2): 0 289--308, March 2020. ISSN 1573-1480. doi:10.1007/s105...
2020 doi
-
[17]
Daniel Cooley and Stephan R. Sain. Spatial hierarchical modeling of precipitation extremes from a regional climate model. Journal of Agricultural, Biological, and Environmental Statistics, 15 0 (3): 0 381--402, September 2010. ISSN 1537-2693. doi:10.1007/s13253-010-0023-9
2010 doi
-
[18]
Bayesian spatial modeling of extreme precipitation return levels
Daniel Cooley, Douglas Nychka, and Philippe Naveau. Bayesian spatial modeling of extreme precipitation return levels. Journal of the American Statistical Association, 102 0 (479): 0 824--840, September 2007. ISSN 0162-1459. doi:10.1198/016214506000000780
2007 doi
-
[19]
Noel A. C. Cressie and Christopher K. Wikle. Statistics for Spatio-Temporal Data. Wiley, Hoboken, N.J., 2011. ISBN 978-0-471-69274-4
2011
-
[20]
A. C. Davison, S. A. Padoan, and M. Ribatet. Statistical Modeling of Spatial Extremes . Statistical Science, 27 0 (2), May 2012. ISSN 0883-4237. doi:10.1214/11-STS376
2012 doi
-
[21]
Managing uncertainty in flood protection planning with climate projections
Beatrice Dittes, Olga S pa c kov \'a , Lukas Schoppa, and Daniel Straub. Managing uncertainty in flood protection planning with climate projections. Hydrology and Earth System Sciences, 22 0 (4): 0 2511--2526, 2018. doi:10.5194/hess-22-2511-2018
2018 doi
-
[22]
Donat, Andrew L
Markus G. Donat, Andrew L. Lowry, Lisa V. Alexander, Paul A. O'Gorman, and Nicola Maher. More extreme precipitation in the world's dry and wet regions. Nature Climate Change, 6 0 (5): 0 508--513, May 2016. ISSN 1758-6798. doi:10.1038/nclimate2941
2016 doi
-
[23]
Farnham, Scott Steinschneider, and Upmanu Lall
James Doss-Gollin , David J. Farnham, Scott Steinschneider, and Upmanu Lall. Robust adaptation to multiscale climate variability. Earth's Future, 7 0 (7): 0 734--747, June 2019. ISSN 2328-4277. doi:10.1029/2019ef001154
2019 doi
-
[24]
Thorarinsdottir, and Frode Stordal
Anita Verpe Dyrrdal, Alex Lenkoski, Thordis L. Thorarinsdottir, and Frode Stordal. Bayesian hierarchical modeling of extreme hourly precipitation in Norway . Environmetrics, 26 0 (2): 0 89--106, 2015. ISSN 1099-095X. doi:10.1002/env.2301
2015 doi
-
[25]
Should we apply bias correction to global and regional climate model data? Hydrology and Earth System Sciences, 16 0 (9): 0 3391--3404, 2012
U Ehret, E Zehe, V Wulfmeyer, K Warrach-Sagi , and J Liebert. Should we apply bias correction to global and regional climate model data? Hydrology and Earth System Sciences, 16 0 (9): 0 3391--3404, 2012. doi:10.5194/hess-16-3391-2012
2012 doi
-
[26]
Bedient, and Katherine B
Carlynn Fagnant, Avantika Gori, Antonia Sebastian, Philip B. Bedient, and Katherine B. Ensor. Characterizing spatiotemporal trends in extreme precipitation in Southeast Texas . Natural Hazards, 104 0 (2): 0 1597--1621, November 2020. ISSN 1573-0840. doi:10.1007/s11069-020-04235-x
2020 doi
-
[27]
Regional extreme precipitation events: Robust inference from credibly simulated GCM variables
David J Farnham, James Doss-Gollin , and Upmanu Lall. Regional extreme precipitation events: Robust inference from credibly simulated GCM variables. Water Resources Research, 54 0 (6), 2018. doi:10.1002/2017wr021318
2018 doi
-
[28]
Do CMIP5 models show El Ni \ n o diversity? Journal of Climate, November 2019
Jie Feng, Tao Lian, Jun Ying, Junde Li, and Gen Li. Do CMIP5 models show El Ni \ n o diversity? Journal of Climate, November 2019. ISSN 0894-8755. doi:10.1175/jcli-d-18-0854.1
2019 doi
-
[29]
H. J. Fowler and C. G. Kilsby. A regional frequency analysis of United Kingdom extreme rainfall from 1961 to 2000. International Journal of Climatology, 23 0 (11): 0 1313--1334, 2003. ISSN 1097-0088. doi:10.1002/joc.943
1961 doi
-
[30]
A deep learning-based framework for multi-source precipitation fusion
Keyhan Gavahi, Ehsan Foroumandi, and Hamid Moradkhani. A deep learning-based framework for multi-source precipitation fusion. Remote Sensing of Environment, 295: 0 113723, September 2023. ISSN 0034-4257. doi:10.1016/j.rse.2023.113723
2023
-
[31]
Gelfand, Sudipto Banerjee, and Dani Gamerman
Alan E. Gelfand, Sudipto Banerjee, and Dani Gamerman. Spatial process modelling for univariate and multivariate dynamic spatial data. Environmetrics, 16 0 (5): 0 465--479, August 2005. ISSN 1180-4009, 1099-095X. doi:10.1002/env.715
2005 doi
-
[32]
Bayesian Data Analysis
Andrew Gelman, John B Carlin, Hal S Stern, and Donald B Rubin. Bayesian Data Analysis . Chapman & Hall/CRC Boca Raton, FL, USA, 3 edition, 2014
2014
-
[33]
Margossian, Bob Carpenter, Yuling Yao, Lauren Kennedy, Jonah Gabry, Paul-Christian B \"u rkner, and Martin Modr \'a k
Andrew Gelman, Aki Vehtari, Daniel Simpson, Charles C. Margossian, Bob Carpenter, Yuling Yao, Lauren Kennedy, Jonah Gabry, Paul-Christian B \"u rkner, and Martin Modr \'a k. Bayesian workflow. arXiv:2011.01808 [stat], November 2020. doi:10.48550/arXiv.2011.01808
-
[34]
Goovaerts
P. Goovaerts. Geostatistical approaches for incorporating elevation into the spatial interpolation of rainfall. Journal of Hydrology, 228 0 (1): 0 113--129, February 2000. ISSN 0022-1694. doi:10.1016/S0022-1694(00)00144-X
-
[35]
Nerantzaki, and Simon Michael Papalexiou
Xuezhi Gu, Lei Ye, Qian Xin, Chi Zhang, Fanzhang Zeng, Sofia D. Nerantzaki, and Simon Michael Papalexiou. Extreme Precipitation in China : A Review on Statistical Methods and Applications . Advances in Water Resources, 163: 0 104144, May 2022. ISSN 03091708. doi:10.1016/j.advw...
2022
-
[36]
Modeling Intensity - Duration - Frequency Curves for the Whole Range of Non - Zero Precipitation : A Comparison of Models
Abubakar Haruna, Juliette Blanchet, and Anne-Catherine Favre. Modeling Intensity - Duration - Frequency Curves for the Whole Range of Non - Zero Precipitation : A Comparison of Models . Water Resources Research, 59 0 (6): 0 e2022WR033362, June 2023. ISSN 0043-1397, 1944-7973. ...
2023 doi
-
[37]
J. R. M. Hosking. L- Moments : Analysis and Estimation of Distributions Using Linear Combinations of Order Statistics . Journal of the Royal Statistical Society. Series B (Methodological), 52 0 (1): 0 105--124, 1990. ISSN 0035-9246
1990
-
[38]
J. R. M. Hosking. Regional Frequency Analysis: An Approach Based on L-moments / J . R . M . Hosking and J . R . Wallis . Cambridge University Press, Cambridge, United Kingdom, 1997. ISBN 978-0-521-43045-6
1997
-
[39]
Elevation- Dependent Trends in Precipitation Observed over and around the Tibetan Plateau from 1971 to 2017
Wenfeng Hu, Junqiang Yao, Qing He, and Jing Chen. Elevation- Dependent Trends in Precipitation Observed over and around the Tibetan Plateau from 1971 to 2017. Water, 13 0 (20): 0 2848, October 2021. ISSN 2073-4441. doi:10.3390/w13202848
1971 doi
-
[40]
Jorgensen and John W
Savannah K. Jorgensen and John W. Nielsen-Gammon . Nonstationarity in Extreme Precipitation Return Values Along the United States Gulf and Southeastern Coasts . Journal of Hydrometeorology, -1 0 (aop), March 2024. ISSN 1525-7541, 1525-755X. doi:10.1175/JHM-D-22-0157.1
2024 doi
-
[41]
R. W. Kates, C. E. Colten, S. Laska, and S. P. Leatherman. Reconstruction of New Orleans after Hurricane Katrina : A research perspective. Proceedings of the National Academy of Sciences, 103 0 (40): 0 14653--14660, October 2006. doi:10.1073/pnas.0605726103
2006 doi
-
[42]
Statistics of extremes in hydrology
R W Katz, M B Parlange, and P Naveau. Statistics of extremes in hydrology. Advances in Water Resources, 25 0 (8-12): 0 1287--1304, 2002. doi:10.1016/s0309-1708(02)00056-8
2002 doi
-
[43]
Keeling, Robert B
Charles D. Keeling, Robert B. Bacastow, Arnold E. Bainbridge, Carl A. Ekdahl, Peter R. Guenther, Lee S. Waterman, and John F. S. Chin. Atmospheric carbon dioxide variations at Mauna Loa Observatory , Hawaii . Tellus A: Dynamic Meteorology and Oceanography, 28 0 (6): 0 538, Jan...
1976 doi
-
[44]
Roger Koenker and Jos \'e A. F. Machado. Goodness of Fit and Related Inference Processes for Quantile Regression . Journal of the American Statistical Association, 94 0 (448): 0 1296--1310, December 1999. ISSN 0162-1459. doi:10.1080/01621459.1999.10473882
1999
-
[45]
Kourtis and Vassilios A
Ioannis M. Kourtis and Vassilios A. Tsihrintzis. Update of intensity-duration-frequency ( IDF ) curves under climate change: A review. Water Supply, 22 0 (5): 0 4951--4974, March 2022. ISSN 1606-9749. doi:10.2166/ws.2022.152
2022 doi
-
[46]
Lafferty and Ryan L
David C. Lafferty and Ryan L. Sriver. Downscaling and bias-correction contribute considerable uncertainty to local climate projections in CMIP6 . npj Climate and Atmospheric Science, 6 0 (1): 0 1--13, September 2023. ISSN 2397-3722. doi:10.1038/s41612-023-00486-0
2023 doi
-
[47]
Mccabe, and Roger S
Upmanu Lall, Thomas Johnson, Peter Colohan, Amir Aghakouchak, Sankar Arumugam, Casey Brown, Gregory J. Mccabe, and Roger S. Pulwarty. Chapter 3: Water . U.S. Global Change Research Program, Washington, D.C., 2018. doi:10.7930/NCA4.2018.CH3
2018 doi
-
[48]
PICAR : An Efficient Extendable Approach for Fitting Hierarchical Spatial Models
Ben Seiyon Lee and Murali Haran. PICAR : An Efficient Extendable Approach for Fitting Hierarchical Spatial Models . Technometrics, 64 0 (2): 0 187--198, April 2022. ISSN 0040-1706, 1537-2723. doi:10.1080/00401706.2021.1933596
2022
-
[49]
A hierarchical Bayesian GEV model for improving local and regional flood quantile estimates
Carlos H R Lima, Upmanu Lall, Tara Troy, and Naresh Devineni. A hierarchical Bayesian GEV model for improving local and regional flood quantile estimates. Journal of Hydrology, 541: 0 816--823, October 2016. doi:10.1016/j.jhydrol.2016.07.042
2016 doi
-
[50]
Temporal and spatial evaluation of stormwater engineering standards reveals risks and priorities across the United States
Tania Lopez-Cantu and Constantine Samaras. Temporal and spatial evaluation of stormwater engineering standards reveals risks and priorities across the United States . Environmental Research Letters, 13 0 (7), June 2018. ISSN 1748-9326. doi:10.1088/1748-9326/aac696
2018 doi
-
[51]
On the Influences of Urbanization on the Extreme Rainfall over Zhengzhou on 20 July 2021: A Convection-Permitting Ensemble Modeling Study
Yali Luo, Jiahua Zhang, Miao Yu, Xudong Liang, Rudi Xia, Yanyu Gao, Xiaoyu Gao, and Jinfang Yin. On the Influences of Urbanization on the Extreme Rainfall over Zhengzhou on 20 July 2021: A Convection-Permitting Ensemble Modeling Study . Advances in Atmospheric Sciences, 40 0 (...
2021 doi
-
[52]
Pielke, Kenneth G
Rezaul Mahmood, Roger A. Pielke, Kenneth G. Hubbard, Dev Niyogi, Paul A. Dirmeyer, Clive McAlpine, Andrew M. Carleton, Robert Hale, Samuel Gameda, Adriana Beltr \'a n-Przekurat, Bruce Baker, Richard McNider, David R. Legates, Marshall Shepherd, Jinyang Du, Peter D. Blanken, Ol...
2014
-
[53]
Brissette, Philippe Lucas-Picher , Magali Troin, and Richard Arsenault
Jean-Luc Martel, Fran c ois P. Brissette, Philippe Lucas-Picher , Magali Troin, and Richard Arsenault. Climate Change and Rainfall Intensity -- Duration -- Frequency Curves : Overview of Science and Guidelines for Adaptation . Journal of Hydrologic Engineering, 26 0 (10): 0 03...
2021
-
[54]
Martins and Jery R
Eduardo S. Martins and Jery R. Stedinger. Generalized maximum-likelihood generalized extreme-value quantile estimators for hydrologic data. Water Resources Research, 36 0 (3): 0 737--744, 2000. ISSN 1944-7973. doi:10.1029/1999WR900330
-
[55]
u nter Bl \
Bruno Merz, Jeroen C J H Aerts, Karsten Arnbjerg-Nielsen , M Baldi, A Becker, A Bichet, G \"u nter Bl \"o schl, Laurens M Bouwer, Achim Brauer, F Cioffi, J M Delgado, M Gocht, F Guzzetti, S Harrigan, K Hirschboeck, C Kilsby, W Kron, H H Kwon, Upmanu Lall, R Merz, K Nissen, P S...
1921
-
[56]
Stationarity is dead: Whither water management? Science, 319 0 (5863): 0 573--574, February 2008
P C D Milly, Julio Betancourt, M Falkenmark, R M Hirsch, Z W Kundzewicz, D P Lettenmaier, and R J Stouffer. Stationarity is dead: Whither water management? Science, 319 0 (5863): 0 573--574, February 2008. doi:10.1126/science.1151915
2008 doi
-
[57]
Estimation of Daily Rainfall Extremes Through the Metastatistical Extreme Value Distribution : Uncertainty Minimization and Implications for Trend Detection
Arianna Miniussi and Marco Marani. Estimation of Daily Rainfall Extremes Through the Metastatistical Extreme Value Distribution : Uncertainty Minimization and Implications for Trend Detection . Water Resources Research, 56 0 (7): 0 e2019WR026535, 2020. ISSN 1944-7973. doi:10.1...
2020 doi
-
[58]
Mishra and Vijay P
Ashok K. Mishra and Vijay P. Singh. Changes in extreme precipitation in Texas . Journal of Geophysical Research: Atmospheres, 115 0 (D14): 0 2009JD013398, July 2010. ISSN 0148-0227. doi:10.1029/2009JD013398
2010 doi
-
[59]
Moftakhari, Amir AghaKouchak, Brett F
Hamed R. Moftakhari, Amir AghaKouchak, Brett F. Sanders, Maura Allaire, and Richard A. Matthew. What Is Nuisance Flooding ? Defining and Monitoring an Emerging Challenge . Water Resources Research, 54 0 (7): 0 4218--4227, 2018. ISSN 1944-7973. doi:10.1029/2018WR022828
2018 doi
-
[60]
Modeling and mitigating natural hazards: Stationarity is immortal! Water Resources Research, 50 0 (12): 0 9748--9756, December 2014
Alberto Montanari and Demetris Koutsoyiannis. Modeling and mitigating natural hazards: Stationarity is immortal! Water Resources Research, 50 0 (12): 0 9748--9756, December 2014. doi:10.1002/2014wr016092
2014 doi
-
[61]
Nielsen-Gammon
John W. Nielsen-Gammon . Observation-based estimates of present-day and future climate change impacts on heavy rainfall in Harris County . Technical report, June 2020
2020
-
[62]
Precipitation extremes under climate change
Paul A O'Gorman. Precipitation extremes under climate change. Current Climate Change Reports, 1 0 (2): 0 49--59, April 2015. doi:10.1007/s40641-015-0009-3
2015 doi
-
[63]
Spatial-temporal multivariate semi- Bayesian hierarchical framework for extreme precipitation frequency analysis
\'A lvaro Ossand \'o n, Balaji Rajagopalan, and William Kleiber. Spatial-temporal multivariate semi- Bayesian hierarchical framework for extreme precipitation frequency analysis. Journal of Hydrology, 600: 0 126499, September 2021. ISSN 0022-1694. doi:10.1016/j.jhydrol.2021.126499
2021
-
[64]
Pendergrass, Reto Knutti, Flavio Lehner, Clara Deser, and Benjamin M
Angeline G. Pendergrass, Reto Knutti, Flavio Lehner, Clara Deser, and Benjamin M. Sanderson. Precipitation variability increases in a warmer climate. Scientific Reports, 7 0 (1): 0 1--9, December 2017. ISSN 2045-2322. doi:10.1038/s41598-017-17966-y
2017 doi
-
[65]
Laurent, Carl Trypaluk, Dale Unruh, Michael Yekta, and Geoffrey Bonnin
Sanja Perica, Deborah Martin, Sandra Pavlovic, Ishani Roy, Michael St. Laurent, Carl Trypaluk, Dale Unruh, Michael Yekta, and Geoffrey Bonnin. NOAA Atlas 14. Technical Report Volume 9 Version 2.0: Southeastern States (Alabama, Arkansas, Florida, Georgia, Louisiana, Mississippi...
2013
-
[66]
Laurent, Carl Trypaluk, Dale Unruh, and Orlan Wilhite
Sanja Perica, Sandra Pavlovic, Michael St. Laurent, Carl Trypaluk, Dale Unruh, and Orlan Wilhite. NOAA Atlas 14. Technical Report Volume 11 Version 2.0: Texas, National Weather Service, National Oceanic and Atmospheric Administration, U.S. Department of Commerce , Silver Sprin...
2018
-
[67]
R. A. Pielke Sr., J. Adegoke, A. Beltr \'a n-Przekurat , C. A. Hiemstra, J. Lin, U. S. Nair, D. Niyogi, and T. E. Nobis. An overview of regional land-use and land-cover impacts on rainfall. Tellus B: Chemical and Physical Meteorology, 59 0 (3): 0 587, January 2007. ISSN 1600-0...
2007
-
[68]
A generalized framework for process-informed nonstationary extreme value analysis
Elisa Ragno, Amir AghaKouchak, Linyin Cheng, and Mojtaba Sadegh. A generalized framework for process-informed nonstationary extreme value analysis. Advances in Water Resources, 130: 0 270--282, August 2019. ISSN 0309-1708. doi:10.1016/j.advwatres.2019.06.007
2019 doi
-
[69]
J. O. Ramsay and B. W. Silverman. Functional Data Analysis . Springer Series in Statistics . Springer New York, New York, NY, second edition edition, 2005. ISBN 978-0-387-40080-8. doi:10.1007/b98888
2005 doi
-
[70]
Gaussian Processes for Machine Learning
Carl Edward Rasmussen and Chris K I Williams. Gaussian Processes for Machine Learning . the MIT Press, 2006. ISBN 0-262-18253-X
2006
-
[71]
Risser and Michael F
Mark D. Risser and Michael F. Wehner. Attributable Human - Induced Changes in the Likelihood and Magnitude of the Observed Extreme Precipitation during Hurricane Harvey . Geophysical Research Letters, 44 0 (24), December 2017. ISSN 0094-8276, 1944-8007. doi:10.1002/2017GL075888
2017 doi
-
[72]
Rosenzweig, Lauren McPhillips, Heejun Chang, Chingwen Cheng, Claire Welty, Marissa Matsler, David Iwaniec, and Cliff I
Bernice R. Rosenzweig, Lauren McPhillips, Heejun Chang, Chingwen Cheng, Claire Welty, Marissa Matsler, David Iwaniec, and Cliff I. Davidson. Pluvial flood risk and opportunities for resilience. WIREs Water, 5 0 (6), November 2018. ISSN 2049-1948, 2049-1948. doi:10.1002/wat2.1302
2018 doi
-
[73]
Law Dome Ice Core 2000- Year CO2 , CH4 , N2O and d13C-CO2 , 2019
Mauro Rubino, David Etheridge, David Thornton, Colin Allison, Roger Francey, Ray Langenfelds, Paul Steele, Cathy Trudinger, Darren Spencer, Mark Curran, Tas Van Ommen, and Andrew Smith. Law Dome Ice Core 2000- Year CO2 , CH4 , N2O and d13C-CO2 , 2019
2000
-
[74]
Russell, Mark D
Brook T. Russell, Mark D. Risser, Richard L. Smith, and Kenneth E. Kunkel. Investigating the association between late spring Gulf of Mexico sea surface temperatures and U . S . Gulf Coast precipitation extremes with focus on Hurricane Harvey . Environmetrics, 31 0 (2): 0 e2595...
2020 doi
-
[75]
Techniques for assessing water infrastructure for nonstationary extreme events: A review
J D Salas, J Obeysekera, and R M Vogel. Techniques for assessing water infrastructure for nonstationary extreme events: A review. Hydrological Sciences Journal, 63 0 (3): 0 325--352, 2018. doi:10.1080/02626667.2018.1426858
2018
-
[76]
Schlef, Kenneth E
Katherine E. Schlef, Kenneth E. Kunkel, Casey Brown, Yonas Demissie, Dennis P. Lettenmaier, Anna Wagner, Mark S. Wigmosta, Thomas R. Karl, David R. Easterling, Kimberly J. Wang, Baptiste Fran c ois, and Eugene Yan. Incorporating non-stationarity from climate change into rainfa...
2023
-
[77]
Schmidt and Alan E
Alexandra M. Schmidt and Alan E. Gelfand. A Bayesian coregionalization approach for multivariate pollutant data. Journal of Geophysical Research: Atmospheres, 108 0 (D24): 0 2002JD002905, December 2003. ISSN 0148-0227. doi:10.1029/2002JD002905
2003 doi
-
[78]
Axiomatic Characterization of the Quadratic Scoring Rule
Reinhard Selten. Axiomatic Characterization of the Quadratic Scoring Rule . Experimental Economics, 1 0 (1): 0 43--61, June 1998. ISSN 1573-6938. doi:10.1023/A:1009957816843
1998 doi
-
[79]
Seneviratne, X
S.I. Seneviratne, X. Zhang, M. Adnan, W. Badi, C. Dereczynski, A. Di Luca, S. Ghosh, I. Iskandar, J. Kossin, S. Lewis, F. Otto, I. Pinto, M. Satoh, S.M. Vicente-Serrano , M. Wehner, and B. Zhou. Weather and climate extreme events in a changing climate. In V. Masson-Delmotte , ...
2021
-
[80]
Stationarity is undead: Uncertainty dominates the distribution of extremes
Francesco Serinaldi and Chris G Kilsby. Stationarity is undead: Uncertainty dominates the distribution of extremes. Advances in Water Resources, 77: 0 17--36, March 2015. doi:10.1016/j.advwatres.2014.12.013
2015 doi
-
[81]
Nicholas, and Klaus Keller
Sanjib Sharma, Ben Seiyon Lee, Robert E. Nicholas, and Klaus Keller. A Safety Factor Approach to Designing Urban Infrastructure for Dynamic Conditions . Earth's Future, 9 0 (12): 0 e2021EF002118, 2021. ISSN 2328-4277. doi:10.1029/2021EF002118
2021 doi
-
[82]
Simonovic, Andre Schardong, and Joel Avruch Goldenfum
Daniele Feitoza Silva, Slobodan P. Simonovic, Andre Schardong, and Joel Avruch Goldenfum. Assessment of non-stationary IDF curves under a changing climate: Case study of different climatic zones in Canada . Journal of Hydrology: Regional Studies, 36: 0 100870, August 2021. ISS...
2021
-
[83]
Sobel, Chia-Ying Lee, Steven G
Adam H. Sobel, Chia-Ying Lee, Steven G. Bowen, Suzana J. Camargo, Mark A. Cane, Amy Clement, Boniface Fosu, Megan Hart, Kevin A. Reed, Richard Seager, and Michael K. Tippett. Near-term tropical cyclone risk and coupled Earth system model biases. Proceedings of the National Aca...
2023 doi
-
[84]
Nonstationary bayesian modeling of precipitation extremes in the Beijing-Tianjin-Hebei Region , China
Xiaomeng Song, Xianju Zou, Yuchen Mo, Jianyun Zhang, Chunhua Zhang, and Yimin Tian. Nonstationary bayesian modeling of precipitation extremes in the Beijing-Tianjin-Hebei Region , China . Atmospheric Research, 242: 0 105006, September 2020. ISSN 0169-8095. doi:10.1016/j.atmosr...
2020
-
[85]
Stan User's Guide
Stan Development Team . Stan User's Guide. Version 2.30 edition, 2022
2022
-
[86]
Statkewicz, Robert Talbot, and Bernhard Rappenglueck
Madeline D. Statkewicz, Robert Talbot, and Bernhard Rappenglueck. Changes in precipitation patterns in Houston , Texas . Environmental Advances, 5: 0 100073, October 2021. ISSN 2666-7657. doi:10.1016/j.envadv.2021.100073
2021
-
[87]
Stedinger
Jery R. Stedinger. Expected probability and annual damage estimators. Journal of Water Resources Planning and Management, 123 0 (2): 0 125--135, March 1997. ISSN 0733-9496. doi:10.1061/(ASCE)0733-9496(1997)123:2(125)
1997 doi
-
[88]
Stephenson, Eric A
Alec G. Stephenson, Eric A. Lehmann, and Aloke Phatak. A max-stable process model for rainfall extremes at different accumulation durations. Weather and Climate Extremes, 13: 0 44--53, September 2016. ISSN 22120947. doi:10.1016/j.wace.2016.07.002
2016 doi
-
[89]
Global scale assessment of urban precipitation anomalies
Xinxin Sui, Zong-Liang Yang, Marshall Shepherd, and Dev Niyogi. Global scale assessment of urban precipitation anomalies. Proceedings of the National Academy of Sciences, 121 0 (38): 0 e2311496121, September 2024. doi:10.1073/pnas.2311496121
2024 doi
-
[90]
Primary characteristics of the extreme heavy rainfall event over Henan in July 2021
Jianhua Sun, Shenming Fu, Huijie Wang, Yuanchun Zhang, Yun Chen, Aifang Su, Yaqiang Wang, Huan Tang, and Ruoyun Ma. Primary characteristics of the extreme heavy rainfall event over Henan in July 2021. Atmospheric Science Letters, 24 0 (1): 0 e1131, 2023. ISSN 1530-261X. doi:10...
2021 doi
-
[91]
Alexander
Qiaohong Sun, Xuebin Zhang, Francis Zwiers, Seth Westra, and Lisa V. Alexander. A Global , Continental , and Regional Analysis of Changes in Extreme Precipitation . Journal of Climate, 34 0 (1): 0 243--258, January 2021. ISSN 0894-8755, 1520-0442. doi:10.1175/JCLI-D-19-0892.1
2021 doi
-
[92]
Spatio-temporal variability of extreme precipitation in Nepal
Rocky Talchabhadel, Ramchandra Karki, Bhesh Raj Thapa, Manisha Maharjan, and Binod Parajuli. Spatio-temporal variability of extreme precipitation in Nepal . International Journal of Climatology, 38 0 (11): 0 4296--4313, September 2018. ISSN 0899-8418, 1097-0088. doi:10.1002/joc.5669
2018 doi
-
[93]
Marco Tedesco, Steven McAlpine, and Jeremy R. Porter. Exposure of real estate properties to the 2018 Hurricane Florence flooding. Natural Hazards and Earth System Sciences, 20 0 (3): 0 907--920, April 2020. ISSN 1561-8633. doi:10.5194/nhess-20-907-2020
2018 doi
-
[94]
Guidance for flood risk analysis and mapping: Hydrology rainfall-runoff analysis
The Federal Emergency Management Agency . Guidance for flood risk analysis and mapping: Hydrology rainfall-runoff analysis. Guidance Document 91, 2019
2019
-
[95]
Thiemann, M
M. Thiemann, M. Trosset, H. Gupta, and S. Sorooshian. Bayesian recursive parameter estimation for hydrologic models. Water Resources Research, 37 0 (10): 0 2521--2535, 2001. ISSN 1944-7973. doi:10.1029/2000WR900405
2001 doi
-
[96]
Jurado, Madlen Peter, Marc Scheibel, and Henning W
Jana Ulrich, Oscar E. Jurado, Madlen Peter, Marc Scheibel, and Henning W. Rust. Estimating IDF Curves Consistently over Durations with Spatial Covariates . Water, 12 0 (11): 0 3119, November 2020. ISSN 2073-4441. doi:10.3390/w12113119
2020 doi
-
[97]
Kapnick, Geert Jan van Oldenborgh , Kirien Whan, Sjoukje Philip, Gabriel A
Karin van der Wiel , Sarah B. Kapnick, Geert Jan van Oldenborgh , Kirien Whan, Sjoukje Philip, Gabriel A. Vecchi, Roop K. Singh, Julie Arrighi, and Heidi Cullen. Rapid attribution of the August 2016 flood-inducing extreme precipitation in south Louisiana to climate change. Hyd...
2016 doi
-
[98]
Attribution of extreme rainfall from Hurricane Harvey , August 2017
Geert Jan van Oldenborgh, Karin van der Wiel, Antonia Sebastian, Roop Singh, Julie Arrighi, Friederike Otto, Karsten Haustein, Sihan Li, Gabriel Vecchi, and Heidi Cullen. Attribution of extreme rainfall from Hurricane Harvey , August 2017. Environmental Research Letters, 12 0 ...
2017 doi
-
[99]
Christopher K. Wikle. Comparison of Deep Neural Networks and Deep Hierarchical Models for Spatio-Temporal Data . arXiv:1902.08321 [cs, stat], February 2019
1902 arXiv
-
[100]
Wright, Guo Yu, and John F
Daniel B. Wright, Guo Yu, and John F. England. Six decades of rainfall and flood frequency analysis using stochastic storm transposition: Review , progress, and prospects. Journal of Hydrology, 585: 0 124816, June 2020. ISSN 0022-1694. doi:10.1016/j.jhydrol.2020.124816
2020
-
[101]
Vecchi, and James A
Wei Zhang, Gabriele Villarini, Gabriel A. Vecchi, and James A. Smith. Urbanization exacerbated the rainfall and flooding caused by hurricane Harvey in Houston . Nature, 563 0 (7731): 0 384--388, November 2018. ISSN 1476-4687. doi:10.1038/s41586-018-0676-z
2018 doi
Reviewed August 9, 2026 · model on record in the stance chip above.
Discussion (0). Continue with ORCID to comment.