REVIEW 4 major objections 4 minor 59 references
Atlas of AI Risks: Enhancing Public Understanding of AI Risks
T0 review · 4 major / 4 minor · reviewed 2026-08-08 · deepseek-v4-flash
Pith's one-line read A narrative map of AI risks can help non-experts weigh facial recognition's benefits against its harms, the paper reports.
desk verdict A genuinely useful HCI contribution whose headline comparative claim is partly an artifact of the baseline design, but it deserves peer review. read the letter →
The pith
A machine-rendered reading of the paper's core claim, the machinery that carries it, and where it could break.
The reading
What carries the argument
The load-bearing mechanism is the pairing of six crowdsourced design requirements (multiple uses, balanced assessment, structured uses, reduced complexity, broad appeal, engaging exploration) with a concrete visualization grammar: sentence embeddings and t-SNE place uses on a map; a Martini Glass narrative structure with progressive disclosure reveals complexity in stages; colour coding marks daily versus non-daily uses and risk categories; and impact assessment cards provide both a tooltip and a detailed profile. These components together are what the paper credits for making risk information approachable and for the measured usability and balance advantages.
What would settle it
Run the same user study with a control dashboard that presents the identical 138 uses, risks, benefits, and mitigations in a conventional expert-dashboard layout; if users rate the two tools equally on balanced assessment and usability, the Atlas's reported advantage comes from its content, not from its map-narrative design.
Extended reading notes
Core claim
On the paper's own terms, the central discovery is that a map-atlas metaphor with narrative sections and progressive disclosure can communicate broad AI risk information to people who are not AI experts. Each technology use is one dot on a two-dimensional map, positioned by semantic similarity; users can split dots by risk level, read brief tooltips or detailed profiles, and follow a five-section Martini Glass story that moves from what facial recognition is, to daily uses, to risk categories, to common harms, to a mitigation dashboard. The paper reports that 53% of participants using the Atlas said it helped them understand both risks and benefits, against 32% for the baseline; the Atlas's System Usability Scale score was 68 versus 50; and it scored higher on classic aesthetics, expressive aesthetics, and pleasurable interaction. The authors also extended the same five-component use format to 379 AI uses derived from incident reports to show the tool is not limited to facial recognition.
Load-bearing premise
The load-bearing premise is that the baseline dashboard is a fair representative of existing expert-oriented AI risk visualization, because the baseline differed from the Atlas on exactly the dimensions the study then measured: balance of risks and benefits, reduced complexity, and broad appeal.
Editorial extensions
If this is right
- If the Atlas's advantage is real, a non-expert can weigh trade-offs of facial recognition without first becoming an AI specialist, which is what the paper aimed to enable.
- The same design could be populated from existing incident records: the authors show that the five-component format covers 379 AI uses drawn from a database of 649 incident reports, so the tool can shift from a facial-recognition case study to a general AI risk atlas.
- Regulators and municipalities could embed the atlas format into public AI registers, consumer AI databases, and classroom materials, the three deployment scenarios the paper proposes.
- Because SUS scores stayed similar across self-reported low, average, and high technological knowledge, the tool's usability appears not to depend on technical background, a direct corollary of the study's reported results.
Reading between the lines
- If the advantage is causal rather than content-driven, the same narrative atlas pattern could be tried for other contested technologies such as generative media, autonomous vehicles, and workplace surveillance, using the same five-component use format and a similar evaluation.
- A sharper test would give the control dashboard the Atlas's own content and balanced framing, so only the visual narrative differs; the paper's comparison does not isolate the narrative design from the richer content it generated.
- The shorter task-completion time for Atlas users (about 6.5 minutes versus 10.3 for the baseline) hints that the tool may increase comprehension efficiency, but the paper labels this as longer exploration, so the interpretation is ambiguous and worth re-measuring with explicit engagement metrics.
- The design pattern suggests a possible plain-language AI risk label standard, in which every high-risk AI use carries an atlas-style card that separates purpose, capability, user, subject, and domain; that is an extension the paper gestures toward but does not develop.
Editorial analysis
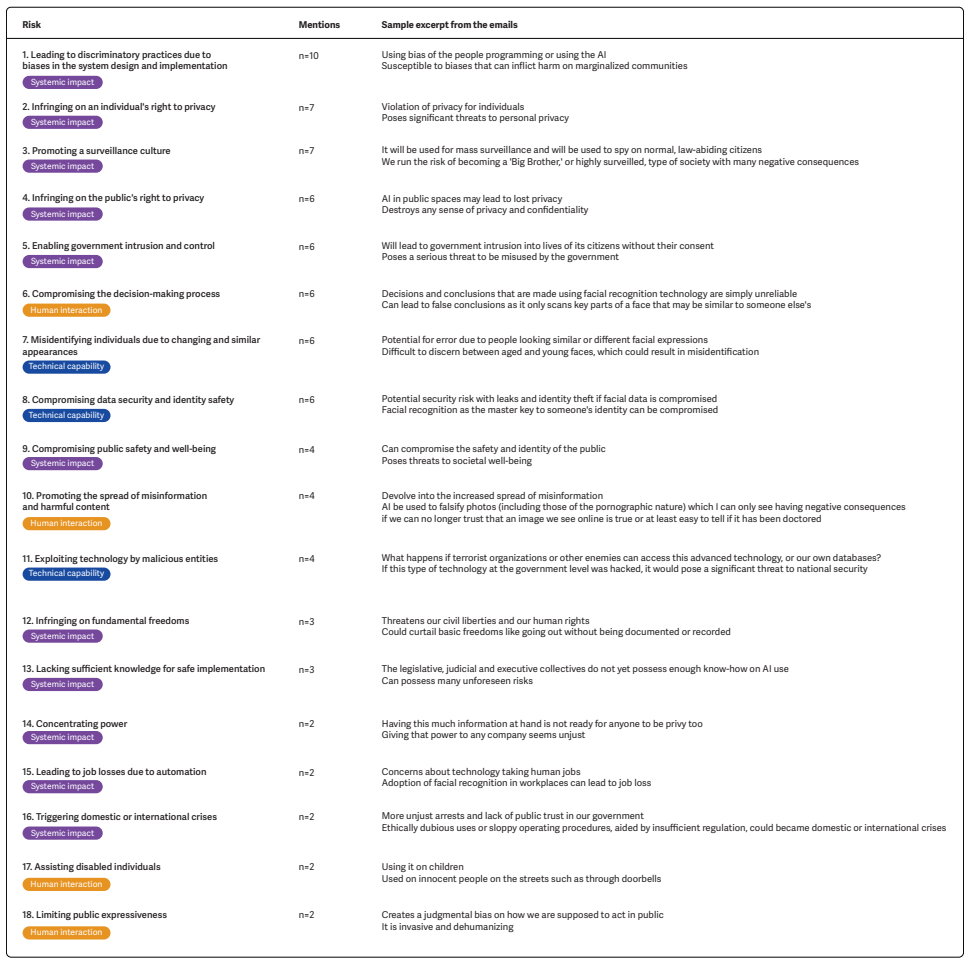
A structured set of objections, weighed in public.
Referee Report
Summary. The paper introduces the Atlas of AI Risks, a narrative-style interactive visualization that maps uses of facial-recognition technology together with risks, benefits, and mitigations, aimed at non-experts. The authors first run a 40-participant crowdsourced formative study to derive six design requirements (R1-R6), then use LLM and generative-image prompts to create 138 uses and associated content, and then build the Atlas using the requirements. A second study with 140 US-demographic-matched participants compares the Atlas with a custom-built baseline that mimics an AI Incident Database spatial view, using the System Usability Scale, perceived visual aesthetics scales, a single self-report item on balanced assessment, exploration time, and open-ended questions. The paper reports that the Atlas outperforms the baseline on all quantitative metrics, and additionally demonstrates that the underlying format can be populated with 379 uses derived from the AI Incident Database.
Significance. If the comparative results held, the paper would provide a concrete, reusable design pattern for making AI risk information accessible to non-experts, a useful contrast to expert-oriented incident databases. The study is real: it uses a careful crowdsourcing setup with attention checks, demographic matching, and a publicly available artifact. The formative-to-evaluation pipeline and the explicit publication of prompts and supplementary materials are strengths. However, the headline between-group comparison is currently undermined by the construction of the baseline condition and by the absence of inferential statistics; these issues must be resolved before the central claim can be accepted.
major comments (4)
- [Evaluation: Baseline] The control condition is constructed so that it differs from the Atlas on exactly the dimensions later reported as outcomes. The Baseline paragraph states that the baseline 'displayed various uses (R1), categorized them (R2), and allowed exploration (R6)' but 'differed in balancing risks and benefits (R2), reducing complexity (R4), and appealing to audience (R5)'; Figure 4 then reports advantages on balanced assessment, SUS, and aesthetics. As a result, the 53% vs. 32% difference in balanced assessment and the SUS/aesthetics gaps may reflect the intentional information poverty of the control rather than the Atlas's visualization design. The paper needs to show that the baseline is a fair representative of current state-of-the-art practice, for example by using the unmodified AI Incident Database spatial view (or an independently existing tool) as the control, or by adding a third condition that holds content constant and varies only the visualization design; otherwise the comparative claim is confounded.
- [Quantitative results (Figure 4)] No inferential statistics are reported for any of the headline comparisons. Figure 4 marks differences as 'statistically significant' but the text reports only percentages and means (SUS 68 vs. 50, classic aesthetics 3.77 vs. 2.98, etc.) without p-values, test statistics, effect sizes, or confidence intervals. The paper must report the tests used (e.g., t-test/Mann-Whitney for SUS and aesthetics, chi-square/Fisher for the balanced-assessment proportion), with effect sizes and CIs, and should state the pre-specified significance threshold; without these, the claims of superiority are not quantitatively supported.
- [Metrics: quantitative metrics (Q2)] The central construct of 'balanced assessment' (R2) is measured with a single self-report item ('The tool helped me to understand both the risks and benefits of facial recognition'), reported as a binary percentage. This is a weak measure for the paper's key outcome, and it is especially problematic because the two conditions presented different content (138 LLM-generated uses with illustrations and impact cards versus a stripped dashboard with news-article pop-ups). The authors already collected pre- and post-task emails from participants; analyzing these emails for the number/balance of risks and benefits mentioned would provide a direct behavioral outcome and would strengthen the claim considerably. At minimum, the item's wording and threshold should be justified and the content confound acknowledged.
- [Demonstrating the Generalizability of the Tool] The section claims 'successful testing' of generalizability, but what is actually demonstrated is a technical repopulation of the Atlas with 379 uses derived from the AI Incident Database; no user study or expert evaluation is reported for this generalized version. The claim that the design 'allows it to generalize across the diverse range of technology applications' is therefore supported only by a feasibility demonstration, not by testing. The manuscript should either add an evaluation of the generalized Atlas (even a small usability or comprehension check) or rephrase this contribution as a technical generalization demo rather than successful testing.
minor comments (4)
- [Evaluation: Baseline] In the Baseline paragraph, 'categorized them (R2)' appears to be a typo: categorization is requirement R3, while R2 is balanced assessment; this should be corrected to avoid confusion about which dimensions the baseline actually matched.
- [Quantitative results: exploration time] Because the two conditions differ in the amount and type of content and in the number of interactive affordances, longer exploration time should be interpreted as engagement only after controlling for content volume; as reported, it is a descriptive difference rather than a controlled measure of engagement.
- [Metrics: reliability] The paper does not report reliability statistics (e.g., Cronbach's alpha) for the SUS and Perceived Visual Aesthetics scales in this sample; adding these would support the claim that the instruments performed acceptably in the crowdsourced setting.
- [Execution: participants] The demographic matching covers age, sex, and ethnicity only, while recruitment additionally required interest in technology and English fluency; the text should state this limitation more explicitly when describing the sample as representative of the US population.
Circularity Check
No circular derivation: the design-to-evaluation chain is empirical, and the only self-citations are backed by reproduced prompt content and external validation.
full rationale
The paper's claimed derivation chain is not circular. The design requirements (R1-R6) were elicited from an independent formative sample of 40 participants, the Atlas content was generated with LLM prompts whose full text is reproduced in Appendix B and then evaluated by external experts and practitioners, and the outcome measures are standardized scales (SUS, Perceived Visual Aesthetics) plus user agreement ratings. The self-citations to the authors' prior prompts (ExploreGen, RiskGen, BenefitGen, MitigationGen) are not load-bearing in a circular way because the prompts are disclosed in the supplementary material and the generated content was independently checked for correctness. The closest concern is the baseline construction: the control condition is described as differing from the Atlas on balancing risks and benefits (R2), reducing complexity (R4), and broad appeal (R5), and those are also measured outcome dimensions. That is a legitimate external-validity and comparator-fairness limitation, but it is not a circular derivation: the evaluation still measures users' actual perceptions of the deployed Atlas against a specified control, and the result is not a logical consequence of any fitted parameter or definitional identity. No equation or fitted quantity is renamed as a prediction, and no load-bearing claim rests solely on a self-citation. The paper therefore exhibits no significant circularity.
Assumptions & free parameters
assumptions (3)
- domain assumption Design requirements derived from 40 participants transfer to the broader US population of technology-interested individuals.
- domain assumption LLM-generated uses, risks, benefits, mitigations, and illustrations are correct enough to serve as accurate content for risk communication.
- domain assumption A single self-report question captures whether the tool provides a balanced assessment of uses.
Cite this review
Pith. "Pith review of Atlas of AI Risks: Enhancing Public Understanding of AI Risks." pith.science (2026). https://pith.science/paper/I34KV2A6
@misc{pith2026250205324,
  author       = {Pith},
  title        = {Pith review of: Atlas of AI Risks: Enhancing Public Understanding of AI Risks},
  year         = {2026},
  howpublished = {\url{https://pith.science/paper/I34KV2A6}},
  note         = {Machine review of arXiv:2502.05324}
}
read the original abstract
The prevailing methodologies for visualizing AI risks have focused on technical issues such as data biases and model inaccuracies, often overlooking broader societal risks like job loss and surveillance. Moreover, these visualizations are typically designed for tech-savvy individuals, neglecting those with limited technical skills. To address these challenges, we propose the Atlas of AI Risks-a narrative-style tool designed to map the broad risks associated with various AI technologies in a way that is understandable to non-technical individuals as well. To both develop and evaluate this tool, we conducted two crowdsourcing studies. The first, involving 40 participants, identified the design requirements for visualizing AI risks for decision-making and guided the development of the Atlas. The second study, with 140 participants reflecting the US population in terms of age, sex, and ethnicity, assessed the usability and aesthetics of the Atlas to ensure it met those requirements. Using facial recognition technology as a case study, we found that the Atlas is more user-friendly than a baseline visualization, with a more classic and expressive aesthetic, and is more effective in presenting a balanced assessment of the risks and benefits of facial recognition. Finally, we discuss how our design choices make the Atlas adaptable for broader use, allowing it to generalize across the diverse range of technology applications represented in a database that reports various AI incidents.
Figures


Figures from the paper (10 more)




Reference graph
Works this paper leans on
-
[1]
Unlocking devices Face Recognition Device ownersDevice owners Biometric identification and categorization Locking devices and systems Using facial recognition to open a device n=8 Low or limited risk
-
[2]
Identifying suspects for crime prevention Unacceptable Pa/t_tern Recognition, Face Recognition Potential suspects Law enforcement agencies Law enforcement Identifying individuals for law enforcement agencies to prevent crimes Identifying suspicious individuals n=5
-
[3]
Apprehending individuals on the run Remote Biometric Identification, Action Recognition FugitivesLaw enforcement agencies Law enforcement Pursuing individuals on the run Aiding law enforcement and FBI in apprehending fugitives. n=4
-
[4]
Verifying identity Face Recognition, Named Entity Recognition Banks, government agencies, Individuals Streamlining identity verification processes Identifying a person's identity n=3Biometric identification and categorization
-
[5]
In Proceedings of the International Con- ference on Neural Information Processing Systems
Stable Bias: Evaluating Societal Representations in Diffusion Models. In Proceedings of the International Con- ference on Neural Information Processing Systems. Lundberg, S. M.; and Lee, S.-I. 2017. A Unified Approach to Interpreting Model Predictions. In Proceedings of the In- ternational Conference on Neural Information Processing Systems, 4768–4777. Mc...
work page 2017
-
[6]
Preventing fraud in banking security Face Recognition, Named Entity Recognition Banks, Financial institutions Bank customers Finance and Investment n=3 Using in fraud protection protocol in banks Preventing fraud 7 . Enhancing user engagement with personalized advertisement Profiling, Natural Language Generation Advertisers, Social media platforms Social m...
-
[7]
In Proceedings of the AAAI Conference on Human Compu- tation and Crowdsourcing, volume 10, 173–183
A Human-Centric Perspective on Model Monitoring. In Proceedings of the AAAI Conference on Human Compu- tation and Crowdsourcing, volume 10, 173–183. Sietzen, S.; Lechner, M.; Borowski, J.; Hasani, R.; and Waldner, M. 2021. Interactive Analysis of CNN Robustness. Computer Graphics Forum, 40(7): 253–264. Stahl, B. C.; Antoniou, J.; Bhalla, N.; Brooks, L.; J...
work page 2021
-
[8]
Sociotechnical Safety Evaluation of Generative AI Systems. arXiv:2310.11986. Weidinger, L.; et al. 2021. Ethical and Social Risks of Harm from Language Models. arXiv:2112.04359. Zelenka, N.; Di Cara, N.; Day, H.; et al. 2021. Data Hazard Labels. https://datahazards.com. Accessed: 2024-08-20. Supplementary Materials Appendix A Summary of All Technology Use...
arXiv 2021
Show all 59 references
-
[9]
Risk Mentions Sample excerpt from the emails
Generating false personas Natural Language Generation, Pa/t_tern Recognition General public Creating false photos, videos, or voice recordings Falsifying photos n=3Media and Communication, Arts and Entertainment Content creators, Fraudsters Existing High riskExisting High risk...
-
[10]
Identifying people on watchlists Identifying people on watchlists at border crossings to prevent illegal activities Monitoring for people on a watchlist n=2 High risk Remote Biometric Identification Individuals on watchlists Law enforcement agencies Law enforcement
-
[11]
Identifying asylum seekers at border control Remote Biometric Identification, Named Entity Recognition Border control agencies Asylum seekers Migration, Asylum, and Border control management n=2 Helping border control officers to identify asylum seekers Identification in asylum se...
-
[12]
Gathering evidence for crime solving Pa/t_tern Recognition, Information Retrieval Crime suspects, Witnesses Law enforcement agencies Law enforcement Assisting criminal cases Helping solving crimes n=3
-
[13]
Enhancing prison security Remote Biometric Identification, Face Recognition Prison administration Inmates, Prison staff Security and Cybersecurity Strengthening security in prisons Using in government facilities like prisons n=2
-
[14]
T agging individuals on photos Face Recognition, Image Recognition Social media platforms Social Media n=2 Identify individuals for photo tagging T ag individuals on social media Social media users
-
[15]
Retrieving patient records Information Retrieval, Named Entity Recognition Healthcare providers Patients Health and Healthcare Using in health sector for efficient patient record retrieval Assisting in ge/t_ting patient data during medical emergency applications n=2
-
[16]
Assisting disabled individuals Providing assistance to disabled peoplen=1Disabled individuals Accessibility and Inclusion Speech Recognition, Speech Synthesis Healthcare providers
Detecting diseases Computer Vision, Pa/t_tern Recognition Healthcare providers Patients Health and Healthcare Using for diagnosing and disease detectionn=1 17 . Assisting disabled individuals Providing assistance to disabled peoplen=1Disabled individuals Accessibility and Incl...
-
[18]
Tracking citizens in public spaces Remote Biometric Identification, Face Recognition Government agencies Citizens Security and Cybersecurity, Law enforcement Tracking citizens in public spacesn=1
-
[19]
Expediting judicial proceedings Upcoming Legal professionals Expediting judicial proceedingsn=1Pa/t_tern Recognition, Automatic Summarisation Administration of justice and democratic processes Defendants, Witnesses
-
[20]
Unlocking homes n=1 Unlocking homesFace Recognition, Gesture Recognition Homeowners Residents Smart home
-
[21]
Verifying travelers' identities Face Recognition, Named Entity Recognition Border control agencies, Airlines Travelers Public and private transportation Verifying identities for travellingn=1
-
[22]
Demographic profiling for advertisements Profiling, Pa/t_tern Recognition Advertisers, Marketing firms T argeted consumer groups Aiding companies in targeting certain demographics for ads to sell their products Marketing and Advertising n=1
-
[23]
Enhancing workplace security Remote Biometric Identification, Face Recognition Employers, Security firms Employees Employment, workers management and access to self-employment Strengthening security at work places Improving security of employees at workplaces n=3
-
[24]
Enhancing event security Face Recognition, Action Recognition Event organizers, Security firms Event a/t_tendees Security and Cybersecurity Improving security systems Deploying in security scenarios to scan faces at event entrances n=2
-
[29]
Enabling government intrusion and control Will lead to government intrusion into lives of its citizens without their consent Poses a serious threat to be misused by the government n=6
-
[30]
Infringing on an individual's right to privacy Violation of privacy for individuals Poses significant threats to personal privacy n=7
-
[31]
Leading to job losses due to automation Concerns about technology taking human jobs Adoption of facial recognition in workplaces can lead to job loss n=2
-
[32]
Lacking sufficient knowledge for safe implementation n=3 The legislative, judicial and executive collectives do not yet possess enough know-how on AI use Can possess many unforeseen risks
-
[33]
Infringing on the public's right to privacy AI in public spaces may lead to lost privacy Destroys any sense of privacy and confidentiality n=6 Systemic impact
-
[34]
Infringing on fundamental freedoms n=3 Threatens our civil liberties and our human rights Could curtail basic freedoms like going out without being documented or recorded
-
[35]
Compromising public safety and well-being Can compromise the safety and identity of the public Poses threats to societal well-being n=4
-
[36]
Triggering domestic or international crises More unjust arrests and lack of public trust in our government Ethically dubious uses or sloppy operating procedures, aided by insufficient regulation, could became domestic or international crises n=2
-
[37]
Concentrating power Having this much information at hand is not ready for anyone to be privy too Giving that power to any company seems unjust n=2
-
[38]
Exploiting technology by malicious entities What happens if terrorist organizations or other enemies can access this advanced technology, or our own databases? If this type of technology at the government level was hacked, it would pose a significant threat to national security...
-
[39]
Compromising data security and identity safety Potential security risk with leaks and identity theft if facial data is compromised Facial recognition as the master key to someone's identity can be compromised n=6
-
[40]
Promoting a surveillance culture n=7 Technical capability Systemic impact
-
[41]
Leading to discriminatory practices due to biases in the system design and implementation n=10 Using bias of the people programming or using the AI Susceptible to biases that can inflict harm on marginalized communities Systemic impact Systemic impact Systemic impact It will be...
-
[42]
Limiting public expressiveness Creates a judgmental bias on how we are supposed to act in public It is invasive and dehumanizing n=2
-
[43]
Assisting disabled individuals Using it on children Used on innocent people on the streets such as through doorbells n=2 Human interaction
Promoting the spread of misinformation and harmful content Devolve into the increased spread of misinformation AI be used to falsify photos (including those of the pornographic nature) which I can only see having negative consequences if we can no longer trust that an image we...
-
[44]
Benefit Mentions Sample excerpt from the emails
Compromising the decision-making process Decisions and conclusions that are made using facial recognition technology are simply unreliable Can lead to false conclusions as it only scans key parts of a face that may be similar to someone else's n=6 Human interaction Human inter...
-
[45]
Monitoring of uses n=2 Paired with heavy monitoring Significant oversight
-
[46]
Rolling out contingency plans with independent evaluation Implement backup measures that require review by others when used for law enforcement or government operations n=1
Conducting expert audits to assess impact Need for expert input to balance pros and consn=1 7 . Rolling out contingency plans with independent evaluation Implement backup measures that require review by others when used for law enforcement or government operations n=1
-
[47]
Implementing privacy-preserving features n=1 Encrypting facial scan data Technical capability
-
[48]
Implementing regulatory safeguards n=4 The tool needs to be respected by authorities and government Facial recognition models need clear restrictionsSystemic impact Systemic impact Systemic impact Systemic impact
-
[49]
Implementing a consent process If used on people who give consent I would only allow its use with complete wri/t_ten consent of every individual citizen n=2 Human interaction
-
[50]
Implementing an opt out process It can be a personal issue that people should be able to opt out ofn=1 Human interaction
-
[51]
Implementing responsible use guidelines It can be used responsibly and with privacy, fairness, and safety in mind It should be used in a cautious and considerate way n=2 Human interaction
-
[52]
Benefit Mentions Sample excerpt from the emails
Implementing human oversight features As long as it is used in tandem with human verification and corroboration Oversight measures could mitigate privacy and personal information concerns n=2 Human interaction Figure 7: Mitigations generated by the participants of the formative...
-
[53]
Saving resources Could save trillions of dollars of expenses for the economy Could benefit industries n=2
-
[54]
Enhancing public safety n=3 Could potentially lead to higher safety in communities Can help keep society and communities safer for various reasons
-
[55]
Supporting the growth of industries n=2 It has many applications The breadth of uses for facial recognition are vast
-
[56]
Promoting the rule of law Make sure the person is lawfully utilizing thingsn=1
Creating new jobs Could create new tech jobsn=1 7 . Promoting the rule of law Make sure the person is lawfully utilizing thingsn=1
-
[57]
Enhancing security measures n=3 Responsible implementation of facial recognition technology can improve security Can be used in security for accounts, safes, and locking technologyTechnical capability
-
[58]
Reducing instances of physical or sexual violence n=4 Can help put violent criminals and sexual offenders away Solve cases for various crimes that are captured on cameraSystemic impact Systemic impact Systemic impact Systemic impact Systemic impact Systemic impact
-
[59]
Senior AI Technology Expert responsible for identifying and cataloging various AI applications and use cases
Enhancing quality of life Has immense potential to enhance various aspects of daily life Makes life usual easier to quickly open a device n=3 Human interaction Figure 8: Benefits generated by the participants of the formative study through writing emails to regulators. Appendi...
2024
-
[2019]
In Proceedings of the ACM Conference on Fairness, Accountability, and Transparency, 220–229
Model Cards for Model Reporting. In Proceedings of the ACM Conference on Fairness, Accountability, and Transparency, 220–229. Moraes, T. G.; Almeida, E. C.; and de Pereira, J. R. L. 2021. Smile, You Are Being Identified! Risks and Measures for the Use of Facial Recognition in ...
2021 arXiv
-
[2021]
IEEE Computer Graphics and Applica- tions, 41(1): 8–14
Using Artificial Intelligence to Visualize the Impacts of Climate Change. IEEE Computer Graphics and Applica- tions, 41(1): 8–14. Luccioni, A. S.; Akiki, C.; Mitchell, M.; and Jernite, Y
-
[2022]
Computers in Human Behavior, 130: 107182
Whose AI? How Different Publics Think About AI and its Social Impacts. Computers in Human Behavior, 130: 107182. Barrett, C.; Boyd, B.; Bursztein, E.; Carlini, N.; Chen, B.; Choi, J.; Chowdhury, A. R.; Christodorescu, M.; Datta, A.; et al. 2023. Identifying and Mitigating the ...
2023 arXiv
-
[2023]
In Proceedings of the AAAI Conference on Human Computation and Crowd- sourcing, volume 11, 65–76
Where Does my Model Underperform? A Human Evaluation of Slice Discovery Algorithms. In Proceedings of the AAAI Conference on Human Computation and Crowd- sourcing, volume 11, 65–76. Kaur, H.; Nori, H.; Jenkins, S.; Caruana, R.; Wallach, H.; and Wortman Vaughan, J. 2020. Interp...
2020
-
[2024]
In Proceedings of the AAAI/ACM Conference on AI, Ethics, and Society
ExploreGen: Large Language Models for Envisioning the Uses and Risks of AI Technologies. In Proceedings of the AAAI/ACM Conference on AI, Ethics, and Society. Hugging Face. 2024. LMSYS Chatbot Arena Leader- board. https://huggingface.co/spaces/lmsys/chatbot-arena- leaderboard....
2024
Reviewed August 8, 2026 · model on record in the stance chip above.
Discussion (0). Continue with ORCID to comment.