REVIEW 4 major objections 5 minor 22 references
Pashen-Back effect for plasma diagnostics
T0 review · 4 major / 5 minor · reviewed 2026-08-09 · deepseek-v4-flash
Pith's one-line read A polarization rotation measurement in a magnetized hydrogen plasma can determine the neutral hydrogen density, because the rotation angle is proportional to the product of electron and neutral densities.
desk verdict The idea is plausible, but Eq. (5) is not derived, the population difference has a units problem, and the central sensitivity claim is unsupported; this is a desk reject for now. read the letter →
The pith
A machine-rendered reading of the paper's core claim, the machinery that carries it, and where it could break.
The reading
What carries the argument
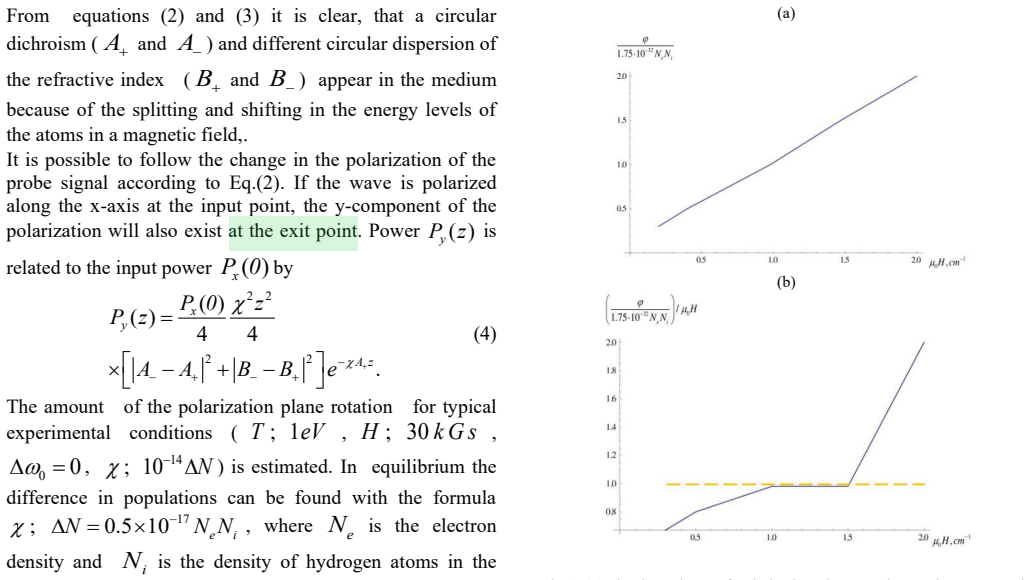
The central mechanism is the difference in propagation of the two circular components $E_+$ and $E_-$ described by the coupled equations (2), with absorption coefficients $A_\pm$ and dispersion coefficients $B_\pm$ built from Landé coefficients, oscillator strengths, and Voigt probability integrals. The rotation of the polarization plane is the accumulated difference between these components. The quantitative identity that carries the diagnostic is Eq. (5): $\varphi = 17.5\times10^{-3} N_e N_i$ for the stated conditions, which converts a polarization measurement into a neutral-density measurement. The population-difference input $\Delta N = 0.5\times10^{-17} N_e N_i$ is what connects the optical response to the plasma densities.
What would settle it
A decisive check is a laboratory experiment on a 10 cm hydrogen plasma at $T\approx1$ eV and $H\approx30$ kG in which $N_e$ is measured by interferometry and $N_i$ independently, for example by absorption or Rayleigh scattering; if $\varphi/(N_eN_i)$ deviates from $17.5\times10^{-3}$ beyond uncertainty, or the rotation does not scale linearly with $N_i$ at fixed $N_e$, the central claim would be falsified.
Extended reading notes
Core claim
In the hyperfine Paschen-Back regime, the two circular polarizations of a probe wave experience different absorption and dispersion. The paper calculates these differences for hydrogen plasma near the $n=2\to3$ H-$\alpha$ transition using strong-field energy splittings, Landé coefficients, oscillator strengths, and Voigt integrals over the Doppler profile. The calculation yields the rotation angle for a 10 cm path, $\varphi = 17.5\times10^{-3} N_e N_i$ at $T=1$ eV and $H=30$ kG, where $N_e$ is the electron density and $N_i$ is the density of neutral hydrogen atoms in the ground state. The paper concludes that modern polarimeters can detect neutral densities as low as $6\times10^{11}$ to $6\times10^{12}\,\mathrm{cm^{-3}}$ when $N_e$ is $10^{13}$ to $10^{14}\,\mathrm{cm^{-3}}$. It also argues that the linear Stark effect, though large in hydrogen, does not erase the polarization signal because it does not lift the magnetic quantum number degeneracy.
Load-bearing premise
Everything hinges on a quoted formula for how many hydrogen atoms sit in the upper versus lower states, a formula used as a density even though its units look like density squared; if that formula is off by a factor, the inferred neutral density is off by the same factor.
Editorial extensions
If this is right
- Residual neutral hydrogen density in a magnetized plasma can be obtained from a single Faraday rotation measurement, without inserting probes or assuming absolute emission intensities.
- The diagnostic is claimed to work from about 1 eV to tokamak temperatures near 100 eV, with magnetic fields around 30 kG and electron densities $10^{13}$ to $10^{14}\,\mathrm{cm^{-3}}$.
- A rotation-angle accuracy of $10^{-5}$ rad makes neutral densities down to $6\times10^{11}\,\mathrm{cm^{-3}}$ detectable over a 10 cm chord.
- Because the linear Stark effect does not remove the magnetic quantum number degeneracy, the strong Stark broadening in hydrogen does not destroy the rotation signal.
- The method gives a line-averaged neutral density; local density profiles require the stimulated-rotation extension discussed by the authors.
Reading between the lines
- If Eq. (5) survives a calibration test, the same polarization geometry could be applied to other hydrogen Balmer lines or to deliberately introduced impurity atoms, giving multiple independent neutral-density channels in one plasma.
- The scaling with path length and polarimetric accuracy suggests that longer chords, stronger fields, or better polarimeters could push the minimum detectable neutral density below $10^{11}\,\mathrm{cm^{-3}}$; this is an extension the paper does not state.
- In recombining or otherwise non-equilibrium plasmas, the equilibrium population-difference formula could bias the inferred neutral density, so calibrating against an independent neutral-density measurement is the natural next test.
- Because the rotation angle is an absolute ratio of transmitted powers, the method is in principle self-calibrating and does not require absolute intensity calibration; that practical advantage is not spelled out in the paper.
Signed reviews
Editorial analysis
A structured set of objections, weighed in public.
Referee Report
Summary. The manuscript proposes a resonant Faraday-rotation diagnostic for neutral hydrogen density in magnetized plasmas in the hyperfine Paschen-Back regime. It presents the energy-level splitting (Eq. 1), propagation equations for circular components (Eqs. 2-3), an expression for the power ratio (Eq. 4), and the central estimate (Eq. 5) that the rotation angle equals 17.5 x 10^-3 N_e N_i for a 10 cm, 1 eV, 30 kG plasma. From this it derives a minimum detectable neutral density of 6 x 10^11 to 6 x 10^12 cm^-3. Section 4 argues that the linear Stark effect does not affect the polarization rotation. The conclusion advocates the method for line-averaged neutral-density measurements.
Significance. The idea of using the Paschen-Back Faraday effect for neutral-density diagnostics is interesting and, if a validated quantitative relation were provided, could be useful for fusion and laboratory plasmas. The paper correctly frames the propagation problem in a standard slowly-varying-amplitude form and recognizes the role of Stark broadening. However, the quantitative claim that would make the diagnostic practical is not supported by the manuscript: the coefficient in Eq. (5) is not derived, and the population-difference relation used to evaluate it is dimensionally ambiguous. Because the proposed diagnostic sensitivity rests entirely on that estimate, the paper in its present form does not establish its central claim.
major comments (4)
- [Section 3, Eq. (5)] The central result is asserted after the single phrase 'Substituting the numerical values...' with no intermediate derivation. The quantities A+ and A- involve ten transitions, Lande coefficients, oscillator strengths, and Doppler-broadened probability integrals, none of which are tabulated or evaluated. A reader cannot verify the coefficient 17.5 x 10^-3, so the claimed minimum detectable density is unsupported.
- [Section 3, after Eq. (4)] The relation Delta N = 0.5 x 10^-17 N_e N_i, attributed to Ref. [20], is used as a population difference per magnetic sublevel in Eq. (2), which requires units of cm^-3. As printed, N_e N_i has units cm^-6; unless the coefficient carries hidden units (e.g., cm^3) or a normalization by a reference density is intended, the relation is dimensionally inconsistent. The paper specifies neither, so the substitution into Eq. (5) is not well defined.
- [Section 3, Eq. (5)] Even granting the product N_e N_i, the stated coefficient as a pure number gives a rotation angle of order 10^24 rad for N_e about 10^14 cm^-3 and N_i about 6 x 10^11 cm^-3, inconsistent with the later use of the formula to infer a minimum angle of 10^-5 rad. The formula therefore cannot be literally correct with densities expressed in cm^-3; some normalization of densities is missing. This prevents the reader from using Eq. (5) at all.
- [Section 4 and Conclusion] The paper gives no validation of the population model or the calculated coefficient against independent experiment or simulation. While a theoretical proposal need not include experiments, the unsupported Eq. (5) means that the claimed applicability ranges in the Conclusion (1-100 eV, N_i of 6 x 10^11 to 6 x 10^12 cm^-3) are not derived from the presented calculation.
minor comments (5)
- [Title and Abstract] The name 'Paschen-Back' is misspelled as 'Pashen-Back' and 'Pashen-Bak' in several places; please correct these consistently.
- [Section 3, Eq. (4)] Equation (4) is not typeset clearly; the relation between P_y and P_x appears incomplete or garbled, so it should be rewritten with explicit dependence on the line-center detuning and medium parameters.
- [Fig. 1] Fig. 1 has no axis labels or units, and the 'orange dashed line' is not described quantitatively, making the claim of non-linear dependence on H difficult to assess.
- [Conclusion] The statement that the method is applicable from 1 eV up to 100 eV is not supported by the calculations, which are explicitly for T about 1 eV and H = 30 kG; the Doppler-width and Stark-broadening arguments are only sketched.
- [References] Reference [20] is cited for the population-difference formula, but no page, equation, or section number is given, so the reader cannot check the origin or the validity conditions of the relation.
Circularity Check
No significant circularity: Eq. (5) is a forward-model output using an external population formula, not a fitted input or self-citation chain.
full rationale
The paper's derivation chain is forward rather than circular. The propagation equations (2)-(4) are standard; the population difference Delta N = 0.5e-17 N_e N_i is taken from an external reference [20], and Eq. (5) is presented as the result of substituting numerical values into those equations. No data are fitted, no parameter is renamed as a prediction, and the diagnostic inversion (measuring phi to infer N_i) follows from the forward model rather than presupposing the answer. The references to the authors' earlier work [21,22] appear only in the concluding remarks, as context for prior similar diagnostics, and are not used to calibrate or force Eq. (5). The paper's significant weaknesses are derivation gaps and a dimensional inconsistency in the Delta N formula, but those are correctness concerns, not circularity: the claimed result is not equivalent to its input by construction, nor is any load-bearing premise justified solely by self-citation.
Assumptions & free parameters
free parameters (4)
- Probe path length z =
10 cm
- Electron density N_e =
1e13 to 1e14 cm^-3
- Temperature T =
1 eV (range up to 100 eV)
- Magnetic field H =
30 kG
assumptions (6)
- standard math Paschen-Back energy formula Eq. (1) for level shifts in strong magnetic fields
- standard math Electric-dipole selection rules Delta L = plus or minus 1, Delta m_L = plus or minus 1, Delta m_S = 0
- domain assumption Isotropic Maxwellian velocity distribution and Doppler broadening model
- domain assumption Equilibrium population difference Delta N = 0.5e-17 N_e N_i from reference [20]
- domain assumption Linear Stark broadening does not affect the polarization rotation because it preserves plus and minus M degeneracy
- domain assumption Polarization rotation measurement accuracy of 1e-5 rad
Cite this review
Pith. "Pith review of Pashen-Back effect for plasma diagnostics." pith.science (2026). https://pith.science/paper/ZFIWSUBQ
@misc{pith2026250206801,
  author       = {Pith},
  title        = {Pith review of: Pashen-Back effect for plasma diagnostics},
  year         = {2026},
  howpublished = {\url{https://pith.science/paper/ZFIWSUBQ}},
  note         = {Machine review of arXiv:2502.06801}
}
read the original abstract
The possibility of determining the magnitude of neutral atom density in hydrogen plasma was investigated using Paschen-Back effect and resonant Faraday rotation of the polarization plane of light by residual neutral atoms in the plasma. In strong magnetic fields when the Zeeman shift is greater than the distance of the hyperfine structure energy levels the Paschen-Back effect is observed. In this case, it is no longer possible to speak about the independence of the splitting of each level of a given multiplet term.
Figures
Reference graph
Works this paper leans on
-
[20]
L.A. Vainstein, I.I. Sobelman, E.A. Yurkov, Atomic Excitation and Spectral Lines Broadening, Nauka, Moscow (1979)
work page 1979
- [1]
-
[2]
J. Kerr,. On rotation of the plane of polarization by reflection from the pole of a magnet. Lond. Edinb. Dublin Philos. Mag. J. Sci. 1877, 3, 321–343. https://doi.org/10.1080/14786447708639245
- [3]
-
[4]
K. Alexey , A. Zvezdin, S. Sangeeta, et al., The 2022 magneto- optics roadmap, J. Phys. D: Appl. Phys. 55 (2022) 463003 (64pp)
work page 2022
-
[5]
Magneto-Optics effects; new trends and future prospects for technological developments, Article in Magnetochemistry 2022 8(9); 94 DOI: 10.3390/magnetochemistry8090094
-
[6]
H. Taskeya, A Review of Magneto-Optic Effects and Its Application International Journal of Electromagnetics and Applications 2017, 7(1): 17-24 DOI: 10.5923/j.ijea.20170701.03
- [7]
Show all 22 references
-
[8]
Dzierżęga, F
K. Dzierżęga, F. Sobczuk, E. Stambulchik, et al.a, Studies of spectral line merging in a laser-induced hydrogen plasma diagnosed with two-color Thomson scattering,, Phys. Rev. E 103, 063207
-
[9]
Lochte-Holtgreven (ed), Plasma Diagnostics, North – Holland (1968)
W. Lochte-Holtgreven (ed), Plasma Diagnostics, North – Holland (1968)
1968
-
[10]
Hutchinson, Principles of Plasma diagnostics, Cabridge University Press, 2005
I.H. Hutchinson, Principles of Plasma diagnostics, Cabridge University Press, 2005
2005
-
[11]
Segre, A review of plasma polarimetry - theory and methods,, 1999 Plasma Phys
S.E. Segre, A review of plasma polarimetry - theory and methods,, 1999 Plasma Phys. Control. Fusion 41 R57 doi 10.1088/0741-3335/41/2/001
1999 doi
-
[12]
Giudicotti, D Fiorucci and E
L. Giudicotti, D Fiorucci and E. Zilli, , High-frequency measurement of the interferometric phase, the Faraday rotation, and the Cotton-Mouton effect with a single detector in a far- infrared interferometer-polarimeter, 2022 Plasma Phys. Control. Fusion 64 075004 doi 10.1088/1...
2022 doi
-
[13]
B. Bieg, J. Chrzanowski , Yu. A. Kravtsov, A. Murari, et al,, , Nuclear Instruments and Methods in Physics Research Section A Accelerators Spectrometers Detectors and Associated Equipment, 720, 157-159 - August 2013; https://doi.org/10.1016/j.nima.2012.12.011
2013 doi
-
[14]
Paschen, E
F. Paschen, E. Back: Liniengruppen magnetisch vervollständigt. Physica 1, 261–273 (1921)
1921
-
[15]
M A Zentile, R Andrews, L Weller1, et al, The hyperfine Paschen–Back Faraday effect , J. Phys. B: At. Mol. Opt. Phys. 47 (2014) 075005,; doi:10.1088/0953-4075/47/7/075005
2014 doi
-
[16]
Zafar, E
A. Zafar, E. Martin and S. Sannon,. High resolution magnetic field measurements in hydrogen and helium plasmas using active laser spectroscopy , Rev. Sci. Instrum. 89, 10D126 (2018)
2018
-
[17]
Landau, E.M
L.D. Landau, E.M. Lifshits, Quantum Mechanics: Non- Relativistic Theory, Elsevier, 2013
2013
-
[18]
Gradshtein, I.M
I.S. Gradshtein, I.M. Ryzhik, Tables Of Integrals, Series And Products, Academic Press, 2007
2007
-
[19]
Papageorgiou, A
N. Papageorgiou, A. Weis, V. Sautenkov, et al,, High-resolution selective reflection spectroscopy in intermediate magnetic fields Appl. Phys. B: Lasers Opt. 59, 123 (1994)
1994
-
[21]
Oganesyan, K
K.B. Oganesyan, K. Dzerdziega, P. Kopcansky, A.H. Gevorgyan et al., Polarimetric method of plasma diagnostics, Laser Physics Letters, 19, (2022), 096001, doi 10.1088/1612-202X/ac7f38
2022 doi
-
[22]
Dzier˙ ze˛ga, A.H
K.B Oganesyan, K. Dzier˙ ze˛ga, A.H. Gevorgyan, et al., Plasma local diagnostics by polarimetric method , Laser Phys. Lett. 20 (2023) 056002 doi 10.1088/1612-202X/accdd4
2023 doi
Reviewed August 9, 2026 · model on record in the stance chip above.
Discussion (0). Continue with ORCID to comment.