REVIEW 3 major objections 4 minor 163 references
Weak lensing mass-richness relation of redMaPPer clusters in the LSST DESC DC2 simulations
T0 review · 3 major / 4 minor · reviewed 2026-08-08 · deepseek-v4-flash
Pith's one-line read A simulated LSST-like sky shows that combining cluster counts with weak lensing recovers the mass-richness relation of redMaPPer clusters.
desk verdict A careful, useful simulation-based calibration of a counts+lensing pipeline for LSST cluster cosmology; the selection function is the load-bearing but self-referential piece. read the letter →
The pith
A machine-rendered reading of the paper's core claim, the machinery that carries it, and where it could break.
The reading
What carries the argument
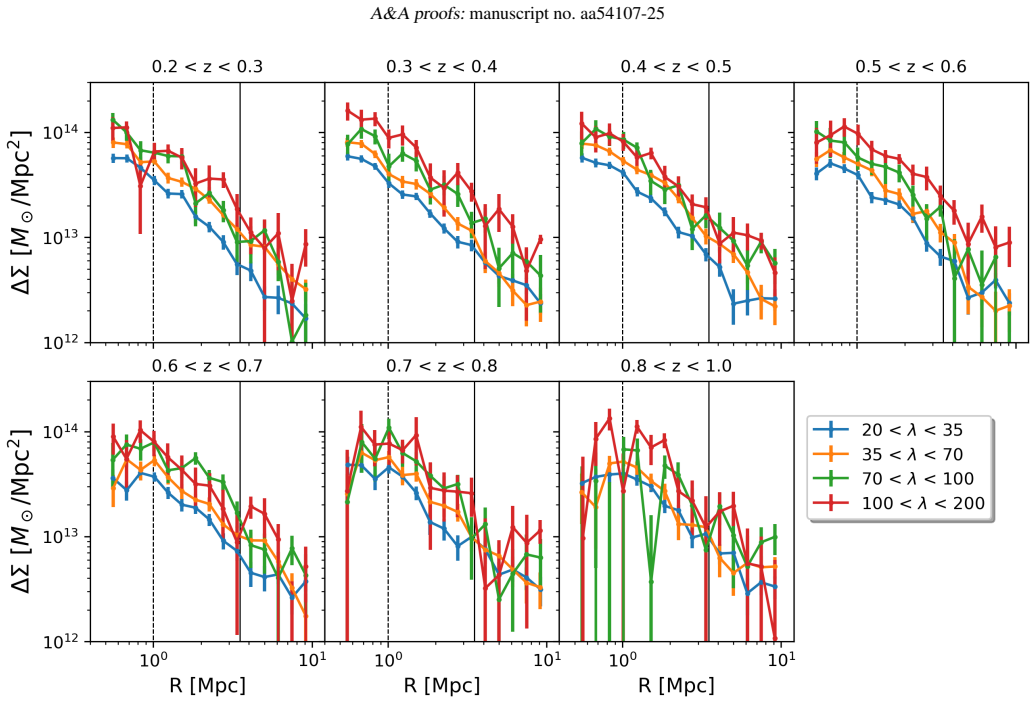
The load-bearing object is the forward model connecting halo mass and richness through $P(\lambda|m,z)$, a six-parameter log-normal scaling relation, combined with the redMaPPer selection function $\Phi(\lambda,m,z)=c(m,z)/p(\lambda,z)$, where completeness $c$ is measured by matching detected clusters to simulated halos and purity is assumed near unity for $\lambda>20$. The lensing side uses the stacked excess surface density $\Delta\Sigma(R)$ predicted by integrating $\Delta\Sigma(R|m,z)$ over the same mass function, completeness, and richness distribution, with the 1-halo term from an NFW profile (or Einasto/Hernquist) plus a concentration-mass relation; a two-step variant fits a mean mass per richness-redshift bin instead. The machinery works by feeding the same selection-function-weighted halo population into both the count prediction and the lensing prediction, so that the complementary degeneracy directions of counts and lensing can break the scaling-relation parameter degeneracies.
What would settle it
Run the same count+lensing fit after adding the stacked shear of unmatched redMaPPer detections to the signal, or after replacing the matching-based completeness with an independently calibrated completeness from injected mock clusters; if the recovered $\ln\lambda_0$ or $\mu_m$ move by more than the reported uncertainties, the selection-function treatment is the source of the bias.
Extended reading notes
Core claim
The central claim is that a joint count+lensing analysis of redMaPPer clusters in the DC2 simulation recovers the underlying mass-richness relation without strong modeling bias. The authors model the observed richness as a log-normal variable around a mean $\langle\ln\lambda|m,z\rangle = \ln\lambda_0 + \mu_z \ln((1+z)/(1+z_0)) + \mu_m \log_{10}(m/m_0)$, with scatter $\sigma_{\ln\lambda|m,z}$, and predict both cluster counts and stacked excess surface density $\Delta\Sigma(R)$ through the halo mass function weighted by the redMaPPer completeness. Combining counts with either stacked profiles or mean masses tightens constraints on the mean scaling parameters by a factor of about seven and on the scatter parameters by a factor of three to four, and the recovered parameters agree with the fiducial relation from halo-richness matching at the 1-2$\sigma$ level. The paper also claims that the constraints are robust to the choice of concentration-mass relation and to NFW, Einasto, or Hernquist density profiles in the radial fit range $1<R<3.5$ Mpc, and that photo-z systematics and shear-richness covariance produce only small, partially correctable shifts.
Load-bearing premise
The analysis assumes that the redMaPPer completeness measured by matching detected clusters to dark matter halos is accurate and that the roughly 1% spurious detections contribute negligible lensing signal; if unmatched clusters have non-negligible shear or the matching misses real clusters, both the count and stacked-lensing predictions shift and bias the inferred mass-richness relation.
Editorial extensions
If this is right
- Using either stacked profiles or mean masses in combination with counts gives comparable constraints; errors on $\ln\lambda_0$, $\mu_z$, and $\mu_m$ shrink by roughly a factor of seven relative to single-probe fits.
- Adopting different concentration-mass relations or dark matter density profiles (NFW, Einasto, Hernquist) shifts the inferred scaling relation by less than about $1\sigma$ when fitting in $1<R<3.5$ Mpc.
- Photometric redshift errors from a pessimistic template-based estimator bias the normalization by about $1\sigma$; fitting a global multiplicative factor $(1+b)$ jointly with the scaling parameters removes most of this bias.
- Shear-richness covariance shifts the mass slope $\mu_m$ by up to $0.5\sigma$, an effect comparable to the photo-z shift and larger than the shift from an optimistic machine-learning photo-z estimator.
- Across all tested analysis configurations, posterior shifts relative to the fiducial relation stay below $2\sigma$, supporting the reliability of the joint count+lensing pipeline for LSST-era cluster cosmology.
Reading between the lines
- The $R>1$ Mpc cut imposed by ray-tracing resolution means the inner region, where profile differences and miscentering matter most, is untested; real LSST data with better small-scale resolution could reveal larger modeling sensitivity than this paper measures.
- The measured shear-richness covariance is likely suppressed by the simulation's spherical assignment of galaxies in halos, so the 0.5 sigma shift should be treated as a lower bound until triaxial galaxy placement or real data are used.
- A natural next step is to free the cosmological parameters in the same counts+lensing fit; the complementarity demonstrated here suggests joint cluster cosmology constraints could be substantially tighter than counts alone.
- The photo-z bracket between pessimistic and optimistic estimators offers a practical calibration strategy for LSST: adopt a fitted multiplicative lensing correction and validate it with spectroscopic subsamples.
Editorial analysis
A structured set of objections, weighed in public.
Referee Report
Summary. The paper constrains the redMaPPer cluster mass-richness relation in the cosmoDC2/DC2 simulation using cluster number counts and either stacked weak-lensing profiles or mean lensing masses, across richness 20<lambda<200 and redshift 0.2<z<1. The analysis uses a six-parameter log-normal scaling relation, a selection function calibrated from the ClEvaR matched cluster-halo catalog, and a fixed simulation cosmology. The authors report that the joint count+lensing analysis recovers the fiducial relation inferred from the matched catalog, that the constraints are robust to concentration-mass relation and density profile choices, that photometric redshift uncertainties introduce about 1 sigma biases which can be mitigated by a fitted multiplicative correction, and that shear-richness covariance shifts results by up to about 0.5 sigma. The paper also provides a quantitative tension metric and makes use of several public DESC software tools.
Significance. If the central claim holds, this is a useful validation of an LSST-era cluster scaling relation pipeline: it is the first redMaPPer mass-richness constraint in cosmoDC2, it explores a broad set of modeling and observational systematics (concentration-mass relations, NFW/Einasto/Hernquist profiles, BPZ/FlexZBoost photo-zs, shear-richness covariance), and it provides a transparent comparison against a fiducial relation. The strengths include the explicit use of public DES C tools, the side-by-side comparison of stacked profiles versus mean masses, and the candid discussion of limitations in Sect. 6.2. Nonetheless, the main validation is against a fiducial relation derived from the same matching that calibrates the selection function, so the external reach of the 'recovery' claim is weaker than the abstract implies; this, together with the diagonal-only lensing covariance, is the main reason the central claim needs additional support.
major comments (3)
- [Sect. 3.4 and Eqs. (1), (13), (14)] The central validation claim in Sect. 6.1 rests on agreement with a fiducial relation that is fitted to the same ClEvaR matched catalog (Sect. 3.4.1) that also supplies the selection function c(m,z) entering the count and lensing predictions (Sect. 3.4.2). This makes the agreement an internal consistency test: a systematic error in the matching, such as redshift-dependent incompleteness or residual projection contamination, would shift the model predictions and the reference relation together and would not be detected by the posteriors in Fig. 6. None of the robustness tests in Sect. 5 vary c(m,z), and the purity argument in footnote 9 relies on the same matched catalog. I request a perturbation test of c(m,z) within the uncertainties quoted in Sect. 3.4.2 (for example, using the stated 80% completeness level at M200c > 10^14 Msun) with the resulting shifts in ln lambda0 and mu_m reported, or, failing that, a revised wording that limits the claim to pipeline self-consistency rather than an external recovery of the mass-richness relation.
- [Sect. 4.2.2, Eq. (26)] The stacked-lensing likelihood uses only the diagonal of the bootstrap covariance, justified by the noisiness of off-diagonal terms. This is an acknowledged approximation, but the paper's quantitative consistency statements, including the tension values in Sect. 6.1 and Fig. E.1, depend on the covariance being correct; if the off-diagonal elements are positive, as expected from correlated large-scale structure and halo-profile variations, the quoted uncertainties are underestimated. I ask the authors to provide a quantitative check of the off-diagonal-to-diagonal ratio in the fitted 1-3.5 Mpc range, for example by comparing the bootstrap result with an analytic covariance prediction (Wu et al. 2019) or with a smoothed/shrunk bootstrap covariance, and to state whether the parameter shifts and tension values are affected.
- [Sect. 5.3.1] The multiplicative correction factor (1+b) is fitted jointly with the scaling parameters and is common to all redshift-richness bins. This can absorb only a monopole normalization error; it cannot correct a photo-z bias that varies with redshift or richness. In the BPZ case the uncorrected shifts in ln lambda0 and mu_m are of order 1 sigma, and the paper does not demonstrate that the factor is not absorbing a redshift-dependent bias. I suggest a diagnostic that fits b per redshift bin (or per redshift-richness bin) and checks whether the b values are consistent, since this directly affects the claim that the photo-z bias is 'mitigated' by the single factor.
minor comments (4)
- [Abstract vs. Sect. 5.1 and 6.1] The abstract says the constraints are consistent 'at the 1 sigma level' with the fiducial values, while Sect. 5.1 states the posteriors recover the fiducial values 'at the <2 sigma level' and reports a '>2 sigma tension' in the projected mu_z-sigma_z plane; Sect. 6.1 again says 'consistent at the 1 sigma level.' These statements should be harmonized with the actual tension values reported in Fig. E.1.
- [Fig. 7 and Sect. 5.2.1] The figure caption calls the case with concentration left free 'concentration-free,' while the text uses 'free-concentration case'; please use one consistent term throughout.
- [Table E.1] The block beginning 'Impact of source photometric redshifts, Sect. 5.3.2' appears to refer to the shear-richness covariance analysis rather than photometric redshifts; the section label should be corrected.
- [Eq. (13)] The lower integration limit m_min is not specified in Eq. (13); for consistency with Eq. (1) and Sect. 4.2.1, the adopted value (10^12 Msun) should be stated where the lensing model is first introduced.
Circularity Check
No significant circularity: the inference uses independent count and lensing data vectors, with the fiducial relation used only as a comparison reference.
full rationale
The central inference is not circular. The data vectors are the redMaPPer cluster counts (Sect. 4.1.1), stacked excess surface density profiles (Sect. 4.1.2), and mean lensing masses (Sect. 4.1.3), all constructed from the simulation catalogs independently of the scaling-relation parameters. The models in Eqs. (1), (13), and (14) use the standard halo mass function, a calibrated completeness c(m,z), and the parametric P(lambda|m,z); the parameters are then sampled from the likelihoods in Eqs. (24), (26), and (27). The fiducial relation from ClEvaR matching (Sect. 3.4.1) is not used as a prior or likelihood term; it is only a posterior reference for the tension metric in Fig. 13 and Eq. (39). Although the completeness calibration and the fiducial relation share the same matched catalog, so that their agreement is an internal-consistency check rather than an external validation, this shared provenance does not make any predicted parameter algebraically equal to an input. The paper explicitly acknowledges the residual systematics: Sect. 2.2 footnote 9 states that neglecting spurious detections is "a strong assumption," and Sect. 6.2 notes that "uncertainties in the selection function may still induce some bias in the recovered parameters." The (1+b) photo-z factor is a fitted nuisance parameter tested for mitigation, not relabeled as a prediction, and the shear-richness covariance is an estimated correction, not a derived output. There is no equation-level reduction of an output to an input, and no load-bearing self-citation chain.
Assumptions & free parameters
free parameters (7)
- ln lambda_0 =
3.37 +/- 0.03 (baseline counts plus profiles)
- mu_z =
0.08 +/- 0.07 (baseline counts plus profiles)
- mu_m =
2.18 +/- 0.07 (baseline counts plus profiles)
- sigma_ln_lambda_0 =
0.53 +/- 0.03 (baseline counts plus profiles)
- sigma_z =
0.20 +/- 0.11 (baseline counts plus profiles)
- sigma_m =
0.14 +/- 0.05 (baseline counts plus profiles)
- Photo-z bias correction (1+b) =
b = -0.02 +/- 0.03 for BPZ, b = 0.02 +/- 0.03 for FlexZBoost
assumptions (7)
- domain assumption The Despali et al. (2015) halo mass function and Tinker et al. (2010) halo bias accurately describe halo abundance and clustering in cosmoDC2.
- domain assumption The mass-richness relation is log-normal with mean and scatter given by Eqs. (15) to (17).
- domain assumption The redMaPPer selection function factorizes as Phi = c(m,z) / p(lambda,z), with purity near unity for lambda above 20 and no lensing from spurious detections.
- domain assumption The NFW profile with the Duffy et al. (2008) concentration-mass relation describes the cluster density over the fitted radial range.
- domain assumption The two-halo term is negligible for R below 3.5 Mpc.
- ad hoc to paper Off-diagonal elements of the stacked lensing profile covariance are negligible.
- domain assumption Observed and true cluster redshifts are equal in the selection function form.
Cite this review
Pith. "Pith review of Weak lensing mass-richness relation of redMaPPer clusters in the LSST DESC DC2 simulations." pith.science (2026). https://pith.science/paper/5CCGGJDT
@misc{pith2026250208444,
  author       = {Pith},
  title        = {Pith review of: Weak lensing mass-richness relation of redMaPPer clusters in the LSST DESC DC2 simulations},
  year         = {2026},
  howpublished = {\url{https://pith.science/paper/5CCGGJDT}},
  note         = {Machine review of arXiv:2502.08444}
}
abstract
Cluster scaling relations are key ingredients in cluster abundance-based cosmological studies. In optical cluster cosmology, where clusters are detected through their richness, cluster-weak gravitational lensing has proven to be a powerful tool to constrain the cluster mass-richness relation. This work is conducted as part of the Dark Energy Science Collaboration (DESC), which aims to analyze the Legacy Survey of Space and Time (LSST) of the Vera C. Rubin Observatory, starting in 2026. Weak lensing-inferred cluster properties, such as mass, suffer from several sources of bias. We constrain the mass-richness relation of 3,600 clusters detected by the redMaPPer algorithm in the cosmoDC2 extra-galactic mock catalog of the LSST DESC DC2 simulation, covering 440 square degrees, using number count measurements and either stacked weak lensing profiles or mean cluster masses in intervals of richness ($20 < \lambda < 200$) and redshift ($0.2 < z < 1$). We find that, for an LSST-like source galaxy density, our constraints are robust to changes in the concentration-mass relation and dark matter density profile modeling choices, when source redshifts and shapes are perfectly known. We find that photometric redshift uncertainties can introduce bias at the 1$\sigma$ level, which can be mitigated by an overall correction factor, fitted jointly with the scaling parameters. We find that including positive shear-richness covariance in the fit shifts the results by up to 0.5$\sigma$. Our constraints also compare fairly to a fiducial mass-richness relation, obtained from matching cosmoDC2 halo masses to redMaPPer-detected cluster richnesses.
Figures


Figures from the paper (10 more)


Reference graph
Works this paper leans on
-
[1]
2022, , 105, 023520
Abbott , T., Aguena , M., Alarcon , A., et al. 2022, , 105, 023520
2022
-
[2]
H., Klypin , A., & Wilson , G
Abdullah , M. H., Klypin , A., & Wilson , G. 2020, , 901, 90
2020
-
[3]
A., Allison , J., Anderson , S
Abell , P. A., Allison , J., Anderson , S. F., et al. 2009, arXiv e-prints, arXiv:0912.0201
arXiv 2009
-
[4]
2021, , 253, 31
Abolfathi , B., Alonso , D., Armstrong , R., et al. 2021, , 253, 31
2021
-
[5]
Building an Efficient Cluster Cosmology Software Package for Modeling Cluster Counts and Lensing
Aguena , M., Alves , O., Annis , J., et al. 2023, arXiv e-prints, arXiv:2309.06593
work page Pith review arXiv 2023
-
[6]
2021, , 508, 6092
Aguena , M., Avestruz , C., Combet , C., et al. 2021, , 508, 6092
2021
-
[7]
N., et al
Aguena, M., Benoist, C., da Costa, L. N., et al. 2021, , 502, 4435
2021
-
[8]
& Lima , M
Aguena , M. & Lima , M. 2018, , 98, 123529
2018
Show all 163 references
-
[9]
2018, , 70, S8
Aihara , H., Armstrong , R., Bickerton , S., et al. 2018, , 70, S8
2018
-
[10]
W., Evrard , A
Allen , S. W., Evrard , A. E., & Mantz , A. B. 2011, , 49, 409
2011
-
[11]
E., Farahi , A., et al
Anbajagane , D., Evrard , A. E., Farahi , A., et al. 2020, , 495, 686
2020
-
[12]
G., & Murray , C
Artis , E., Melin , J.-B., Bartlett , J. G., & Murray , C. 2021, , 649, A47
2021
-
[13]
2013, , 558, A33
Astropy Collaboration . 2013, , 558, A33
2013
-
[14]
Bartlett , J. G. 1997, 126, 365
1997
-
[15]
J., Rozo, E., Jain, B., Rykoff, E., & Wechsler, R
Baxter, E. J., Rozo, E., Jain, B., Rykoff, E., & Wechsler, R. H. 2016, , 463, 205
2016
-
[16]
Becker , M. R. & Kravtsov , A. V. 2011, , 740, 25
2011
-
[17]
2018, , 473, 5221
Bellagamba , F., Roncarelli , M., Maturi , M., & Moscardini , L. 2018, , 473, 5221
2018
-
[18]
2011, ASCL, ascl:1108.011
Ben \' tez , N. 2011, ASCL, ascl:1108.011
2011
-
[19]
Benson , A. J. 2012, , 17, 175
2012
-
[20]
Bernstein , G. M. & Nakajima , R. 2009, , 693, 1508
2009
-
[21]
2013, , 766, 32
Bhattacharya , S., Habib , S., Heitmann , K., & Vikhlinin , A. 2013, , 766, 32
2013
-
[22]
1982, , 107, 338
Binggeli , B. 1982, , 107, 338
1982
-
[23]
E., et al
Bocquet , S., Grandis , S., Bleem , L. E., et al. 2024, arXiv e-prints, arXiv:2401.02075
2024 arXiv
-
[24]
2024, , 685, A106
Bulbul , E., Liu , A., Kluge , M., et al. 2024, , 685, A106
2024
-
[25]
S., Kolatt , T
Bullock , J. S., Kolatt , T. S., Sigad , Y., et al. 2001, , 321, 559
2001
-
[26]
Buote, D. A. & Lewis, A. D. 2004, , 604, 116
2004
-
[27]
2013, , 434, 2121–2135
Chang, C., Jarvis, M., Jain, B., et al. 2013, , 434, 2121–2135
2013
-
[28]
2024, arXiv e-prints, arXiv:2406.11966
Chen , K.-F., Chiu , I.-N., Oguri , M., et al. 2024, arXiv e-prints, arXiv:2406.11966
2024 arXiv
-
[29]
E., Alonso, D., Krause, E., et al
Chisari, N. E., Alonso, D., Krause, E., et al. 2019, , 242, 2
2019
-
[30]
2024, arXiv e-prints, arXiv:2406.11970
Chiu , I.-N., Chen , K.-F., Oguri , M., et al. 2024, arXiv e-prints, arXiv:2406.11970
2024 arXiv
-
[31]
Corless , V. L. & King , L. J. 2009, , 396, 315
2009
-
[32]
S., et al
Costanzi, M., Rozo, E., Rykoff, E. S., et al. 2018, , 482, 490–505
2018
-
[33]
2019, , 488, 4779
Costanzi, M., Rozo, E., Simet, M., et al. 2019, , 488, 4779
2019
-
[34]
2022, , 2022, 034
Cromer , D., Battaglia , N., Miyatake , H., & Simet , M. 2022, , 2022, 034
2022
-
[35]
B., Rasia , E., et al
Darragh-Ford , E., Mantz , A. B., Rasia , E., et al. 2023, , 521, 790
2023
-
[36]
2020, , 102, 023509
DES Collaboration . 2020, , 102, 023509
2020
-
[37]
2025, arXiv e-prints, arXiv:2503.13632
DES Collaboration . 2025, arXiv e-prints, arXiv:2503.13632
2025 arXiv
-
[38]
E., et al
Despali, G., Giocoli, C., Angulo, R. E., et al. 2015, , 456, 2486
2015
-
[39]
2014, , 443, 3208
Despali, G., Giocoli, C., & Tormen, G. 2014, , 443, 3208
2014
-
[40]
& Joyce , M
Diemer , B. & Joyce , M. 2019, , 871, 168
2019
-
[41]
& Kravtsov, A
Diemer, B. & Kravtsov, A. V. 2014, , 789, 1
2014
-
[42]
R., Schaye , J., Kay , S
Duffy , A. R., Schaye , J., Kay , S. T., & Dalla Vecchia , C. 2008, , 390, L64
2008
-
[43]
1965, Trudy Astrofizicheskogo Instituta Alma-Ata, 5, 87
Einasto , J. 1965, Trudy Astrofizicheskogo Instituta Alma-Ata, 5, 87
1965
-
[44]
C., Tilquin , A., et al
Escoffier , S., Cousinou , M. C., Tilquin , A., et al. 2016, arXiv e-prints, arXiv:1606.00233
2016 arXiv
-
[45]
2019, , 627, A23
Euclid Collaboration . 2019, , 627, A23
2019
-
[46]
E., Arnault, P., Huterer, D., & Farahi, A
Evrard, A. E., Arnault, P., Huterer, D., & Farahi, A. 2014, , 441, 3562
2014
-
[47]
Farahi, A., Anbajagane, D., & Evrard, A. E. 2022, , 931, 166
2022
-
[48]
E., McCarthy , I., Barnes , D
Farahi , A., Evrard , A. E., McCarthy , I., Barnes , D. J., & Kay , S. T. 2018, , 478, 2618
2018
-
[49]
E., Rozo , E., Rykoff , E
Farahi , A., Evrard , A. E., Rozo , E., Rykoff , E. S., & Wechsler , R. H. 2016, , 460, 3900
2016
-
[50]
W., Lang , D., & Goodman , J
Foreman-Mackey , D., Hogg , D. W., Lang , D., & Goodman , J. 2013, , 125, 306
2013
-
[51]
2023, arXiv e-prints, arXiv:2310.09146
Fumagalli , A., Costanzi , M., Saro , A., Castro , T., & Borgani , S. 2023, arXiv e-prints, arXiv:2310.09146
2023 arXiv
-
[52]
2021, , 652, A21
Fumagalli , A., Saro , A., Borgani , S., et al. 2021, , 652, A21
2021
-
[53]
F., Cole , S., et al
Gao , L., Navarro , J. F., Cole , S., et al. 2008, , 387, 536
2008
-
[54]
2024, arXiv e-prints, arXiv:2402.08458
Ghirardini , V., Bulbul , E., Artis , E., et al. 2024, arXiv e-prints, arXiv:2402.08458
2024 arXiv
-
[55]
2021, , 653, A19
Giocoli , C., Marulli , F., Moscardini , L., et al. 2021, , 653, A19
2021
-
[56]
2022, , 659, A128
Gouyou Beauchamps , S., Lacasa , F., Tutusaus , I., et al. 2022, , 659, A128
2022
-
[57]
L., Connolly, A
Graham, M. L., Connolly, A. J., Ivezić, Z., et al. 2017, The Astronomical Journal, 155, 1
2017
-
[58]
J., Klein , M., & Dolag , K
Grandis , S., Bocquet , S., Mohr , J. J., Klein , M., & Dolag , K. 2021, , 507, 5671
2021
-
[59]
2024, , 687, A178
Grandis, S., Ghirardini, V., Bocquet, S., et al. 2024, , 687, A178
2024
-
[60]
2023, , 677, A101
Grishin , K., Mei , S., & Ili \'c , S. 2023, , 677, A101
2023
-
[61]
R., Friedrich, O., & Mana, A
Gruen, D., Seitz, S., Becker, M. R., Friedrich, O., & Mana, A. 2015, , 449, 4264
2015
-
[62]
A., et al
Hasselfield , M., Hilton , M., Marriage , T. A., et al. 2013, , 2013, 008
2013
-
[63]
2020, , 495, 5040
Hearin , A., Korytov , D., Kovacs , E., et al. 2020, , 495, 5040
2020
-
[64]
2019, , 245, 16
Heitmann, K., Finkel, H., Pope, A., et al. 2019, , 245, 16
2019
-
[65]
2020, , 640, A117
Hern \'a ndez-Mart \' n , B., Schrabback , T., Hoekstra , H., et al. 2020, , 640, A117
2020
-
[66]
1990, , 356, 359
Hernquist , L. 1990, , 356, 359
1990
-
[67]
2005, , 442, 43
Hetterscheidt , M., Erben , T., Schneider , P., et al. 2005, , 442, 43
2005
-
[68]
& Seljak , U
Hirata , C. & Seljak , U. 2003, , 343, 459
2003
-
[69]
2003, , 339, 1155
Hoekstra, H. 2003, , 339, 1155
2003
-
[70]
Hogg , D. W. 1999, arXiv e-prints, astro
1999
-
[71]
& Kravtsov, A
Hu, W. & Kravtsov, A. V. 2003, , 584, 702–715
2003
-
[72]
Hunter , J. D. 2007, Computing in Science and Engineering, 9, 90
2007
- [73]
-
[74]
& Roos, M
James, F. & Roos, M. 1975, Comput. Phys. Commun., 10, 343
1975
-
[75]
M., Broadhurst , T., De Martino , I., & Lazkoz , R
Jimeno , P., Diego , J. M., Broadhurst , T., De Martino , I., & Lazkoz , R. 2018, , 478, 638
2018
-
[76]
Jing , Y. P. & Suto , Y. 2002, , 574, 538
2002
-
[77]
Jones, E., Oliphant, T., & Peterson, P. 2001
2001
-
[78]
1984, , 284, L9
Kaiser , N. 1984, , 284, L9
1984
-
[79]
2016, in IOS Press, 87--90
Kluyver , T., Ragan-Kelley , B., P \'e rez , F., et al. 2016, in IOS Press, 87--90
2016
-
[80]
2016, , 457, 4340
Klypin , A., Yepes , G., Gottl \"o ber , S., Prada , F., & He , S. 2016, , 457, 4340
2016
-
[81]
2015, , 453, 3107
K \"o hlinger , F., Hoekstra , H., & Eriksen , M. 2015, , 453, 3107
2015
-
[82]
R., et al
Komatsu , E., Dunkley , J., Nolta , M. R., et al. 2009, , 180, 330
2009
-
[83]
M., Dunkley , J., et al
Komatsu , E., Smith , K. M., Dunkley , J., et al. 2011, , 192, 18
2011
-
[84]
2019, , 245, 26
Korytov, D., Hearin, A., Kovacs, E., et al. 2019, , 245, 26
2019
-
[85]
2022, OJAp, 5, 1
Kovacs , E., Mao , Y.-Y., Aguena , M., et al. 2022, OJAp, 5, 1
2022
-
[86]
Kravtsov , A. V. & Borgani , S. 2012, , 50, 353
2012
-
[87]
J., & McGibbon , R
Kugel , R., Schaye , J., Schaller , M., Forouhar Moreno , V. J., & McGibbon , R. J. 2024, arXiv e-prints, arXiv:2408.17217
2024 arXiv
-
[88]
2018, , 611, A83
Lacasa, F., Lima, M., & Aguena, M. 2018, , 611, A83
2018
-
[89]
2011, arXiv e-prints, arXiv:1110.3193
Laureijs , R., Amiaux , J., Arduini , S., et al. 2011, arXiv e-prints, arXiv:1110.3193
2011 arXiv
-
[90]
N., et al
Lee, A., Wu, H.-Y., Salcedo, A. N., et al. 2024
2024
-
[91]
E., Le Brun , A
Lee , B. E., Le Brun , A. M. C., Haq , M. E., et al. 2018, , 479, 890
2018
-
[92]
J., & Sc \'o ccola , C
Leizerovich , M., Landau , S. J., & Sc \'o ccola , C. G. 2024, Physics Letters B, 855, 138844
2024
-
[93]
F., Marulli, F., Moscardini, L., et al
Lesci, G. F., Marulli, F., Moscardini, L., et al. 2022, , 659, A88
2022
- [94]
-
[95]
2012, arXiv e-prints, arXiv:1211.0310
LSST Dark Energy Science Collaboration . 2012, arXiv e-prints, arXiv:1211.0310
2012 arXiv
-
[96]
M., Seljak , U., et al
Mandelbaum , R., Hirata , C. M., Seljak , U., et al. 2005, , 361, 1287
2005
-
[97]
2018, , 481, 3170
Mandelbaum, R., Lanusse, F., Leauthaud, A., et al. 2018, , 481, 3170
2018
-
[98]
W., Ebeling , H., & Rapetti , D
Mantz , A., Allen , S. W., Ebeling , H., & Rapetti , D. 2008, , 387, 1179
2008
-
[99]
Mantz , A. B. 2019, , 485, 4863
2019
-
[100]
B., von der Linden , A., Allen , S
Mantz , A. B., von der Linden , A., Allen , S. W., et al. 2015, , 446, 2205
2015
-
[101]
N., Gruen , D., et al
McClintock , T., Varga , T. N., Gruen , D., et al. 2019, , 482, 1352
2019
-
[102]
2017, , 469, 4899–4920
Melchior, P., Gruen, D., McClintock, T., et al. 2017, , 469, 4899–4920
2017
- [103]
-
[104]
L., Farahi , A., Evrard , A
Mulroy , S. L., Farahi , A., Evrard , A. E., et al. 2019, , 484, 60
2019
-
[105]
2019, , 71, 107
Murata , R., Oguri , M., Nishimichi , T., et al. 2019, , 71, 107
2019
-
[106]
G., Artis, E., & Melin, J.-B
Murray, C., Bartlett, J. G., Artis, E., & Melin, J.-B. 2022, , 512, 4785
2022
-
[107]
2025, arXiv e-prints, arXiv:2506.06249
Myles , J., Gruen , D., Jeltema , T., et al. 2025, arXiv e-prints, arXiv:2506.06249
2025
-
[108]
B., et al
Myles , J., Gruen , D., Mantz , A. B., et al. 2021, , 505, 33
2021
-
[109]
F., Frenk , C
Navarro , J. F., Frenk , C. S., & White , S. D. M. 1997, , 490, 493
1997
-
[110]
Nord , B., Stanek , R., Rasia , E., & Evrard , A. E. 2008, , 383, L10
2008
-
[111]
2003, , 599, 7
Oguri, M., Lee, J., & Suto, Y. 2003, , 599, 7
2003
-
[112]
& Takada, M
Oguri, M. & Takada, M. 2011, , 83
2011
-
[113]
Oguri, M., Takada, M., Okabe, N., & Smith, G. P. 2010,
2010
-
[114]
2018, , 620, A10
Pacaud, F., Pierre, M., Melin, J.-B., et al. 2018, , 620, A10
2018
-
[115]
2023, , 518, 5171
Park , Y., Sunayama , T., Takada , M., et al. 2023, , 518, 5171
2023
-
[116]
2017, , 848, 114
Parroni , C., Mei , S., Erben , T., et al. 2017, , 848, 114
2017
-
[117]
2023, , 520, 6223
Payerne, C., Murray, C., Combet, C., et al. 2023, , 520, 6223
2023
-
[118]
2024, , 532, 381
Payerne , C., Murray , C., Combet , C., & Penna-Lima , M. 2024, , 532, 381
2024
-
[119]
2020, , 491, 1643
Phriksee , A., Jullo , E., Limousin , M., et al. 2020, , 491, 1643
2020
-
[120]
2014, , 571, A20
Planck Collaboration . 2014, , 571, A20
2014
-
[121]
2016 a , , 594, A24
Planck Collaboration . 2016 a , , 594, A24
2016
-
[122]
2016 b , , 594, A27
Planck Collaboration . 2016 b , , 594, A27
2016
-
[123]
Poisson , S. D. 1837, Bachelier, Imprimeur-Librairie
-
[124]
A., Cuesta, A
Prada, F., Klypin, A. A., Cuesta, A. J., Betancort-Rijo, J. E., & Primack, J. 2012, , 423, 3018
2012
-
[125]
S., Krause , E., Huang , H.-J., et al
Pranjal , R. S., Krause , E., Huang , H.-J., et al. 2023, , 524, 3324
2023
-
[126]
2023, The Open Journal of Astrophysics, 6, 13
Prat , J., Zuntz , J., Chang , C., et al. 2023, The Open Journal of Astrophysics, 6, 13
2023
-
[127]
W., Arnaud , M., Biviano , A., et al
Pratt , G. W., Arnaud , M., Biviano , A., et al. 2019, , 215, 25
2019
-
[128]
& Doux , C
Raveri , M. & Doux , C. 2021, , 104, 043504
2021
-
[129]
E., Rykoff , E
Rozo , E., Evrard , A. E., Rykoff , E. S., & Bartlett , J. G. 2014, , 438, 62
2014
-
[130]
S., Rozo, E., Busha, M
Rykoff, E. S., Rozo, E., Busha, M. T., et al. 2014, , 785, 104
2014
-
[131]
S., Rozo , E., Hollowood , D., et al
Rykoff , E. S., Rozo , E., Hollowood , D., et al. 2016, , 224, 1
2016
-
[132]
2014, , 571, A87
Sadibekova , T., Pierre , M., Clerc , N., et al. 2014, , 571, A87
2014
-
[133]
Sanderson, A. J. R. & Ponman, T. J. 2009, , 402, 65
2009
-
[134]
2015, , 454, 2305
Saro, A., Bocquet, S., Rozo, E., et al. 2015, , 454, 2305
2015
-
[135]
J., Malz , A
Schmidt , S. J., Malz , A. I., Soo , J. Y. H., et al. 2020, , 499, 1587
2020
-
[136]
D., Frenk, C
Schneider, M. D., Frenk, C. S., & Cole, S. 2012, , 2012, 030
2012
-
[137]
Schneider , P., Ehlers , J., & Falco , E. E. 1992, Gravitational Lenses
1992
-
[138]
2016, , 2016, 042
Sereno , M., Fedeli , C., & Moscardini , L. 2016, , 2016, 042
2016
-
[139]
Sheldon, E. S. & Huff, E. M. 2017, , 841, 24
2017
-
[140]
S., Johnston, D
Sheldon, E. S., Johnston, D. E., Frieman, J. A., et al. 2004, , 127, 2544
2004
-
[141]
K., Mo, H
Sheth, R. K., Mo, H. J., & Tormen, G. 2001, , 323, 1
2001
-
[142]
& Takada , M
Shirasaki , M. & Takada , M. 2018, , 478, 4277
2018
-
[143]
2017, , 466, 3103
Simet , M., McClintock , T., Mandelbaum , R., et al. 2017, , 466, 3103
2017
-
[144]
W., Schrabback , T., Applegate , D
Sommer , M. W., Schrabback , T., Applegate , D. E., et al. 2022, , 509, 1127
2022
-
[145]
2015, arXiv e-prints, arXiv:1503.03757
Spergel , D., Gehrels , N., Baltay , C., et al. 2015, arXiv e-prints, arXiv:1503.03757
2015 arXiv
-
[146]
2023, arXiv e-prints, arXiv:2309.13025
Sunayama , T., Miyatake , H., Sugiyama , S., et al. 2023, arXiv e-prints, arXiv:2309.13025
2023 arXiv
-
[147]
2020, , 496, 4468–4487
Sunayama, T., Park, Y., Takada, M., et al. 2020, , 496, 4468–4487
2020
-
[148]
L., Robertson , B
Tinker , J. L., Robertson , B. E., Kravtsov , A. V., et al. 2010, , 724, 878
2010
-
[149]
2020, , 28
Umetsu, K. 2020, , 28
2020
-
[150]
C., & Varoquaux , G
van der Walt , S., Colbert , S. C., & Varoquaux , G. 2011, Computing in Science and Engineering, 13, 22
2011
-
[151]
N., DeRose , J., Gruen , D., et al
Varga , T. N., DeRose , J., Gruen , D., et al. 2019, , 489, 2511
2019
-
[152]
Vogt , S. M. L., Bocquet , S., Davies , C. T., et al. 2024, arXiv e-prints, arXiv:2409.13556
2024 arXiv
-
[153]
S., et al
Wang, J., Bose, S., Frenk, C. S., et al. 2020, Nature, 585, 39
2020
-
[154]
H., Hildebrandt , H., van den Busch , J
Wright , A. H., Hildebrandt , H., van den Busch , J. L., & Heymans , C. 2020, , 637, A100
2020
-
[155]
2022, , 515, 4471
Wu, H.-Y., Costanzi, M., To, C.-H., et al. 2022, , 515, 4471
2022
-
[156]
H., Salcedo, A
Wu, H.-Y., Weinberg, D. H., Salcedo, A. N., Wibking, B. D., & Zu, Y. 2019, , 490, 2606
2019
-
[157]
L., et al
Zhang , Y., Jeltema , T., Hollowood , D. L., et al. 2019, , 487, 2578
2019
-
[158]
2024, [ [arXiv] 2310.18266 ]
Zhang , Z., Farahi , A., Nagai , D., et al. 2024, [ [arXiv] 2310.18266 ]
2024 arXiv
-
[159]
2023, , 523, 1994–2013
Zhang, Z., Wu, H.-Y., Zhang, Y., et al. 2023, , 523, 1994–2013
2023
-
[160]
N., et al
Zhou , C., Wu , H.-Y., Salcedo , A. N., et al. 2024, , 110, 103508
2024
-
[161]
1937, , 86, 217
Zwicky , F. 1937, , 86, 217
1937
-
[162]
, " * write output.state after.block = add.period write newline
ENTRY address archiveprefix author booktitle chapter edition editor howpublished institution eprint journal key month note number organization pages publisher school series title type volume year label extra.label sort.label short.list INTEGERS output.state before.all mid.sent...
-
[163]
write newline
" write newline "" before.all 'output.state := FUNCTION n.dashify 't := "" t empty not t #1 #1 substring "-" = t #1 #2 substring "--" = not "--" * t #2 global.max substring 't := t #1 #1 substring "-" = "-" * t #2 global.max substring 't := while if t #1 #1 substring * t #2 gl...
Reviewed August 8, 2026 · model on record in the stance chip above.
Discussion (0). Continue with ORCID to comment.