REVIEW 5 major objections 5 minor 47 references
Single-Pulse Morphology of PSR J1935+1616 (B1933+16) Based on archival data from FAST
T0 review · 5 major / 5 minor · reviewed 2026-08-07 · deepseek-v4-flash
Pith's one-line read Archival FAST observations of PSR J1935+1616 find that 9.69% of single pulses contain micropulses with a characteristic width of about 128 microseconds, that roughly half of those are quasi-periodic at about 232 microseconds, and that…
desk verdict A useful single-pulsar study with new FAST-era measurements, but the headline timescales rest on a detection pipeline that lacks null tests and sits near the resolution limit. read the letter →
The pith
A machine-rendered reading of the paper's core claim, the machinery that carries it, and where it could break.
The reading
What carries the argument
The machinery is a time-series decomposition of each single pulse: a fifth-order polynomial fit defines the smooth sub-pulse envelope, and subtracting it leaves a residual that should contain any microstructure. The residual is then characterized three ways: an autocorrelation function (ACF), whose slope break and oscillation troughs identify width and quasi-period; the power spectrum of the residual (PSD); and the power spectrum of the ACF derivative (ADP), whose Gaussian peaks give the quasi-frequency. The ACF slope break near 106.5 microseconds and the PSD/ADP peaks near 3.9 kHz are the observable signatures that convert raw intensities into the claimed width and quasi-period. Micropulse widths are assigned with the second central moment of each fluctuation. This chain is what carries the argument from raw intensity time series to the quoted timescales.
What would settle it
Re-analyze the same 9,998 FAST single pulses without the fifth-order polynomial envelope subtraction, using an alternative high-pass filter and an independent de-dispersion and RFI-excision chain: if the ACF slope break near 106.5 microseconds and the PSD/ADP peaks near 3.9 kHz disappear or shift by more than the quoted uncertainties, then the claimed micropulse width and quasi-period are artifacts of the processing chain. A faster-sampled follow-up observation, for example at 10-microsecond resolution, should resolve the same 127-microsecond widths and 232-microsecond periods if they are intrinsic.
Extended reading notes
Core claim
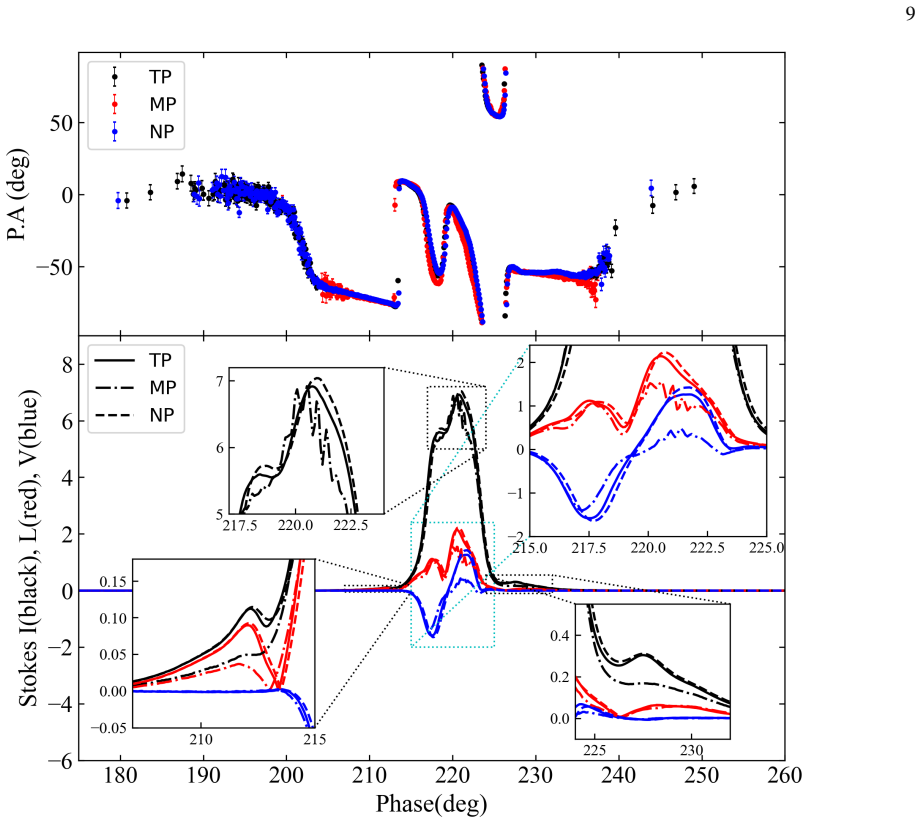
The paper's central discovery is that PSR J1935+1616, observed for one hour with FAST at 1250 MHz and 49.512-microsecond sampling, produces a population of single pulses whose sub-pulse envelopes contain short-timescale intensity fluctuations that are not noise. Using an established identification method, 969 of 9,998 pulses (9.69%) were classified as containing micropulses; their widths, measured by the second central moment of each fluctuation, follow a log-normal distribution with characteristic width $127.63^{+70.74}_{-46.25}$ microseconds. In 520 of these pulses the fluctuations are quasi-periodic, with a single-Gaussian period distribution centered at $231.77 \pm 9.90$ microseconds, and in 208 pulses the circular-polarization fluctuations are also quasi-periodic at $244.70^{+45.66}_{-21.05}$ microseconds. The pulses classified into morphological modes A through D differ in energy distribution: mode A follows a double Gaussian, while modes B, C, and D follow a single Gaussian; the fraction of micropulse-bearing pulses differs across modes, from 562 of 3893 in mode A down to 20 of 819 in mode D. The paper concludes that micropulse emission is a real, quasi-periodic emission component and that its occurrence is coupled to the pulsar's single-pulse morphology.
Load-bearing premise
The load-bearing premise is that after 49.512-microsecond sampling, de-dispersion, and radio-frequency-interference cleaning, the true short-timescale structure is not broadened or destroyed by scattering or smearing, and that the fifth-order polynomial smoothing plus ACF/PSD residual analysis neither creates nor suppresses the features.
Editorial extensions
If this is right
- If the claim is correct, the 127.63-microsecond width and 231.77-microsecond quasi-period are intrinsic to the pulsar's emission process, so any viable micropulse mechanism must produce these timescales at 1250 MHz.
- The measured quasi-period is shorter than the earlier $0.4 \pm 0.2$ ms reported at 1.5 and 4.5 GHz, implying that either the quasi-period is frequency-dependent or the earlier measurements were limited by coarser sampling.
- The waiting-time distribution of micropulse-bearing pulses is Weibull with shape $k = 0.66$, meaning micropulse production is clustered in time rather than following a simple Poisson process.
- Pulse-energy distributions separate cleanly: mode A and micropulse-bearing pulses show double-Gaussian energy, while modes B, C, and D show single-Gaussian energy, confirming that the four-mode morphological scheme captures a real physical distinction.
- The rarity of micropulses in mode D (20 of 819) and their prevalence in mode A (562 of 3893) implies that the same magnetospheric condition that suppresses the outer profile components also favors the production of microstructure.
Reading between the lines
- Extension beyond the paper: because the quoted 127.63-microsecond width is only about 2.6 times the 49.512-microsecond sampling interval, the true intrinsic widths may be narrower; a faster-sampled observation of J1935+1616 would test whether 127 microseconds is a resolution-broadened upper limit.
- Extension beyond the paper: the hint of phase-locked microstructure seen in the folded micropulse profile, if real, would be a new phenomenon; it could be tested by stacking many micropulse-selected pulses and checking whether the modulation phase is stable across rotation phases and observation epochs.
- Extension beyond the paper: searching FAST archive data at other radio frequencies for the 231.77-microsecond quasi-period would discriminate between a geometric origin, which should be frequency-independent, and a plasma-propagation origin, which should not.
Editorial analysis
A structured set of objections, weighed in public.
Referee Report
Summary. The paper analyzes 9,998 single pulses of PSR J1935+1616 from FAST archival data. It reports that 969 pulses (9.69%) contain micropulses with characteristic width 127.63(+70.74/-46.25) microsec, that 520 of these show quasi-periodic micropulses with period 231.77 +/- 9.90 microsec, and that micropulse occurrence is highest in morphological mode A and lowest in mode D. Additional results concern circular-polarization quasi-periodicity (244.70 microsec), single-pulse energy distributions described by single or double Gaussians, waiting-time statistics, and polarization fractions. The data reduction uses DSPSR/PSRCHIVE; the microstructure analysis is based on a fifth-order polynomial residual method with ACF/PSD analysis, as described in Sections 2 and 3.1.1.
Significance. If the timescale measurements are reliable, the paper would provide one of the few large-sample measurements of micropulse microstructure in a normal pulsar, plus a possible coupling between microstructure and single-pulse morphology. Strengths include the use of high-sensitivity FAST archival data, the large number of single pulses, the explicit data-processing description, and the presentation of quantitative distributions for widths, periods, energies, and polarization. The main caveat is that the short-timescale quantities are near the 49.512 microsec sampling limit and are not validated by noise-only or injection-recovery tests, so the central claim of intrinsic micropulse timescales is not yet fully supported.
major comments (5)
- [Section 3.1.1, Eq. (1)] The central claim that the observed residuals correspond to intrinsic micropulses is not validated. At 49.512 microsec sampling, the reported width of 127.63 microsec spans only ~2.6 samples and the reported quasi-period of 231.77 microsec spans ~4.7 samples. The fifth-order polynomial residual method can produce quasi-oscillatory residuals when fitting a smooth envelope to a three-component profile, and the paper gives no test on noise-only pulses, no injection-recovery of synthetic micropulses with known width and period, and no estimate of dispersion-smearing or scattering timescales at 1250 MHz. Without such controls, the measured width and period cannot be distinguished from an artifact of the smoothing procedure. Please add a null test using off-pulse noise and an injection-recovery test, and quantify the smearing timescales.
- [Section 3.1.1] The criterion for classifying a single pulse as containing micropulses is not defined quantitatively. The statement that 'The ACF curve of the residuals shows a change in slope at 106.5 microsec, indicating the presence of microstructures' is not an operational detection rule. The fraction 969/9998 is therefore not reproducible without the specific code and thresholds. Please specify the algorithm, including how a 'change in slope' is detected and how the 'significant periodic components' are identified in the PSD and ADP.
- [Section 3.2 / Table 3] The statement that normal pulses (NP) follow a single Gaussian energy distribution is inconsistent with Table 3, which lists S1 parameters for NP (A=0.0017, mu=0.4000, sigma=0.1200). Since the single- versus double-Gaussian distinction is a central result, the paper must report a formal model comparison (e.g., likelihood-ratio test or BIC) showing that the S1 component is insignificant for NP and significant for MP and mode A. Similarly, the phrase 'significantly different' for mode A versus other modes is not supported by any statistical test.
- [Section 3.1.1] The K-S test results are reported incorrectly. The text states 'Dn = 0.59 > 0.05 and P = 0 < 0.05', which compares the test statistic to the significance level rather than to the proper critical value, and the same issue occurs in the second K-S test. The test statistic should be compared to critical values that depend on the sample sizes, and p-values should be reported with a finite nonzero value or a clear threshold statement. Please redo these tests and state the sample sizes used.
- [Section 3.2 / Table 2] The claimed correlation between micropulse occurrence and morphological mode may be influenced by pulse brightness, because micropulse detection requires resolving short-timescale fluctuations and is easier in higher-S/N pulses. Mode A has a relatively strong central component and mode D has the weakest central component, so the trend in MP fractions could partly reflect S/N rather than a physical coupling. To support conclusion 4, please test whether the MP fraction depends on mode after matching single-pulse energy or by including energy as a covariate.
minor comments (5)
- [Section 3.1.3] The word 'tatol' should be 'total'.
- [Section 3.1.1] 'Fllowing' should be 'Following'; 'Usingthe first minimumminimal' should be rewritten as a complete phrase; and 'M_i is the the amplitude' contains a duplicated article.
- [Figure 6 caption] The caption says 'PSR J1933+1616' but the paper consistently refers to PSR J1935+1616.
- [Section 5 / Conclusion 1] The statement 'Approximately 5.20% of these single pulses with micropulses exhibit quasi-periodicity' is inconsistent with the numbers: 520 is 5.20% of the total 9,998 pulses, not of the 969 micropulse-containing pulses. The fraction of MP pulses with quasi-periodicity is about 53.7%.
- [Section 3.1.2] The high-pass filtering used to remove red noise is mentioned only briefly, without specifying the filter type or cutoff. Please provide enough detail for reproducibility.
Circularity Check
No significant circularity: micropulse measurements are direct statistics from FAST data; the only self-citation supplies the analysis recipe, not the result.
full rationale
The paper is descriptive and observational. The central quantities—969 pulses with microstructure (9.69%), characteristic width 127.63(+70.74/−46.25) µs, and quasi-period 231.77 ± 9.90 µs—are obtained by applying Eq. (1) and ACF/PSD analysis directly to the de-dispersed, RFI-cleaned single pulses. These measurements do not derive from a theoretical model, and they are not fitted to the same statistic they are claimed to predict. The mode classification (A, B, C, D) is defined independently of the micropulse detection: modes are based on the peak intensities of the leading (C1) and trailing (C3) components relative to 10×rms of the off-pulse, whereas MP classification is based on residual timescale structure after fifth-order polynomial smoothing. The reported MP occurrence fractions per mode (e.g., 562/3893 in mode A and 20/819 in mode D) are simple contingency counts, not quantities forced by the definitions. The only self-citation is to Zhao et al. (2023) for the analysis recipe ('Fllowing the method in Zhao et al. (2023)'), but that citation supplies a signal-processing procedure, not the empirical result, and the measured values are new and data-derived. Concerns about the 49.512 µs sampling time, dispersion smearing, or the residual method potentially creating artifacts are validity and robustness issues, not circularity: even if the analysis pipeline were flawed, the flaw would be an error, not a logical reduction of the conclusion to its inputs. The paper also checks consistency with prior independent measurements (e.g., Popov et al. 2002b's ~150 µs width), further supporting that the result is not defined into existence. Therefore the circularity score is low.
Assumptions & free parameters
free parameters (7)
- Quasi-periodic micropulse period in total intensity =
231.77 +/- 9.90 us
- Quasi-periodic micropulse period in circular polarization =
244.70 (+45.66/-21.05) us
- Micropulse characteristic width in total intensity =
127.63 (+70.74/-46.25) us
- QMP width from ACF first minimum =
97.63 +/- 10.42 us
- Micropulse characteristic width in circular polarization =
106.52 +/- 46.14 us
- Weibull waiting-time parameters =
k=0.66 +/- 0.02, beta=10.32 +/- 0.32, theta=1.69 +/- 0.09
- Energy distribution Gaussian components (S1/S2) =
MP S1: A=0.011, mu=0.48, sigma=0.10; S2: A=0.070, mu=0.97, sigma=0.168
assumptions (6)
- domain assumption Gaussian, log-normal, and Weibull functional forms describe the observed distributions of widths, periods, waiting times, and energies.
- domain assumption A 10-rms off-pulse threshold is a valid separator of the four single-pulse morphology modes.
- domain assumption Fifth-order polynomial smoothing separates the subpulse envelope from micropulse residuals without introducing timescales.
- domain assumption FAST data at 49.512 microsecond sampling and 1250 MHz are not significantly broadened by scattering or dispersion smearing at the measured timescales.
- domain assumption Off-pulse noise is Gaussian and the 3-rms threshold defines single-pulse energy.
- standard math DSPSR and PSRCHIVE correctly fold and calibrate the FAST search-mode data.
Cite this review
Pith. "Pith review of Single-Pulse Morphology of PSR J1935+1616 (B1933+16) Based on archival data from FAST." pith.science (2026). https://pith.science/paper/XA2ZVYLD
@misc{pith2026250209342,
  author       = {Pith},
  title        = {Pith review of: Single-Pulse Morphology of PSR J1935+1616 (B1933+16) Based on archival data from FAST},
  year         = {2026},
  howpublished = {\url{https://pith.science/paper/XA2ZVYLD}},
  note         = {Machine review of arXiv:2502.09342}
}
abstract
We utilized archived data from the Five-hundred-meter Aperture Spherical Radio Telescope (FAST) to analyze the single-pulse profile morphology of PSR J1935$+$1616 (B1933$+$16). The results show that PSR J1935$+$1616 exhibits significant micropulses as well as various changes in single-pulse profile morphology. In the FAST archived data, a total of 969 single pulses with microstructure were identified, accounting for 9.69$\%$ of the total pulse sample, with characteristic widths of $127.63^{+70.74}_{-46.25}$ $\mu$s. About half of these pulses display quasiperiodic micropulses, with a periodicity of 231.77 $\pm$ 9.90 $\mu$s. Among the 520 single pulses with quasiperiodic microstructure, 208 also exhibit quasiperiodicity in circular polarization, with a characteristic period of $244.70^{+45.66}_{-21.05}$ $\mu$s. The micropulse characteristic width in circular polarization is 106.52 $\pm$ 46.14 $\mu$s. Compared to normal pulses, the relative energy (E/<E>) of single pulse with microstructure follows a double Gaussian distribution, while that of normal pulses follows a single Gaussian distribution. Based on the intensity of the leading and trailing components in the single-pulse profile morphology of PSR J1935+1616, we classified the pulses into four morphological modes (A, B, C, and D). The relative energy distribution of pulses in mode A is significantly different from the others, following a double Gaussian distribution, while the relative energy distributions in modes B, C, and D follow a single Gaussian distribution. Our study also suggests a possible correlation between micropulses and single-pulse profile morphology. Single pulse with micropulses are most likely to occur in mode A, while their occurrence is least likely in mode D.
Figures


Figures from the paper (10 more)




Reference graph
Works this paper leans on
-
[1]
, " * write output.state after.block = add.period write newline
ENTRY address archivePrefix author booktitle chapter doi edition editor eprint howpublished institution journal key month number organization pages publisher school series title misctitle type volume year version url label extra.label sort.label short.list INTEGERS output.state before.all mid.sentence after.sentence after.block FUNCTION init.state.consts ...
-
[2]
write newline
" write newline "" before.all 'output.state := FUNCTION format.url url empty "" new.block "" url * "" * if FUNCTION format.eprint eprint empty "" archivePrefix empty "" archivePrefix "arXiv" = new.block " " eprint * " " * new.block " " eprint * " " * if if if FUNCTION format.doi doi empty "" " " doi * " " * if FUNCTION format.pid doi empty eprint empty ur...
-
[4]
Backer , D. C. 1970, , 228, 1297, 10.1038/2281297a0
-
[5]
Bartel , N., Morris , D., Sieber , W., & Hankins , T. H. 1982, , 258, 776, 10.1086/160125
doi:10.1086/160125 1982
-
[6]
Basu, R., Mitra, D., & Melikidze, G. I. 2023, The Astrophysical Journal, 959, 92
work page 2023
-
[7]
Boriakoff , V., Ferguson , D. C., & Slater , G. 1981, in Pulsars: 13 Years of Research on Neutron Stars, ed. W. Sieber & R. Wielebinski , Vol. 95, 199--204
work page 1981
-
[8]
1982, Astronomical Journal, vol
Burstein, D., & Heiles, C. 1982, Astronomical Journal, vol. 87, Aug. 1982, p. 1165-1189. NSF-supported research., 87, 1165
work page 1982
-
[9]
Chen , J. L., Wen , Z. G., Hao , L. F., et al. 2020, , 899, 118, 10.3847/1538-4357/aba2e8
Show all 47 references
-
[10]
Chian , A. C. L., & Kennel , C. F. 1983, , 97, 8
1983
-
[11]
M., Weisberg , J
Cordes , J. M., Weisberg , J. M., & Hankins , T. H. 1990, , 100, 1882, 10.1086/115644
1990 doi
-
[12]
H., Eilek , J
Crossley , J. H., Eilek , J. A., Hankins , T. H., & Kern , J. S. 2010, , 722, 1908, 10.1088/0004-637X/722/2/1908
2010 doi
- [13]
-
[14]
1982, Astronomy and Astrophysics, vol
Fowler, L., & Wright, G. 1982, Astronomy and Astrophysics, vol. 109, no. 2, May 1982, p. 279-281. Research supported by the Alexander von Humboldt-Stiftung and Universitaet Bonn., 109, 279
1982
-
[15]
A., & Snakowski , J
Gil , J. A., & Snakowski , J. K. 1990, , 234, 237
1990
-
[16]
2003, Nature, 422, 141
Hankins, T., Kern, J., Weatherall, J., & Eilek, J. 2003, Nature, 422, 141
2003
-
[17]
Hankins , T. H. 1971, , 169, 487, 10.1086/151164
1971 doi
- [18]
- [19]
-
[20]
W., van Straten , W., & Manchester , R
Hotan , A. W., van Straten , W., & Manchester , R. N. 2004, , 21, 302, 10.1071/AS04022
2004 doi
-
[21]
2002, , 334, 523, 10.1046/j.1365-8711.2002.05478.x
Kramer , M., Johnston , S., & van Straten , W. 2002, , 334, 523, 10.1046/j.1365-8711.2002.05478.x
2002
-
[22]
D., Hamilton , P
Kuzmin , A. D., Hamilton , P. A., Shitov , Y. P., et al. 2003, , 344, 1187, 10.1046/j.1365-8711.2003.06900.x
2003
-
[23]
1998, , 332, 111
Lange , C., Kramer , M., Wielebinski , R., & Jessner , A. 1998, , 332, 111
1998
-
[24]
2018, IEEE Microwave Magazine, 19, 112, 10.1109/MMM.2018.2802178
Li , D., Wang , P., Qian , L., et al. 2018, IEEE Microwave Magazine, 19, 112, 10.1109/MMM.2018.2802178
2018
-
[25]
1971, Monthly Notices of the Royal Astronomical Society, 153, 27P
Lyne, A. 1971, Monthly Notices of the Royal Astronomical Society, 153, 27P
1971
-
[26]
2012, Pulsar astronomy No
Lyne, A., & Graham-Smith, F. 2012, Pulsar astronomy No. 48 (Cambridge University Press)
2012
-
[27]
G., & Manchester , R
Lyne , A. G., & Manchester , R. N. 1988, , 234, 477, 10.1093/mnras/234.3.477
1988 doi
-
[28]
N., Hobbs , G
Manchester , R. N., Hobbs , G. B., Teoh , A., & Hobbs , M. 2005, , 129, 1993, 10.1086/428488
2005 doi
-
[29]
J., Bhat , N
McSweeney , S. J., Bhat , N. D. R., Swainston , N. A., et al. 2022, , 933, 210, 10.3847/1538-4357/ac75bc
2022 doi
-
[30]
Mitra , D., Arjunwadkar , M., & Rankin , J. M. 2015, , 806, 236, 10.1088/0004-637X/806/2/236
2015 doi
-
[31]
2016, , 460, 3063, 10.1093/mnras/stw1186
Mitra , D., Rankin , J., & Arjunwadkar , M. 2016, , 460, 3063, 10.1093/mnras/stw1186
2016 doi
-
[32]
1981, Monthly Notices of the Royal Astronomical Society, 194, 7P
Morris, D., Graham, D., & Bartel, N. 1981, Monthly Notices of the Royal Astronomical Society, 194, 7P
1981
-
[33]
2011, International Journal of Modern Physics D, 20, 989, 10.1142/S0218271811019335
Nan , R., Li , D., Jin , C., et al. 2011, International Journal of Modern Physics D, 20, 989, 10.1142/S0218271811019335
2011 doi
-
[34]
Petrova , S. A. 2004, , 424, 227, 10.1051/0004-6361:20047171
2004 doi
-
[35]
V., Bartel , N., Cannon , W
Popov , M. V., Bartel , N., Cannon , W. H., et al. 2002 a , , 396, 171, 10.1051/0004-6361:20021402
2002 doi
-
[36]
2002 b , Astronomy Reports, 46, 206, 10.1134/1.1463098
---. 2002 b , Astronomy Reports, 46, 206, 10.1134/1.1463098
2002 doi
-
[37]
Rankin , J. M. 1983, , 274, 359, 10.1086/161451
1983 doi
-
[38]
2022, Monthly Notices of the Royal Astronomical Society, 509, 2507
Rejep, R., Wang, N., Yan, W., & Wen, Z. 2022, Monthly Notices of the Royal Astronomical Society, 509, 2507
2022
-
[39]
2023, Monthly Notices of the Royal Astronomical Society, 527, 2612, 10.1093/mnras/stad3334
Singh, S., Gupta, Y., & De, K. 2023, Monthly Notices of the Royal Astronomical Society, 527, 2612, 10.1093/mnras/stad3334
2023 doi
-
[40]
2022, Research in Astronomy and Astrophysics, 22, 075013, 10.1088/1674-4527/ac71a5
Tong, H., & Wang, H.-G. 2022, Research in Astronomy and Astrophysics, 22, 075013, 10.1088/1674-4527/ac71a5
2022 doi
-
[41]
2011, , 28, 1, 10.1071/AS10021
van Straten , W., & Bailes , M. 2011, , 28, 1, 10.1071/AS10021
2011 doi
-
[42]
2007, Monthly Notices of the Royal Astronomical Society, 377, 1383
Wang, N., Manchester, R., & Johnston, S. 2007, Monthly Notices of the Royal Astronomical Society, 377, 1383
2007
-
[43]
2016, Astronomy & Astrophysics, 592, A127
Wen, Z., Wang, N., Yuan, J., et al. 2016, Astronomy & Astrophysics, 592, A127
2016
-
[44]
G., Yuen , R., Wang , N., et al
Wen , Z. G., Yuen , R., Wang , N., et al. 2021, , 918, 57, 10.3847/1538-4357/ac0e90
2021 doi
-
[45]
Wheatland , M. S. 2000, in AAS/Solar Physics Division Meeting, Vol. 31, AAS/Solar Physics Division Meeting \#31, 02.56
2000
-
[46]
X., Liu , J
Xu , R. X., Liu , J. F., Han , J. L., & Qiao , G. J. 2000, , 535, 354, 10.1086/308824
2000 doi
-
[47]
2022, Research in Astronomy and Astrophysics, 22, 124002, 10.1088/1674-4527/ac98f7
Zhang , Y.-K., Wang , P., Feng , Y., et al. 2022, Research in Astronomy and Astrophysics, 22, 124002, 10.1088/1674-4527/ac98f7
2022 doi
-
[48]
2023, , 521, 2298, 10.1093/mnras/stad590
Zhao , R., Li , D., Hobbs , G., et al. 2023, , 521, 2298, 10.1093/mnras/stad590
2023 doi
Reviewed August 7, 2026 · model on record in the stance chip above.
Discussion (0). Continue with ORCID to comment.