Non-negative tensor factorization-based dependence map analysis for local damage detection in presence of non-Gaussian noise
Pith reviewed 2026-05-23 02:43 UTC · model grok-4.3
The pith
Factorizing dependence maps with non-negative tensor factorization extracts informative frequency bands for bearing damage detection amid non-Gaussian noise.
A machine-rendered reading of the paper's core claim, the machinery that carries it, and where it could break.
Core claim
The method constructs dependence maps from time-frequency representations of the signal and applies non-negative tensor factorization to a tensor formed by multiple such maps. This process decomposes the data into informative and non-informative parts, with the informative parts corresponding to frequency bands that reveal local damage in the bearings.
What carries the argument
Non-negative tensor factorization of a collection of dependence maps, where each map encodes the auto-similarity structure of spectral content in the time-frequency plane.
If this is right
- Informative frequency bands can be isolated even when non-Gaussian disturbances are present.
- The extracted bands enable local damage detection in rolling element bearings.
- The method handles overlapping fault signatures in the signals.
- Validation occurs on both synthetic signals and real vibration data.
Where Pith is reading between the lines
- The technique might reduce the need for expert intervention in setting frequency band thresholds during monitoring.
- It could extend to other types of machinery where vibration analysis is used for fault detection.
- Combining this with other tensor methods might improve robustness under varying operating conditions.
Load-bearing premise
The auto-similarity patterns captured in dependence maps are distinct enough between damage-related content and non-informative noise that factorization can reliably separate them.
What would settle it
A test where the extracted components from NTF on dependence maps of a damaged bearing signal do not show higher energy or correlation at the known fault characteristic frequencies compared to a healthy signal.
Figures


read the original abstract
The time-frequency map (TFM) is frequently used in condition monitoring, necessitating further processing to select an informative frequency band (IFB) or directly detect damage. However, selecting an IFB is challenging due to the complexity of spectral structures, non-Gaussian disturbances, and overlapping fault signatures in vibration signals. Additionally, dynamic operating conditions and low signal-to-noise ratio further complicate the identification of relevant features that indicate damage. To solve this problem, the present work proposes a novel method for informative band selection and local damage detection in rolling element bearings, utilizing non-negative tensor factorization (NTF)-based dependence map analysis. The recently introduced concept of the dependence map is leveraged, with a set of these maps being factorized to separate informative components from non-informative ones. Dependence maps provide valuable information on the auto-similarity of spectral content, while NTF, a powerful tool commonly used in image processing for feature extraction, enhances this process. The combination of these methods allows for the extraction of IFBs, forming the basis for local damage detection. The effectiveness of the proposed method has been validated using both synthetic and real vibration signals corrupted with non-Gaussian disturbances.
Editorial analysis
A structured set of objections, weighed in public.
Referee Report
Summary. The paper proposes a method for informative frequency band (IFB) selection and local damage detection in rolling element bearings that applies non-negative tensor factorization (NTF) to a collection of dependence maps derived from time-frequency representations of vibration signals. The approach is presented as a way to separate informative from non-informative components even when non-Gaussian disturbances and overlapping fault signatures are present. Effectiveness is asserted on the basis of validation experiments performed on both synthetic and real vibration signals.
Significance. If the central claim holds, the combination of dependence-map construction with NTF factorization could supply a practical route to IFB extraction under realistic noise conditions that are difficult for conventional spectral methods. The manuscript does not, however, supply the quantitative evidence, baseline comparisons, or implementation details needed to evaluate whether that potential is realized.
major comments (1)
- [Abstract] Abstract: the claim that the method 'has been validated using both synthetic and real vibration signals' is presented without any accompanying quantitative results, error metrics, comparison baselines, or description of the experimental protocol, rendering the central effectiveness claim impossible to assess from the supplied text.
Simulated Author's Rebuttal
We thank the referee for the comment on the abstract. We respond below.
read point-by-point responses
-
Referee: [Abstract] Abstract: the claim that the method 'has been validated using both synthetic and real vibration signals' is presented without any accompanying quantitative results, error metrics, comparison baselines, or description of the experimental protocol, rendering the central effectiveness claim impossible to assess from the supplied text.
Authors: The abstract provides a high-level summary of the validation. Detailed quantitative results (including detection accuracy, false positive rates under non-Gaussian noise), error metrics, baseline comparisons (e.g., against spectral kurtosis and other IFB methods), and full experimental protocols appear in Sections 4 (synthetic signals) and 5 (real bearing data) of the manuscript. We will revise the abstract to incorporate key quantitative highlights and a brief protocol description. revision: yes
Circularity Check
No significant circularity
full rationale
The provided abstract and context describe a novel methodological proposal that combines dependence maps with non-negative tensor factorization (NTF) to extract informative frequency bands (IFBs) for damage detection. No equations, derivations, or load-bearing steps are shown that reduce any claimed result to a fitted parameter, self-definition, or self-citation chain. The central claim is presented as an empirical validation on synthetic and real signals rather than a mathematical reduction to inputs by construction. This matches the default expectation for papers without exhibited circularity.
Axiom & Free-Parameter Ledger
axioms (1)
- domain assumption Dependence maps provide valuable information on the auto-similarity of spectral content
Reference graph
Works this paper leans on
-
[1]
R. B. Randall, J. Antoni, Rolling element bearing diagnostics - a tutorial, Mechanical Systems and Signal Processing 25 (2) (2011) 485–520
work page 2011
- [2]
-
[3]
J. Antoni, Fast computation of the kurtogram for the detection of transient faults, Mechanical Systems and Signal Processing 21 (1) (2007) 108–124
work page 2007
-
[4]
D. Wang, W. T. Peter, K. L. Tsui, An enhanced Kurtogram method for fault diagnosis of rolling element bearings, Mechanical Systems and Signal Processing 35 (1-2) (2013) 176–199
work page 2013
-
[5]
W. T. Peter, D. Wang, The design of a new sparsogram for fast bearing fault diagnosis: Part 1 of the two related manuscripts that have a joint title as “Two automatic vibration-based fault diagnostic methods using the novel sparsity measurement–Parts 1 and 2”, Mechanical Systems and Signal Processing 40 (2) (2013) 499–519
work page 2013
-
[6]
T. Wang, Q. Han, F. Chu, Z. Feng, A new skrgram based demodulation technique for planet bearing fault detection, Journal of Sound and Vibration 385 (2016) 330–349
work page 2016
-
[7]
Z. Liu, Y . Jin, M. J. Zuo, D. Peng, Accugram: A novel approach based on classification to frequency band selection for rotating machinery fault diagnosis, ISA Transactions 95 (2019) 346–357
work page 2019
-
[8]
A. Moshrefzadeh, A. Fasana, The Autogram: An effective approach for selecting the optimal demodulation band in rolling element bearings diagnosis, Mechanical Systems and Signal Processing 105 (2018) 294–318
work page 2018
-
[9]
A. Mauricio, W. A. Smith, R. B. Randall, J. Antoni, K. Gryllias, Improved envelope spectrum via feature optimisation-gram (iesfogram): A novel tool for rolling element bearing diagnostics under non-stationary oper- ating conditions, Mechanical Systems and Signal Processing 144 (2020) 106891
work page 2020
-
[10]
K. Wu, N. Chu, D. Wu, J. Antoni, The Enkurgram: A characteristic frequency extraction method for fluid machinery based on multi-band demodulation strategy, Mechanical Systems and Signal Processing 155 (2021) 107564
work page 2021
-
[11]
G. Yu, C. Li, J. Zhang, A new statistical modeling and detection method for rolling element bearing faults based on alpha-stable distribution, Mechanical Systems and Signal Processing 41 (1-2) (2013) 155 – 175
work page 2013
-
[12]
Y . Miao, M. Zhao, J. Lin, Improvement of kurtosis-guided-grams via gini index for bearing fault feature identi- fication, Measurement Science and Technology 28 (12) (2017) 125001
work page 2017
-
[13]
J. Hebda-Sobkowicz, R. Zimroz, M. Pitera, A. Wyłoma ´nska, Informative frequency band selection in the pres- ence of non-gaussian noise – a novel approach based on the conditional variance statistic with application to bearing fault diagnosis, Mechanical Systems and Signal Processing 145 (2020) 106971
work page 2020
-
[14]
J. Wodecki, A. Michalak, R. Zimroz, Optimal filter design with progressive genetic algorithm for local damage detection in rolling bearings, Mechanical Systems and Signal Processing 102 (2018) 102–116
work page 2018
-
[15]
J. Antoni, The infogram: Entropic evidence of the signature of repetitive transients, Mechanical Systems and Signal Processing 74 (2016) 73–94
work page 2016
-
[16]
D. Wang, An extension of the infograms to novel Bayesian inference for bearing fault feature identification, Mechanical Systems and Signal Processing 80 (2016) 19–30
work page 2016
-
[17]
J. Hebda-Sobkowicz, R. Zimroz, A. Wyłoma ´nska, J. Antoni, Infogram performance analysis and its enhance- ment for bearings diagnostics in presence of non-gaussian noise, Mechanical Systems and Signal Processing 170 (2022) 108764
work page 2022
- [18]
-
[19]
P. Borghesani, J. Antoni, CS2 analysis in presence of non-Gaussian background noise – E ffect on traditional estimators and resilience of log-envelope indicators, Mechanical Systems and Signal Processing 90 (2017) 378– 398
work page 2017
-
[20]
A. Mauricio, J. Qi, W. Smith, M. Sarazin, R. Randall, K. Janssens, K. Gryllias, Bearing diagnostics under strong electromagnetic interference based on Integrated Spectral Coherence, Mechanical Systems and Signal Processing 140 (2020) 106673
work page 2020
-
[21]
J. Hebda-Sobkowicz, R. Zimroz, A. Wyłoma´nska, Selection of the informative frequency band in a bearing fault 30 diagnosis in the presence of non-Gaussian noise – comparison of recently developed methods, Applied Sciences 10 (8) (2020) 2657
work page 2020
-
[22]
P. Kruczek, R. Zimroz, A. Wyłoma´nska, How to detect the cyclostationarity in heavy-tailed distributed signals, Signal Processing 172 (2020) 107514
work page 2020
-
[23]
N. Zhou, Y . Cheng, Z. Wang, B. Chen, W. Zhang, C ffsgram: A candidate fault frequencies-based optimal demodulation band selection method for axle-box bearing fault diagnosis, Measurement 207 (2023) 112368
work page 2023
-
[24]
L. Cui, X. Zhao, D. Liu, H. Wang, A spectral coherence cyclic periodic index optimization-gram for bearing fault diagnosis, Measurement 224 (2024) 113898
work page 2024
-
[25]
Y . Yang, R. Xie, M. Li, W. Cheng, A review on the application of blind source separation in vibration analysis of mechanical systems, Measurement (2024) 114241
work page 2024
-
[26]
J. Allen, Short term spectral analysis, synthesis, and modification by discrete Fourier transform, IEEE Transac- tions on Acoustics, Speech, and Signal Processing 25 (3) (1977) 235–238
work page 1977
-
[27]
F. Millioz, N. Martin, Circularity of the STFT and spectral kurtosis for time-frequency segmentation in gaussian environment, IEEE Trans. Signal Process. 59 (2) (2011) 515–524
work page 2011
-
[28]
J. Huillery, F. Millioz, N. Martin, On the description of spectrogram probabilities with a chi-squared law, IEEE Transactions on Signal Processing 56 (6) (2008) 2249–2258
work page 2008
-
[29]
J. Wodecki, A. Michalak, R. Zimroz, T. Barszcz, A. Wyłoma ´nska, Impulsive source separation using combi- nation of nonnegative matrix factorization of bi-frequency map, spatial denoising and monte carlo simulation, Mechanical Systems and Signal Processing 127 (2019) 89–101
work page 2019
-
[30]
J. Wodecki, A. Michalak, R. Zimroz, A. Wyłoma´nska, Separation of multiple local-damage-related components from vibration data using nonnegative matrix factorization and multichannel data fusion, Mechanical Systems and Signal Processing 145 (2020) 106954
work page 2020
-
[31]
J. Wodecki, A. Michalak, R. Zimroz, Local damage detection based on vibration data analysis in the presence of gaussian and heavy-tailed impulsive noise, Measurement 169 (2021) 108400
work page 2021
- [32]
-
[33]
D. D. Lee, H. S. Seung, Learning the parts of objects by non-negative matrix factorization, nature 401 (6755) (1999) 788–791
work page 1999
-
[34]
C. Wang, M. Gan, et al., Non-negative emd manifold for feature extraction in machinery fault diagnosis, Mea- surement 70 (2015) 188–202
work page 2015
- [35]
-
[36]
X. Wang, Y . Cai, A. Li, W. Zhang, Y . Yue, A. Ming, Intelligent fault diagnosis of diesel engine via adaptive vmd-rihaczek distribution and graph regularized bi-directional nmf, Measurement 172 (2021) 108823
work page 2021
-
[37]
A. Shashua, T. Hazan, Non-negative tensor factorization with applications to statistics and computer vision, in: Proc. of the 22-th International Conference on Machine Learning, Bonn, Germany, 2005
work page 2005
-
[38]
J. D. Carroll, G. De Soete, S. Pruzansky, Fitting of the latent class model via iteratively reweighted least squares candecomp with nonnegativity constraints, in: Multiway data analysis, 1989, pp. 463–472
work page 1989
-
[39]
D. FitzGerald, M. Cranitch, E. Coyle, Extended nonnegative tensor factorisation models for musical sound source separation, Comput Intell Neurosci 872425 (2008) 1–15
work page 2008
-
[40]
M. Figueiredo, B. Ribeiro, A. de Almeida, Electrical signal source separation via nonnegative tensor factor- ization using on site measurements in a smart home, IEEE Transactions on Instrumentation and Measurement 63 (2) (2014) 364–373
work page 2014
- [41]
- [42]
- [43]
-
[44]
D. Zhao, D. Shao, L. Cui, Ctnet: A data-driven time-frequency technique for wind turbines fault diagnosis under time-varying speeds, ISA Transactions 154 (2024) 335 – 351. 31
work page 2024
-
[45]
D. Zhao, H. Wang, L. Cui, Frequency-chirprate synchrosqueezing-based scaling chirplet transform for wind turbine nonstationary fault feature time–frequency representation, Mechanical Systems and Signal Processing 209 (2024) 111112
work page 2024
-
[46]
J. Nowicki, J. Hebda-Sobkowicz, R. Zimroz, A. Wyłoma ´nska, Dependency measures for the diagnosis of local faults in application to the heavy-tailed vibration signal, Applied Acoustics 178 (2021) 107974
work page 2021
-
[47]
J. Wodecki, A. Michalak, A. Wyłoma ´nska, R. Zimroz, Influence of non-gaussian noise on the e ffectiveness of cyclostationary analysis–simulations and real data analysis, Measurement 171 (2021) 108814
work page 2021
- [48]
-
[49]
M. Ye, X. Yan, N. Chen, M. Jia, Intelligent fault diagnosis of rolling bearing using variational mode extraction and improved one-dimensional convolutional neural network, Applied Acoustics 202 (2023) 109143
work page 2023
-
[50]
P. Wißbrock, Z. Ren, D. Pelkmann, More than spectrograms: Deep representation learning for machinery fault detection, Applied Acoustics 225 (2024) 110178
work page 2024
-
[51]
T. Han, L. Zhang, Z. Yin, A. C. Tan, Rolling bearing fault diagnosis with combined convolutional neural net- works and support vector machine, Measurement: Journal of the International Measurement Confederation 177 (2021) 109022
work page 2021
-
[52]
X. Li, H. Shao, S. Lu, J. Xiang, B. Cai, Highly e fficient fault diagnosis of rotating machinery under time- varying speeds using LSISMM and small infrared thermal images, IEEE Transactions on Systems, Man, and Cybernetics: Systems 52 (12) (2022) 7328 – 7340
work page 2022
-
[53]
J. Luo, H. Shao, J. Lin, B. Liu, Meta-learning with elastic prototypical network for fault transfer diagnosis of bearings under unstable speeds, Reliability Engineering and System Safety 245 (2024) 110001
work page 2024
-
[54]
A. Cichocki, R. Zdunek, A. H. Phan, S.-i. Amari, Nonnegative matrix and tensor factorizations: applications to exploratory multi-way data analysis and blind source separation, John Wiley & Sons, 2009
work page 2009
-
[55]
T. G. Kolda, B. W. Bader, Tensor decompositions and applications, SIAM Review 51 (3) (2009) 455–500
work page 2009
-
[56]
Z. Feng, M. Liang, F. Chu, Recent advances in time–frequency analysis methods for machinery fault diagnosis: a review with application examples, Mechanical Systems and Signal Processing 38 (1) (2013) 165–205
work page 2013
-
[57]
B. Boashash, Time-frequency signal analysis and processing: a comprehensive reference, Academic press, 2015
work page 2015
-
[58]
O. J. Dunn, V . A. Clark, Basic statistics: a primer for the biomedical sciences, John Wiley & Sons, 2009
work page 2009
-
[59]
M. W. Berry, M. Browne, A. N. Langville, V . P. Pauca, R. J. Plemmons, Algorithms and applications for ap- proximate nonnegative matrix factorization, Computational statistics & data analysis 52 (1) (2007) 155–173
work page 2007
-
[60]
S. Sra, I. Dhillon, Generalized nonnegative matrix approximations with bregman divergences, Advances in neural information processing systems 18 (2005)
work page 2005
-
[61]
P. H. Westfall, Kurtosis as peakedness, 1905–2014. r.i.p., The American Statistician 68 (3) (2014) 191–195
work page 1905
- [62]
-
[63]
C. Pachaud, R. Salvetat, C. Fray, Crest factor and kurtosis contributions to identify defects inducing periodical impulsive forces, Mechanical Systems and Signal Processing 11 (6) (1997) 903–916
work page 1997
-
[64]
T. Barszcz, A. Jabło ´nski, A novel method for the optimal band selection for vibration signal demodulation and comparison with the kurtogram, Mechanical Systems and Signal Processing 25 (1) (2011) 431 – 451
work page 2011
-
[65]
G. Samoradnitsky, Stable Non-Gaussian Random Processes: Stochastic Models with Infinite Variance, Chapman & Hall, 1994
work page 1994
-
[66]
J. H. McCulloch, Simple consistent estimators of stable distribution parameters, Communications in Statistics- Simulation and Computation 15 (4) (1986) 1109–1136
work page 1986
-
[67]
P. Jaworski, M. Pitera, The 20-60-20 rule., Discrete & Continuous Dynamical Systems-Series B 21 (4) (2016)
work page 2016
- [68]
-
[69]
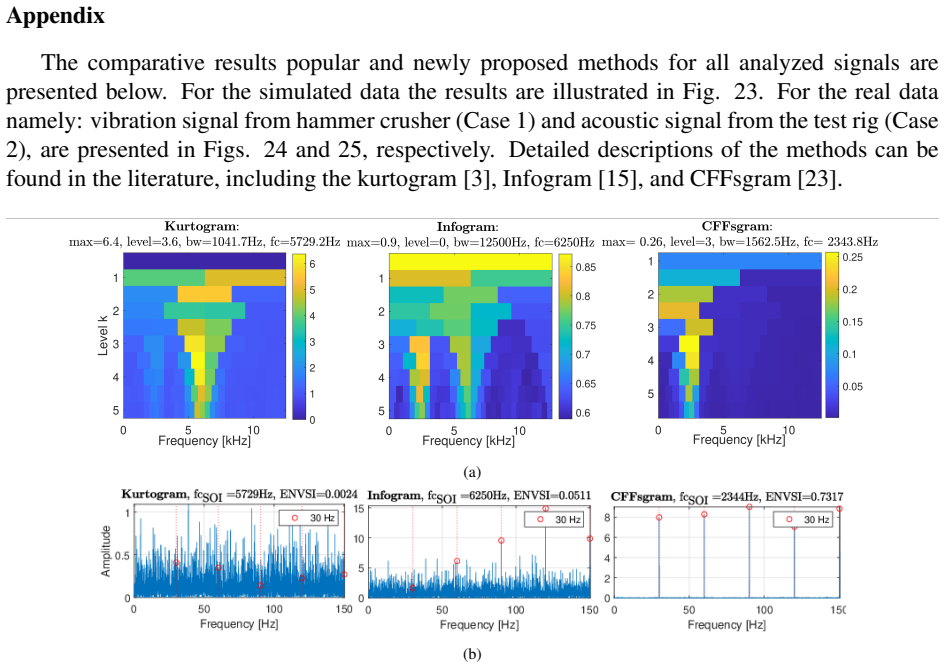
A. Wyłoma ´nska, R. Zimroz, J. Janczura, J. Obuchowski, Impulsive noise cancellation method for copper ore crusher vibration signals enhancement, IEEE Transactions on Industrial Electronics 63 (9) (2016) 5612–5621. 32 Appendix The comparative results popular and newly proposed methods for all analyzed signals are presented below. For the simulated data th...
work page 2016
discussion (0)
Sign in with ORCID, Apple, or X to comment. Anyone can read and Pith papers without signing in.