Relationship between the γ-ray variability and the pc-scale jet in the blazar 3C 454.3
Pith reviewed 2026-05-23 01:44 UTC · model grok-4.3
The pith
Flux variations in the 43 GHz and 15 GHz cores of 3C 454.3 account for 37% and 30% of its gamma-ray variability.
A machine-rendered reading of the paper's core claim, the machinery that carries it, and where it could break.
Core claim
Core emission at 43 GHz contributes around 37% of the observed gamma-ray variability while the 15 GHz core accounts for 30%. A quasi-stationary component at 43 GHz, at a projected distance of 4.6 pc, correlates with the gamma-ray flux and accounts for 20% of its emission between 2016 and 2021. A mobile component at 43 GHz with projected distance 0.8-2.3 pc and apparent velocity 9.9c accounts for approximately 28%. Simultaneous variability in regions beyond the central parsec indicates synchrotron self-Compton as the primary gamma-ray production mechanism. The findings demonstrate multiple gamma-ray emission regions within the blazar jet, some of which are non-stationary over time.
What carries the argument
Spearman rank correlations between the measured radio flux densities of resolved VLBI jet components and the gamma-ray light curve.
If this is right
- The radio core at both frequencies is directly tied to a large share of the high-energy output.
- Gamma-ray production via synchrotron self-Compton occurs at projected distances of several parsecs from the central engine.
- Both stationary and moving jet features can serve as gamma-ray emission sites at different epochs.
- The jet contains multiple independent gamma-ray production zones whose relative importance changes with time.
Where Pith is reading between the lines
- Continued radio monitoring of the core could provide an early indicator of upcoming gamma-ray activity in this source.
- The presence of both stationary and moving contributors suggests that emission sites can form, persist, or dissipate on yearly timescales.
- Similar correlation studies on other flat-spectrum radio quasars may reveal whether multi-zone gamma-ray production is common.
Load-bearing premise
That measured correlations between the radio fluxes of specific jet components and the gamma-ray light curve indicate those components are physically producing portions of the gamma rays.
What would settle it
A new observing campaign in which the gamma-ray flux changes by a large factor while the radio fluxes of the core and the identified components remain constant.
Figures


read the original abstract
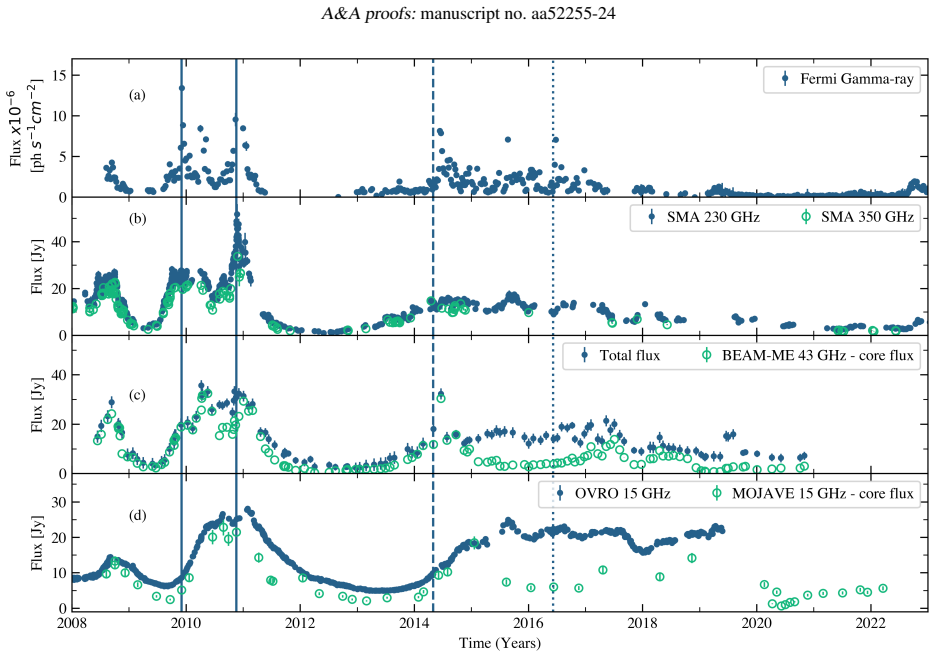
3C 454.3 is a flat spectrum radio quasar (FSRQ) known for its high variability across the electromagnetic spectrum, showing structural and flux variability in its pc-scale jet, and correlated variability among frequency bands. This study aims to identify the structure, dynamics, and radiative processes common to the innermost regions of the blazar 3C 454.3. We investigate whether any jet component can be associated with $\gamma-$ray emission and variability. We analyze the relationship between the variable $\gamma-$ray emission and pc-scale jet properties in 3C 454.3 by combining $\gamma-$ray data spanning twelve years with contemporaneous VLBA multi-epoch images at 15 and 43 GHz. Spearman rank correlation tests are conducted to determine if the flux variability of any jet component is associated with $\gamma-$ray variability. Core emission at 43 and 15 GHz strongly correlates with $\gamma-$ray emission. The 43 GHz core (Q0) contributes around 37$\%$ of the observed $\gamma-$ray variability, while the 15 GHz core (K0) accounts for 30$\%$. A quasi-stationary component at 43 GHz, at a projected distance of 4.6 pc, correlates with the $\gamma-$ray flux, accounting for 20$\%$ of its emission between 2016 and 2021. We found a mobile component (Q3 between 2010.18 and 2011.16) at 43 GHz with a projected distance between 0.8 and 2.3 pc and apparent velocity of $\beta_{app} = 9.9 \pm 1.1$ c, accounting for approximately 28% of the $\gamma-$ray emission. The observed simultaneous variability in emission regions beyond the central parsec strongly suggests synchrotron self-Compton (SSC) as the primary mechanism for $\gamma-$ray production in these regions. Our findings demonstrate the existence of multiple $\gamma-$ray emission regions within the blazar jet but also suggest that some of these regions are non-stationary over time.
Editorial analysis
A structured set of objections, weighed in public.
Referee Report
Summary. The manuscript examines the connection between γ-ray variability over 12 years and pc-scale jet structure in the FSRQ 3C 454.3 by cross-correlating Fermi light curves with multi-epoch VLBA imaging at 15 and 43 GHz. It reports strong Spearman rank correlations for the cores (Q0 at 43 GHz and K0 at 15 GHz) and two additional components, directly assigning fractional contributions to γ-ray variability (37% for Q0, 30% for K0, 20% for a quasi-stationary feature at 4.6 pc, and 28% for mobile component Q3) and infers multiple emission regions with SSC as the dominant mechanism beyond the central parsec.
Significance. If the conversion from Spearman coefficients to explicit fractional contributions can be placed on a statistically justified footing with uncertainties and robustness tests, the result would provide concrete evidence for spatially distinct γ-ray production sites within the jet, advancing models of blazar high-energy emission.
major comments (2)
- [Abstract] Abstract: the statements that Q0 'contributes around 37%' and K0 'accounts for 30%' of the observed γ-ray variability equate detected Spearman correlations with quantitative fractional contributions without any stated derivation, formula, regression method, or handling of time lags; this mapping is load-bearing for the central claim of specific component contributions.
- [Abstract] Abstract: the attributions of 20% (quasi-stationary component, 2016–2021) and 28% (Q3, 2010.18–2011.16) likewise lack error estimates, discussion of component identification robustness, or correction for multiple testing, undermining the inference of multiple non-stationary emission regions.
minor comments (1)
- [Abstract] The abstract uses 'contributes' and 'accounts for' interchangeably for the percentages; a single consistent phrasing would improve clarity.
Simulated Author's Rebuttal
We thank the referee for the constructive report and for highlighting the need for greater clarity in the abstract. The concerns about equating Spearman correlations directly to fractional contributions are well-taken; the abstract as written does not supply the required derivation or statistical details. We will revise the abstract accordingly while preserving the core scientific findings from the full analysis.
read point-by-point responses
-
Referee: [Abstract] Abstract: the statements that Q0 'contributes around 37%' and K0 'accounts for 30%' of the observed γ-ray variability equate detected Spearman correlations with quantitative fractional contributions without any stated derivation, formula, regression method, or handling of time lags; this mapping is load-bearing for the central claim of specific component contributions.
Authors: We agree that the abstract should not present these percentages without indicating how they were obtained from the Spearman coefficients. The main text contains the correlation analysis, but the conversion to explicit fractional contributions is not explained in the abstract. We will revise the abstract to remove or qualify the specific percentage values and ensure the main text supplies the full statistical procedure, including any regression or lag-handling methods used. revision: yes
-
Referee: [Abstract] Abstract: the attributions of 20% (quasi-stationary component, 2016–2021) and 28% (Q3, 2010.18–2011.16) likewise lack error estimates, discussion of component identification robustness, or correction for multiple testing, undermining the inference of multiple non-stationary emission regions.
Authors: We concur that error estimates, robustness tests for component identification, and multiple-testing corrections are necessary for these quantitative claims. We will revise the abstract to avoid unsubstantiated percentage attributions for the quasi-stationary feature and Q3, relocating any such results to the main text where uncertainties and robustness checks can be presented in full. This revision will not alter the overall conclusion of multiple emission regions but will place the supporting evidence on firmer statistical ground. revision: yes
Circularity Check
No circularity: claims rest on direct statistical comparisons of independent datasets
full rationale
The abstract describes performing Spearman rank correlation tests on fluxes from VLBA jet components (at 15 and 43 GHz) against an external Fermi gamma-ray light curve. The reported percentages (37%, 30%, 20%, 28%) are presented as direct outcomes of those correlations without any equations, fitted parameters, self-citations, or ansatzes that would reduce the output to the input by construction. No derivation chain is shown that equates a result to its own definition or renames a known pattern; the analysis is therefore self-contained against external benchmarks.
Axiom & Free-Parameter Ledger
Lean theorems connected to this paper
-
IndisputableMonolith/Cost/FunctionalEquation.leanwashburn_uniqueness_aczel unclear?
unclearRelation between the paper passage and the cited Recognition theorem.
Spearman rank correlation tests... The 43 GHz core (Q0) contributes around 37% of the observed γ-ray variability... Q3... accounting for approximately 28% of the γ-ray emission.
-
IndisputableMonolith/Foundation/AlexanderDuality.leanalexander_duality_circle_linking unclear?
unclearRelation between the paper passage and the cited Recognition theorem.
Core emission at 43 and 15 GHz strongly correlates with γ-ray emission... quasi-stationary component at 43 GHz, at a projected distance of 4.6 pc
What do these tags mean?
- matches
- The paper's claim is directly supported by a theorem in the formal canon.
- supports
- The theorem supports part of the paper's argument, but the paper may add assumptions or extra steps.
- extends
- The paper goes beyond the formal theorem; the theorem is a base layer rather than the whole result.
- uses
- The paper appears to rely on the theorem as machinery.
- contradicts
- The paper's claim conflicts with a theorem or certificate in the canon.
- unclear
- Pith found a possible connection, but the passage is too broad, indirect, or ambiguous to say the theorem truly supports the claim.
Reference graph
Works this paper leans on
-
[1]
A., Ackermann, M., Ajello, M., et al
Abdo, A. A., Ackermann, M., Ajello, M., et al. 2010, ApJS, 188, 405
work page 2010
-
[2]
A., Ackermann, M., Ajello, M., et al
Abdo, A. A., Ackermann, M., Ajello, M., et al. 2011, ApJ, 733, L26
work page 2011
-
[3]
Abdollahi, S., Acero, F., Baldini, L., et al. 2022, ApJS, 260, 53
work page 2022
-
[4]
Ackermann, M., Ajello, M., Baldini, L., et al. 2010, ApJ, 721, 1383
work page 2010
-
[5]
Ackermann, M., Anantua, R., Asano, K., et al. 2016, ApJ, 824, L20
work page 2016
-
[6]
Agudo, I., Marscher, A. P., Jorstad, S. G., et al. 2011, ApJ, 735, L10
work page 2011
-
[7]
1997, in Astrophysics and Space Science Library, V ol
Alexander, T. 1997, in Astrophysics and Space Science Library, V ol. 218, Astro- nomical Time Series, ed. D. Maoz, A. Sternberg, & E. M. Leibowitz, 163 Amaya-Almazán, R. A., Chavushyan, V ., & Patiño-Álvarez, V . M. 2021, ApJ, 906, 5
work page 1997
-
[8]
Angel, J. R. P. & Stockman, H. S. 1980, ARA&A, 18, 321 Astropy Collaboration, Price-Whelan, A. M., Sip˝ocz, B. M., et al. 2018, AJ, 156, 123 Astropy Collaboration, Robitaille, T. P., Tollerud, E. J., et al. 2013, A&A, 558, A33
work page 1980
-
[9]
Bloom, S. D. & Marscher, A. P. 1996, ApJ, 461, 657
work page 1996
-
[10]
Boccardi, B., Krichbaum, T. P., Ros, E., & Zensus, J. A. 2017, A&A Rev., 25, 4
work page 2017
-
[11]
Chavushyan, V ., Patiño-Álvarez, V . M., Amaya-Almazán, R. A., & Carrasco, L. 2020, ApJ, 891, 68
work page 2020
-
[12]
Dermer, C. D. & Schlickeiser, R. 1993, ApJ, 416, 458
work page 1993
-
[13]
Fan, J. H., Kurtanidze, S. O., Liu, Y ., et al. 2021, ApJS, 253, 10
work page 2021
-
[14]
M., Perucho, M., Ros, E., et al
Fromm, C. M., Perucho, M., Ros, E., et al. 2011, A&A, 531, A95
work page 2011
-
[15]
Fuhrmann, L., Larsson, S., Chiang, J., et al. 2014, MNRAS, 441, 1899
work page 2014
- [16]
-
[17]
Gurwell, M. A., Peck, A. B., Hostler, S. R., Darrah, M. R., & Katz, C. A. 2007, in Astronomical Society of the Pacific Conference Series, V ol. 375, From Z-Machines to ALMA: (Sub)Millimeter Spectroscopy of Galaxies, ed. A. J
work page 2007
-
[18]
A., Rani, B., Lee, S.-S., et al
Hodgson, J. A., Rani, B., Lee, S.-S., et al. 2018, MNRAS, 475, 368
work page 2018
- [19]
- [20]
-
[21]
Jorstad, S. G., Marscher, A. P., Larionov, V . M., et al. 2010, ApJ, 715, 362
work page 2010
-
[22]
Jorstad, S. G., Marscher, A. P., Lister, M. L., et al. 2005, AJ, 130, 1418
work page 2005
-
[23]
Jorstad, S. G., Marscher, A. P., Mattox, J. R., et al. 2001, ApJ, 556, 738
work page 2001
-
[24]
Jorstad, S. G., Marscher, A. P., Morozova, D. A., et al. 2017, ApJ, 846, 98
work page 2017
-
[25]
Jorstad, S. G., Marscher, A. P., Smith, P. S., et al. 2013, ApJ, 773, 147 Lähteenmäki, A. & Valtaoja, E. 2003, ApJ, 590, 95 León-Tavares, J., Chavushyan, V ., Patiño-Álvarez, V ., et al. 2013, ApJ, 763, L36 León-Tavares, J., Valtaoja, E., Tornikoski, M., Lähteenmäki, A., & Nieppola, E. 2011, A&A, 532, A146
work page 2013
- [26]
- [27]
- [28]
- [29]
- [30]
-
[31]
Marscher, A. P. & Gear, W. K. 1985, ApJ, 298, 114
work page 1985
-
[32]
Marscher, A. P., Jorstad, S. G., Larionov, V . M., et al. 2010, ApJ, 710, L126
work page 2010
-
[33]
P., Waters, B., Schiebel, D., Young, W., & Golap, K
McMullin, J. P., Waters, B., Schiebel, D., Young, W., & Golap, K. 2007, in As- tronomical Society of the Pacific Conference Series, V ol. 376, Astronomical Data Analysis Software and Systems XVI, ed. R. A. Shaw, F. Hill, & D. J. Bell, 127
work page 2007
- [34]
-
[35]
Ogle, P. M., Wehrle, A. E., Balonek, T., & Gurwell, M. A. 2011, ApJS, 195, 19
work page 2011
-
[36]
Paraschos, G. F., Mpisketzis, V ., Kim, J. Y ., et al. 2023, A&A, 669, A32 Patiño-Álvarez, V . M., Dzib, S. A., Lobanov, A., & Chavushyan, V . 2019, A&A, 630, A56 Patiño-Álvarez, V . M., Fernandes, S., Chavushyan, V ., et al. 2018, MNRAS, 479, 2037
work page 2023
-
[37]
Pauliny-Toth, I. I. K., Porcas, R. W., Zensus, J. A., et al. 1987, Nature, 328, 778
work page 1987
-
[38]
2018, ApJ, 856, 99 Planck Collaboration, Ade, P
Pittori, C., Lucarelli, F., Verrecchia, F., et al. 2018, ApJ, 856, 99 Planck Collaboration, Ade, P. A. R., Aghanim, N., et al. 2014, A&A, 571, A16
work page 2018
-
[39]
Ramakrishnan, V ., Hovatta, T., Nieppola, E., et al. 2015, MNRAS, 452, 1280
work page 2015
-
[40]
L., Max-Moerbeck, W., Pavlidou, V ., et al
Richards, J. L., Max-Moerbeck, W., Pavlidou, V ., et al. 2011, ApJS, 194, 29
work page 2011
- [41]
- [42]
-
[43]
Sikora, M., Moderski, R., & Madejski, G. M. 2008, ApJ, 675, 71
work page 2008
-
[44]
Traianou, E., Krichbaum, T. P., Gómez, J. L., et al. 2024, A&A, 682, A154
work page 2024
-
[45]
2011, ApJ, 736, L38 Villicaña-Pedraza, I., Carreto-Parra, F., Carramiñana, A., & Saucedo-Morales, J
Vercellone, S., Striani, E., Vittorini, V ., et al. 2011, ApJ, 736, L38 Villicaña-Pedraza, I., Carreto-Parra, F., Carramiñana, A., & Saucedo-Morales, J. 2016, Galaxies, 5, 3
work page 2011
-
[46]
Weaver, Z. R., Balonek, T. J., Jorstad, S. G., et al. 2019, ApJ, 875, 15 Article number, page 9 of 9
work page 2019
discussion (0)
Sign in with ORCID, Apple, or X to comment. Anyone can read and Pith papers without signing in.