Clustered Flexible Calibration Plots For Binary Outcomes Using Random Effects Modeling
Pith reviewed 2026-05-23 00:25 UTC · model grok-4.3
The pith
Random effects modeling produces flexible calibration plots with confidence and prediction intervals that account for clustering across centers or datasets in binary outcome prediction models.
A machine-rendered reading of the paper's core claim, the machinery that carries it, and where it could break.
Core claim
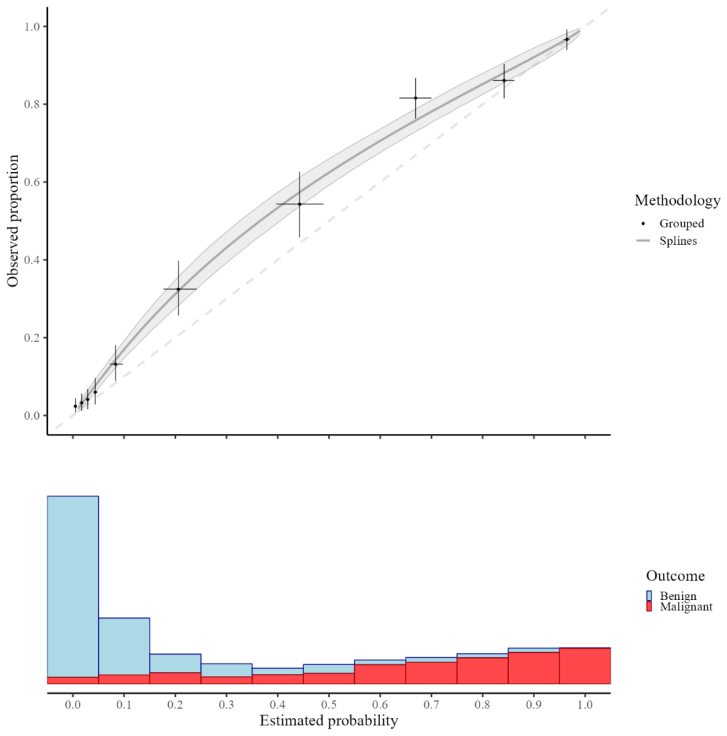
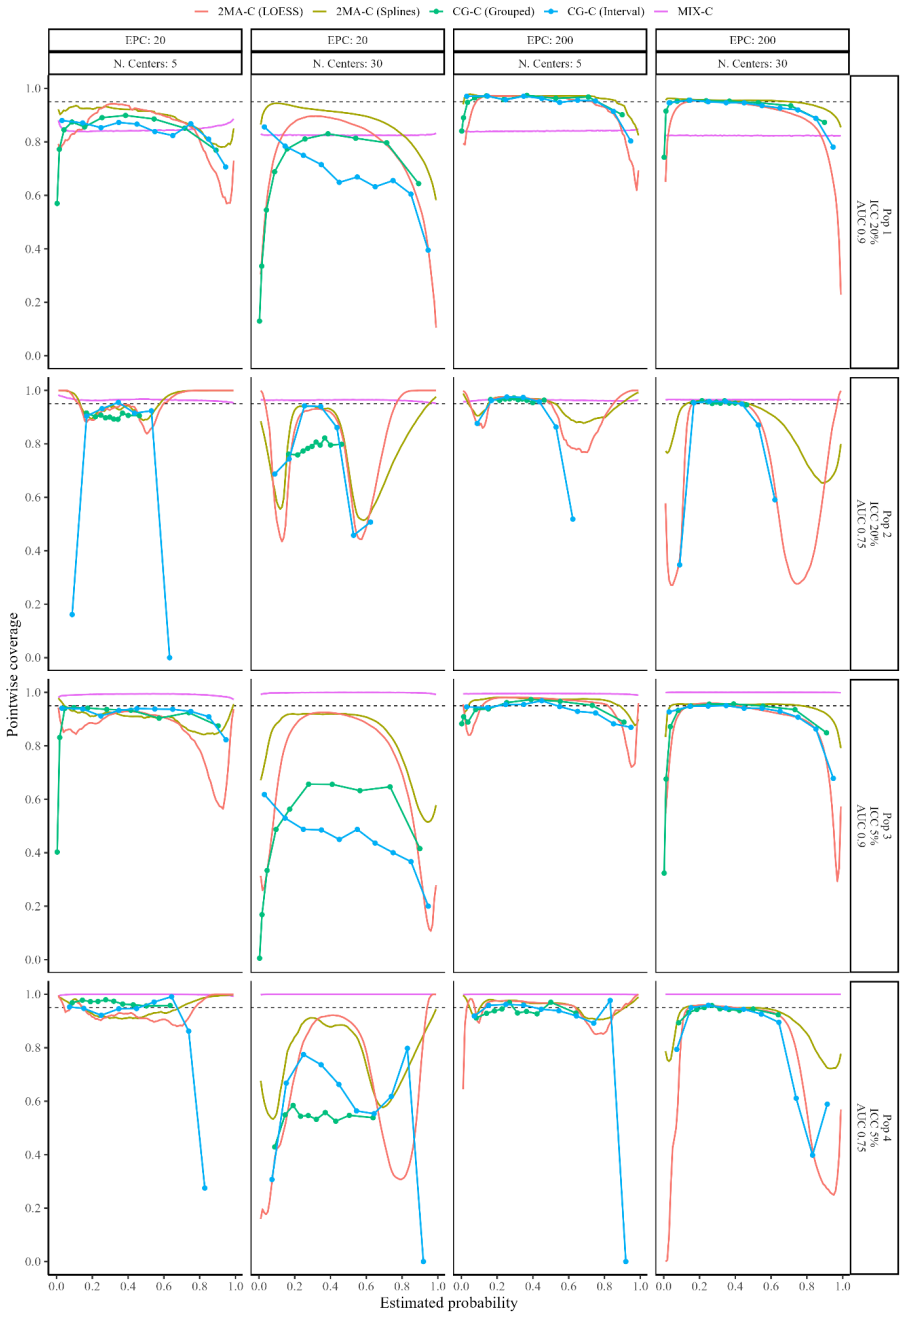
The paper establishes that clustered group calibration, two-stage meta-analysis calibration, and mixed model calibration can obtain flexible calibration plots with random effects modeling and provide confidence and prediction intervals; simulations indicate that two-stage meta-analysis calibration with splines estimates the overall curve and 95% prediction interval closest to truth while mixed model calibration produces cluster-specific curves closest to truth, leading to the recommendation of these two approaches especially when sample size per cluster is limited.
What carries the argument
The three approaches (clustered group calibration, two-stage meta-analysis calibration, and mixed model calibration) that use random effects to model heterogeneity across clusters while fitting flexible calibration curves.
If this is right
- Calibration assessment in external validation of prediction models can incorporate between-center variation instead of assuming a single overall curve.
- Prediction intervals can be reported that reflect uncertainty due to both sampling and clustering.
- Cluster-specific calibration curves become available even when individual centers have small sample sizes.
- Ready-to-use code allows direct application of the recommended methods to new datasets.
- Heterogeneity in calibration can be visualized and quantified across centers or datasets.
Where Pith is reading between the lines
- The methods could be applied to settings with a moderate number of clusters to decide whether a single overall model suffices or center-specific adjustments are needed.
- Comparison of these random-effects plots against standard non-clustered calibration plots on the same data would quantify how often clustering changes conclusions about model performance.
- The approaches might support model updating by identifying which clusters show systematic over- or under-prediction.
- Extension to non-binary outcomes would require adapting the random-effects structure but could follow the same two-stage or mixed-model logic.
Load-bearing premise
The random-effects distributional assumptions, typically normality of cluster-specific intercepts and slopes, adequately capture the heterogeneity in calibration across centers.
What would settle it
A new simulation or real multi-center dataset with known non-normal cluster heterogeneity or extreme between-cluster differences where the recommended methods fail to recover the true overall or cluster-specific calibration curves.
Figures
read the original abstract
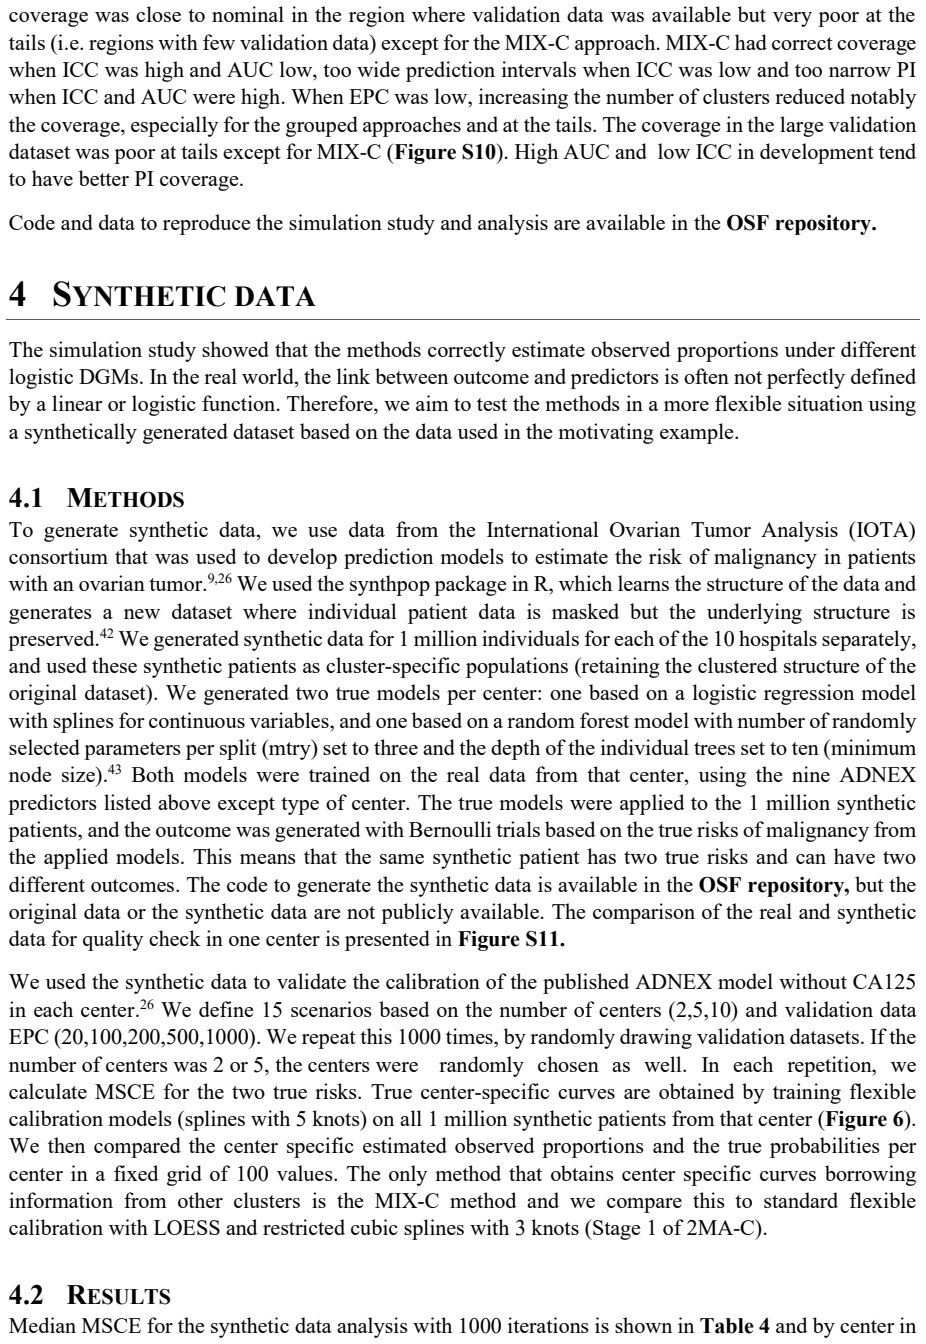
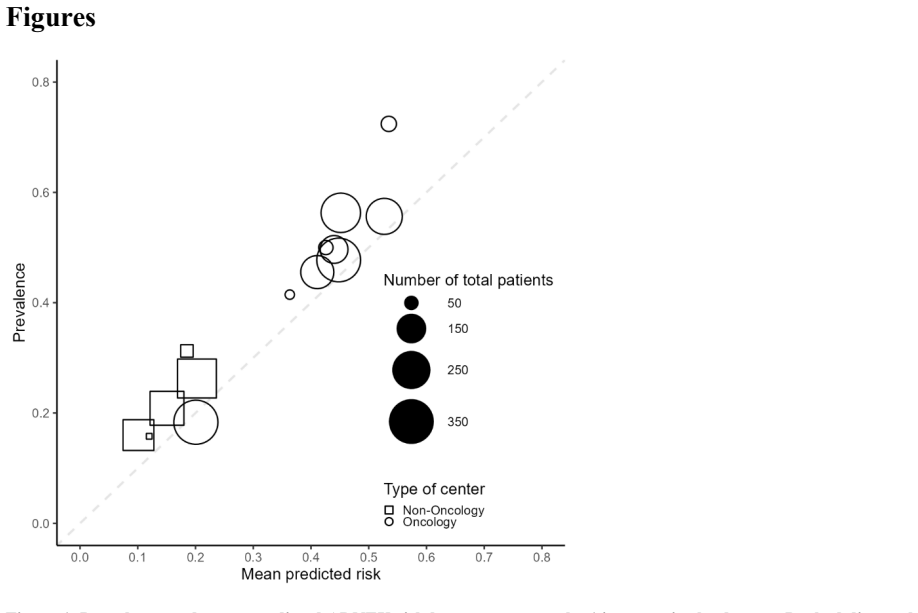
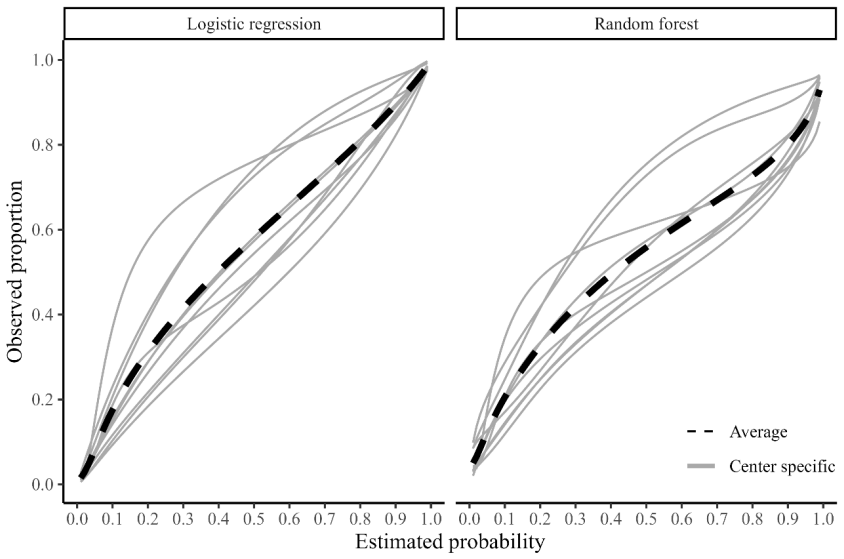
Evaluation of clinical prediction models across multiple clusters, whether centers or datasets, is becoming increasingly common. A comprehensive evaluation includes an assessment of the agreement between the estimated risks and the observed outcomes, also known as calibration. Calibration is of utmost importance for clinical decision making with prediction models and it may vary between clusters. We present three approaches to take clustering into account when evaluating calibration. (1) Clustered group calibration (CG-C), (2) two-stage meta-analysis calibration (2MA-C) and (3) mixed model calibration (MIX-C) can obtain flexible calibration plots with random effects modelling and providing confidence and prediction intervals. As a case example, we externally validate a model to estimate the risk that an ovarian tumor is malignant in multiple centers (N = 2489). We also conduct a simulation study and synthetic data study generated from a true clustered dataset to evaluate the methods. In the simulation study MIX-C and 2MA-C (splines) gave estimated curves closest to the true overall curve. In the synthetic data study MIX-C produced cluster specific curves closest to the truth. Coverage of the prediction interval across the plot was best for 2MA-C with splines. We recommend using 2MA-C with splines to estimate the overall curve and the 95% PI and MIX-C for the cluster specific curves, especially when sample size per cluster is limited. We provide ready-to-use code to construct summary flexible calibration curves with confidence and prediction intervals to assess heterogeneity in calibration across datasets or centers.
Editorial analysis
A structured set of objections, weighed in public.
Referee Report
Summary. The paper introduces three random-effects-based methods (CG-C, 2MA-C, and MIX-C) for constructing flexible calibration plots for binary outcomes that account for clustering across centers or datasets. It evaluates these via a case study on ovarian tumor malignancy risk (N=2489), a simulation study, and a synthetic-data study generated from a real clustered dataset, concluding that 2MA-C with splines performs best for the overall curve and 95% prediction interval while MIX-C is preferable for cluster-specific curves, especially with small per-cluster samples. Ready-to-use code is provided.
Significance. If the performance claims hold under realistic conditions, the work supplies practical, implementable tools for multi-center calibration assessment that incorporate both confidence and prediction intervals while quantifying heterogeneity. The provision of ready-to-use code is a clear strength that lowers the barrier to adoption.
major comments (2)
- [simulation study] Simulation study (as described in the abstract and methods): data are generated exactly under the normal random-effects model for cluster-specific intercepts and slopes. No sensitivity analyses are reported for non-normal heterogeneity (e.g., t-distributed random effects or finite mixtures), which is common in multi-center data. Because the reported superiority of 2MA-C coverage and MIX-C cluster-curve accuracy rests on these correctly-specified simulations, the practical recommendation may not generalize when the distributional assumption fails.
- [synthetic data study] Synthetic data study: the data-generating process is described as coming from a true clustered dataset, but the manuscript does not state whether the random-effects distribution used for data generation matches the normality assumption of the fitted models or includes misspecification checks. This directly affects the strength of the claim that MIX-C produces cluster-specific curves closest to the truth.
minor comments (2)
- [abstract] The abstract states that MIX-C and 2MA-C (splines) gave curves closest to the true overall curve, but does not quantify the metric (e.g., integrated squared error) or report variability across replications.
- [methods] Notation for the three methods (CG-C, 2MA-C, MIX-C) is introduced without an explicit comparison table of their modeling assumptions, computational requirements, and interval types.
Simulated Author's Rebuttal
We thank the referee for their constructive comments on our manuscript. We address each major comment below and agree that clarifying the data-generating processes and adding sensitivity analyses will improve the robustness of our evaluations.
read point-by-point responses
-
Referee: [simulation study] Simulation study (as described in the abstract and methods): data are generated exactly under the normal random-effects model for cluster-specific intercepts and slopes. No sensitivity analyses are reported for non-normal heterogeneity (e.g., t-distributed random effects or finite mixtures), which is common in multi-center data. Because the reported superiority of 2MA-C coverage and MIX-C cluster-curve accuracy rests on these correctly-specified simulations, the practical recommendation may not generalize when the distributional assumption fails.
Authors: We agree that the primary simulation study generates data under the normal random-effects assumption matching the fitted models, and no sensitivity analyses for non-normal heterogeneity (such as t-distributions or mixtures) were included. This is a valid limitation for generalizability. We will add a new subsection with sensitivity simulations under t-distributed random effects (df=3) and a two-component mixture to assess whether the relative performance of 2MA-C and MIX-C holds under misspecification. These results will be reported alongside the original findings. revision: yes
-
Referee: [synthetic data study] Synthetic data study: the data-generating process is described as coming from a true clustered dataset, but the manuscript does not state whether the random-effects distribution used for data generation matches the normality assumption of the fitted models or includes misspecification checks. This directly affects the strength of the claim that MIX-C produces cluster-specific curves closest to the truth.
Authors: We acknowledge that the manuscript does not explicitly describe the random-effects distribution in the synthetic data generation step. The synthetic data were derived by resampling from an empirical real clustered dataset (ovarian tumor data), so the underlying heterogeneity reflects observed (likely non-normal) patterns rather than an imposed normal distribution. We will revise the methods section to state this explicitly, clarify that this serves as a partial check against normality assumptions, and note any limitations in the discussion. revision: yes
Circularity Check
No significant circularity; methods evaluated against independent simulation truth and real data
full rationale
The paper defines CG-C, 2MA-C and MIX-C approaches using standard random-effects modeling for clustered calibration, then evaluates performance via a simulation study (data generated from known models) and a real multi-center ovarian tumor validation dataset (N=2489). No equation or recommendation reduces a claimed prediction to a fitted parameter by construction, nor imports uniqueness via self-citation chains. The derivation chain is self-contained against external benchmarks, consistent with the reader's assessment of score 2.0.
Axiom & Free-Parameter Ledger
free parameters (1)
- cluster-specific random-effect variances
axioms (1)
- domain assumption Random effects (intercepts and slopes) are normally distributed
Reference graph
Works this paper leans on
-
[1]
Advanced methods in meta -analysis: multivariate approach and meta-regression
van Houwelingen HC, Arends LR, Stijnen T. Advanced methods in meta -analysis: multivariate approach and meta-regression. Stat Med. 2002;21(4):589-624. doi:10.1002/sim.1040
-
[2]
A random -effects regression model for meta- analysis
Berkey CS, Hoaglin DC, Mosteller F, Colditz GA. A random -effects regression model for meta- analysis. Stat Med. 1995;14(4):395-411. doi:10.1002/sim.4780140406
-
[3]
Reitsma JB, Glas AS, Rutjes AWS, Scholten RJPM, Bossuyt PM, Zwinderman AH. Bivariate analysis of sensitivity and specificity produces informative summary measures in diagnostic reviews. J Clin Epidemiol. 2005;58(10):982-990. doi:10.1016/j.jclinepi.2005.02.022
-
[4]
Interpretation of random effects meta -analyses
Riley RD, Higgins JPT, Deeks JJ. Interpretation of random effects meta -analyses. BMJ. 2011;342:d549. doi:10.1136/bmj.d549
-
[5]
Methods to estimate the between‐study variance and its uncertainty in meta ‐ analysis
Veroniki AA, Jackson D, Viechtbauer W, et al. Methods to estimate the between‐study variance and its uncertainty in meta ‐ analysis. Res Synth Methods . 2016;7(1):55 -79. doi:10.1002/jrsm.1164
-
[6]
Schwarzer G, Carpenter JR, Rücker G. Meta-Analysis with R . Cham: Springer International Publishing; 2015. doi:10.1007/978-3-319-21416-0
-
[7]
Snell KI, Ensor J, Debray TP, Moons KG, Riley RD. Meta -analysis of prediction model performance across multiple studies: Which scale helps ensure between -study normality for the C-statistic and calibration measures? Stat Methods Med Res . 2018;27(11):3505 -3522. doi:10.1177/0962280217705678
-
[8]
A re -evaluation of random-effects meta-analysis
Higgins JPT, Thompson SG, Spiegelhalter DJ. A re -evaluation of random-effects meta-analysis. J R Stat Soc Ser A Stat Soc. 2009;172(1):137-159. doi:10.1111/j.1467-985X.2008.00552.x
-
[9]
Partlett C, Riley RD. Random effects meta -analysis: Coverage performance of 95% confidence and prediction intervals following REML estimation. Stat Med . 2017;36(2):301 -317. doi:10.1002/sim.7140
-
[10]
Prediction intervals for random -effects meta-analysis: A confidence distribution approach
Nagashima K, Noma H, Furukawa TA. Prediction intervals for random -effects meta-analysis: A confidence distribution approach. Stat Methods Med Res . 2019;28(6):1689 -1702. doi:10.1177/0962280218773520
-
[11]
Skipka G. The inclusion of the estimated inter-study variation into forest plots for random effects meta-analyses – a suggestion for a graphical representation. https://abstracts.cochrane.org/2006 - dublin/inclusion-estimated-inter-study-variation-forest-plots-random-effects-meta-analyses. Published 2006
work page 2006
-
[12]
Van Calster B, Valentin L, Froyman W, et al. Validation of models to diagnose ovarian cancer in patients managed surgically or conservatively: multicentre cohort study. BMJ. 2020;370:m2614. doi:10.1136/bmj.m2614
discussion (0)
Sign in with ORCID, Apple, or X to comment. Anyone can read and Pith papers without signing in.