Mitigating Financial Risk from Climate-Induced Agricultural Price Volatility
Pith reviewed 2026-05-22 22:19 UTC · model grok-4.3
The pith
Meteorological data from climate projections refines forecasts of crop price volatility for more accurate insurance pricing.
A machine-rendered reading of the paper's core claim, the machinery that carries it, and where it could break.
Core claim
The paper claims that CMIP6 meteorological projections, when used as exogenous inputs in SARIMAX forecasts of EGARCH-estimated price volatility, produce more reliable forward-looking volatility measures than models without them; these measures can then be substituted directly into the Black-Scholes framework to value put-option insurance that shields farmers from climate-driven price drops in the studied crop-region pairs under both moderate and severe emissions scenarios.
What carries the argument
EGARCH model for conditional volatility, extended by SARIMAX forecasting that incorporates CMIP6 temperature and precipitation series as regressors, with the resulting volatility paths substituted into the Black-Scholes put-option formula.
If this is right
- Insurance mechanisms can be priced more accurately when meteorological variables are included in the volatility model.
- Price stabilization tools gain a quantitative basis from the scenario-specific volatility paths.
- Policy interventions for sustainable agriculture can be calibrated to the moderate and severe climate scenarios examined.
- The same pipeline can be applied to the six crop-region pairs studied to quantify farmer protection costs.
Where Pith is reading between the lines
- The framework could be tested on additional crops or regions once comparable high-resolution meteorological series become available.
- Real-time weather updates might be substituted for the CMIP6 projections to produce rolling insurance quotes.
- Alternative volatility specifications could be benchmarked against the EGARCH-SARIMAX pair to check robustness of the insurance prices.
Load-bearing premise
The EGARCH and SARIMAX specifications with CMIP6 meteorological inputs produce reliable out-of-sample volatility forecasts that can be directly inserted into Black-Scholes without material model risk or regime shifts.
What would settle it
An out-of-sample test in which realized price volatility over a future window differs substantially from the SARIMAX forecasts that used the CMIP6 inputs, or a period in which actual price drops produce insurance payouts far from the Black-Scholes values computed from those forecasts.
Figures




read the original abstract
Agricultural price volatility, driven by market dynamics and meteorological factors such as temperature and precipitation, poses challenges for sustainable finance, planning, and policy. This study analyzes the impact of climate on crop price volatility for soybean in Madhya Pradesh (India) and Illinois (US), rice in Assam (India), wheat in North Dakota (US), cotton in Gujarat (India), and corn in Iowa (US). Using CMIP6 climate projections from the Copernicus Climate Change Service, we examine historical climate patterns and evaluate two future scenarios: SSP2-4.5 (moderate) and SSP5-8.5 (severe). We estimate conditional price volatility using the Exponential Generalized Autoregressive Conditional Heteroskedasticity (EGARCH) model, and forecast this volatility with a Seasonal Autoregressive Integrated Moving Average with Exogenous Regressors (SARIMAX) model that incorporates meteorological variables. Finally, we apply the Black-Scholes framework to evaluate the cost of put-option-based insurance, which provides protection to farmers against adverse price drops linked to climate change. Our results highlight the role of meteorological data in improving agricultural risk modelling, enabling better design of insurance mechanisms, price stabilization tools, and sustainable policy interventions under climate uncertainty.
Editorial analysis
A structured set of objections, weighed in public.
Referee Report
Summary. The manuscript analyzes climate-driven price volatility for six crop-region pairs (soybean in Madhya Pradesh and Illinois, rice in Assam, wheat in North Dakota, cotton in Gujarat, corn in Iowa) using CMIP6 projections under SSP2-4.5 and SSP5-8.5. It fits EGARCH models to historical prices, forecasts volatility via SARIMAX incorporating meteorological regressors, and prices put-option insurance via Black-Scholes to quantify climate risk mitigation.
Significance. If the empirical results hold, the work would supply a concrete pipeline linking CMIP6 outputs to financial instruments for agricultural risk, with potential value for insurance design and policy under uncertainty. No machine-checked proofs, reproducible code, or parameter-free derivations are described.
major comments (3)
- [Abstract] Abstract, final paragraph: the assertion that 'meteorological data in improving agricultural risk modelling' is not supported by any reported out-of-sample forecast metrics, coefficient tables, or baseline comparisons (e.g., SARIMAX without CMIP6 inputs), so the central claim cannot be evaluated from the supplied evidence.
- [Methods] Methods (EGARCH and SARIMAX specifications): the pipeline assumes the fitted conditional volatility process and its meteorological linkages remain stationary when extrapolating to SSP5-8.5 regimes, yet no stationarity tests, structural-break diagnostics, or comparisons to regime-switching alternatives are described; this directly undermines the Black-Scholes insertion step.
- [Results] Results section: no fitted EGARCH parameters (omega, alpha, beta, gamma), SARIMAX coefficients, or volatility forecast tables are referenced, leaving the claimed improvement from meteorological inputs unquantified and the subsequent put-option prices ungrounded.
minor comments (1)
- [Abstract] The abstract lists six crop-region pairs but does not state the exact sample periods or data sources for the price series, which should be clarified for reproducibility.
Simulated Author's Rebuttal
We thank the referee for the constructive comments, which highlight opportunities to strengthen the empirical grounding and methodological transparency of the manuscript. We address each major comment below and will revise accordingly.
read point-by-point responses
-
Referee: [Abstract] Abstract, final paragraph: the assertion that 'meteorological data in improving agricultural risk modelling' is not supported by any reported out-of-sample forecast metrics, coefficient tables, or baseline comparisons (e.g., SARIMAX without CMIP6 inputs), so the central claim cannot be evaluated from the supplied evidence.
Authors: We agree that the abstract claim requires explicit quantitative support to be evaluable. In the revision we will add out-of-sample forecast accuracy metrics (e.g., RMSE and MAE) comparing SARIMAX specifications with and without the meteorological regressors, include a baseline comparison table, and revise the abstract to reference these results directly rather than asserting improvement without evidence. revision: yes
-
Referee: [Methods] Methods (EGARCH and SARIMAX specifications): the pipeline assumes the fitted conditional volatility process and its meteorological linkages remain stationary when extrapolating to SSP5-8.5 regimes, yet no stationarity tests, structural-break diagnostics, or comparisons to regime-switching alternatives are described; this directly undermines the Black-Scholes insertion step.
Authors: The concern is valid: the current text does not report stationarity diagnostics or robustness checks against regime shifts. We will add Augmented Dickey-Fuller and KPSS tests on the EGARCH-derived volatility series for each crop-region pair, include Chow-type structural-break tests around known climate or policy events, and report a brief comparison with a simple regime-switching alternative. If stationarity is rejected for any series we will qualify the Black-Scholes application and note the limitation explicitly. revision: yes
-
Referee: [Results] Results section: no fitted EGARCH parameters (omega, alpha, beta, gamma), SARIMAX coefficients, or volatility forecast tables are referenced, leaving the claimed improvement from meteorological inputs unquantified and the subsequent put-option prices ungrounded.
Authors: We acknowledge that the main text currently omits the numerical parameter tables and forecast values. In the revised manuscript we will insert a table of EGARCH coefficients (including omega, alpha, beta, gamma and significance levels), a table of SARIMAX coefficients with meteorological regressors, and a summary table of volatility forecasts under both SSP scenarios. These will be placed in the Results section immediately before the option-pricing calculations so that the put-option prices are directly traceable to the estimated parameters. revision: yes
Circularity Check
No circularity: standard empirical pipeline with external regressors
full rationale
The paper describes a conventional workflow: EGARCH estimation of conditional volatility on historical price series, SARIMAX forecasting that incorporates exogenous CMIP6 meteorological variables, and insertion of the resulting volatility forecasts into Black-Scholes put pricing. No step reduces by construction to its own fitted inputs, no self-citation is invoked as a uniqueness theorem, and no ansatz or renaming is presented as a derivation. The forecasts are out-of-sample by design and rely on external climate projections rather than tautological re-use of the target series. This is a standard econometric application, not a self-referential derivation.
Axiom & Free-Parameter Ledger
free parameters (2)
- EGARCH parameters (omega, alpha, beta, gamma)
- SARIMAX seasonal and exogenous coefficients
axioms (2)
- domain assumption EGARCH model assumptions (asymmetry, stationarity) hold for the six crop price series
- domain assumption CMIP6 SSP2-4.5 and SSP5-8.5 projections are suitable exogenous inputs for future volatility
Reference graph
Works this paper leans on
-
[1]
Chakrabarti, A. S., Bakar, K. S. & Chakraborti, A. Data science for complex systems (Cambridge University Press, 2023)
work page 2023
-
[2]
Kwapie´n, J. & Dro˙zd˙z, S. Physical approach to complex systems. Phys. Reports 515, 115–226 (2012)
work page 2012
-
[3]
Chakraborti, A. et al. Emerging spectra characterization of catastrophic instabilities in complex systems. New J. Phys. 22, 063043 (2020)
work page 2020
-
[4]
Chakraborti, A., Sharma, K., Pharasi, H. K. et al. Phase separation and scaling in correlation structures of financial markets. J. Physics: Complex. 2, 015002 (2020)
work page 2020
- [5]
-
[6]
Birthal, P., Khan, M. T., Negi, D. & Agarwal, S. Impact of climate change on yields of major food crops in india: Implications for food security. Agric. Econ. Res. Rev. 27, 145, DOI: 10.5958/0974-0279.2014.00019.6 (2014)
-
[7]
Carleton, T. A. Crop-damaging temperatures increase suicide rates in india. Proc. Natl. Acad. Sci. 114, 8746–8751, DOI: 10.1073/pnas.1701354114 (2017)
-
[8]
Burney, J. & Ramanathan, V . Recent climate and air pollution impacts on indian agriculture.Proc. Natl. Acad. Sci. 111, 16319–16324, DOI: 10.1073/pnas.1317275111 (2014)
-
[9]
Kumar, S. N. et al. Impact of climate change on crop productivity in western ghats, coastal and northeastern regions of india. Curr. Sci. 332–341 (2011)
work page 2011
- [10]
-
[11]
K., Singh, R., Gupta, A., Srinivasan, G
Mall, R. K., Singh, R., Gupta, A., Srinivasan, G. & Rathore, L. Impact of climate change on indian agriculture: a review. Clim. change 78, 445–478 (2006)
work page 2006
-
[12]
Mehta, L. et al. Climate change and uncertainty from ‘above’and ‘below’: perspectives from india.Reg. Environ. Chang. 19, 1533–1547 (2019)
work page 2019
-
[13]
Singh, S. Farmers’ perception of climate change and adaptation decisions: A micro-level evidence from bundelkhand region, india. Ecol. Indic. 116, 106475 (2020)
work page 2020
-
[14]
Aditya, K. et al. Awareness about minimum support price and its impact on diversification decision of farmers in india. Asia & Pac. Policy Stud. 4, 514–526 (2017)
work page 2017
-
[15]
Generalized autoregressive conditional heteroskedasticity
Bollerslev, T. Generalized autoregressive conditional heteroskedasticity. J. Econom. 31, 307–327, DOI: 10.1016/ 0304-4076(86)90063-1 (1986)
work page 1986
-
[16]
Nelson, D. B. Conditional heteroskedasticity in asset returns: A new approach. Econometrica 59, 347–370, DOI: 10.2307/2938260 (1991)
-
[17]
Shumway, R. H. & Stoffer, D. S. Time Series Analysis and Its Applications: With R Examples (Springer, 2017), 4th edn
work page 2017
-
[18]
Black, F. & Scholes, M. The pricing of options and corporate liabilities. J. Polit. Econ. 81, 637–654, DOI: 10.1086/260062 (1973)
-
[19]
Merton, R. C. Theory of rational option pricing. The Bell J. Econ. Manag. Sci. 4, 141–183 (1973). 7/10
work page 1973
-
[20]
Hull, J. C. Options, Futures, and Other Derivatives (Pearson, 2017), 10th edn
work page 2017
-
[21]
Agrawal, A. et al. From environmental governance to governance for sustainability. One Earth 5, 615–621, DOI: https://doi.org/10.1016/j.oneear.2022.05.014 (2022)
-
[22]
Mahawan, A., Jaiteang, S., Srijiranon, K. & Eiamkanitchat, N. Hybrid arimax and lstm model to predict rice export price in thailand. 2022 Int. Conf. on Cybern. Innov. (ICCI) 1–6 (2022)
work page 2022
-
[23]
Forecasting agricultural price volatility of some export crops in egypt using arima/garch model
Agbo, H. Forecasting agricultural price volatility of some export crops in egypt using arima/garch model. Rev. Econ. Polit. Sci. 8, DOI: 10.1108/REPS-06-2022-0035 (2023)
-
[24]
Zhao, C. et al. Temperature increase reduces global yields of major crops in four independent estimates. Proc. Natl. Acad. Sci. 114, 9326–9331, DOI: 10.1073/pnas.1701762114 (2017)
-
[25]
Steen, M., Bergland, O. & Gjølberg, O. Climate change and grain price volatility: Empirical evidence for corn and wheat 1971–2019. Commodities 2, 1–12, DOI: 10.3390/commodities2010001 (2023)
-
[26]
Solomon, D. et al. The role of rural circular migration in shaping weather risk management for smallholder farmers in india, nepal, and bangladesh. Glob. Environ. Chang. 89, 102937, DOI: https://doi.org/10.1016/j.gloenvcha.2024.102937 (2024)
-
[27]
https://agmarknet.gov.in/PriceAndArrivals/ DatewiseCommodityReport.aspx
AGMARKNET - Agricultural Marketing Information Network. https://agmarknet.gov.in/PriceAndArrivals/ DatewiseCommodityReport.aspx. Accessed: March 16, 2025
work page 2025
-
[28]
Commodities: Market intelligence on agricultural and non-agricultural commodi- ties
Centre for Monitoring Indian Economy. Commodities: Market intelligence on agricultural and non-agricultural commodi- ties. https://commodities.cmie.com/. Accessed: 31 March 2025
work page 2025
-
[29]
Dutta, P., Hinge, G., Marak, J. D. K. & Sarma, A. K. Future climate and its impact on streamflow: a case study of the brahmaputra river basin. Model. Earth Syst. Environ. 7 (2021)
work page 2021
-
[30]
Tebaldi, C. et al. Climate model projections from the scenario model intercomparison project (scenariomip) of cmip6. Earth Syst. Dyn. 12, 253–293 (2021)
work page 2021
-
[31]
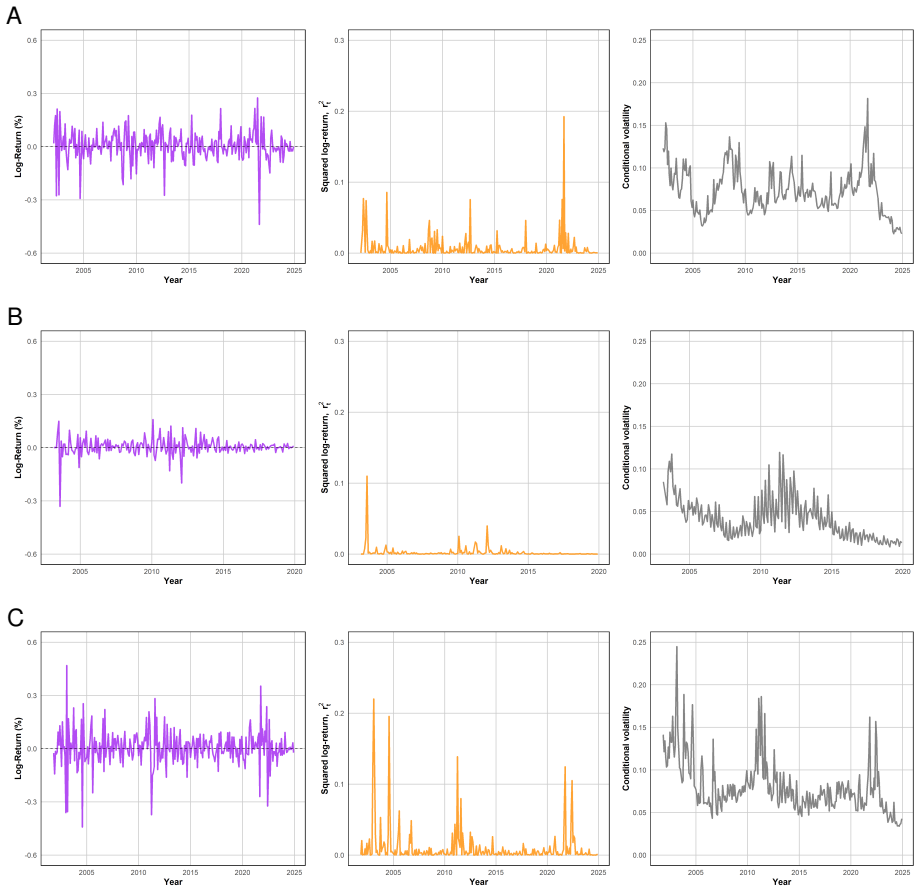
Tribune, T. A. Retail prices recorded erratic trend in 2011 (2012). Accessed: 2025-03-31. 8/10 A B C Figure 3. Plots of log returns, squared log returns and EGARCH conditional volatility, for (A) soybean in Madhya Pradesh, (B) rice in Assam and (C) cotton in Gujarat. The purple line in column one represents the log-returns over time, and the dashed black ...
work page 2011
discussion (0)
Sign in with ORCID, Apple, or X to comment. Anyone can read and Pith papers without signing in.