REVIEW 2 major objections 6 minor 56 references
VizTA: Enhancing Comprehension of Distributional Visualization with Visual-Lexical Fused Conversational Interface
T0 review · 2 major / 6 minor · reviewed 2026-08-16 · deepseek-v4-flash
Pith's one-line read VizTA claims that a conversational chart-reading assistant with visual-lexical fusion—dragging chart elements into queries and inline citation highlights in replies—improves comprehension and reasoning with distributional visualizations…
desk verdict A promising system and interaction design, but the baseline ablation confounds the fusion interface with the agent's access to structured chart data, so the headline causal claim is not supported. read the letter →
The pith
A machine-rendered reading of the paper's core claim, the machinery that carries it, and where it could break.
The reading
What carries the argument
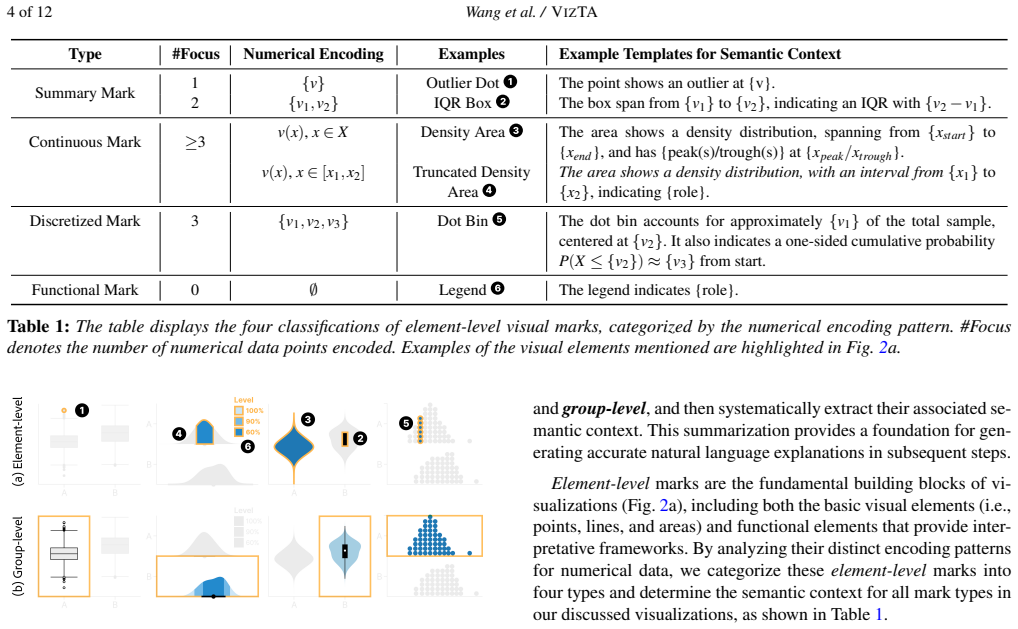
The load-bearing mechanism is the visual-lexical fusion design, defined as two coupled interactions: drag-and-drop insertion of visual elements into queries, turning deixis into structured tags, and inline citations in generated answers that highlight the referenced chart mark and show a tooltip. Around this sits the semantic-aware conversational agent, initialized with multi-source structured data—chart specification, data description, chart knowledge (the semantic contexts of element- and group-level marks), chart data, VLM-generated visual features, and a complete ID list—plus a few-shot citation tutorial that teaches the model when to emit citations. The taxonomy of element-level marks (summary, continuous, discretized, functional) and group-level marks is what makes the references unambiguous and the explanations contextually accurate.
What would settle it
Re-run the between-subjects study with three conditions: the full VizTA, the text-only baseline, and a corrupted VizTA in which a fixed fraction (say 20%) of the inline-cited data values are perturbed or the citations point to the wrong mark, keeping the interface identical. If the corrupted condition's correctness and pass rates fall to baseline levels, the proposed fusion design only helps when the underlying model is perfectly reliable; if they stay high, the interaction itself, not factual accuracy, drives the gain. A cheaper check is to log every response from the original study and audit each cited value against the chart data.
Extended reading notes
Core claim
VizTA's central claim is that explicitly linking the two modalities—visual marks in the chart and lexical tokens in the conversation—is the active ingredient that helps non-experts read distributional visualizations. The design has two halves: readers incorporate element-level or group-level visual elements into their queries by drag-and-drop, which converts ambiguous deictic references like "this point" into unambiguous tags carrying the element's identifier and data, and the agent emits inline citation labels that highlight the corresponding marks and tooltips when hovered. This fusion is supported by a semantic-aware agent whose prompt is initialized with structured chart knowledge (a taxonomy of summary, continuous, discretized, and functional marks plus group-level aggregations), chart data, an ID list, a VLM-generated visual description, and a few-shot citation tutorial. The paper reports that this grounded agent, unlike a text-only ablated baseline, produced significantly higher correctness, higher reasoning pass rates, and far more precise data citations, and that users prompted it more often.
Load-bearing premise
The whole result rests on the assistant's answers and citation highlights being factually accurate, yet the paper never measures that accuracy quantitatively; if the assistant frequently gives plausible but wrong values, the higher test scores could reflect confident misinformation rather than genuine comprehension.
Editorial extensions
If this is right
- If the reported effect is causal, future LLM-based chart assistants should treat visual referencing as a first-class input mechanism rather than relying on coordinate-free text descriptions.
- The low-literacy subgroup result (70.8% with VizTA vs 68.8% for the high-literacy baseline) implies that visual-lexical fusion can narrow, though not close, the visualization-literacy gap.
- The 117 precise versus 31 precise data values cited in reasoning answers suggests that inline citations shift readers toward evidence-backed claims, which matters for tasks that ask readers to justify conclusions from charts.
- Because the gains appeared across box plots, density plots, violin plots, and quantile dotplots, the interaction pattern is plausibly generalizable to other distributional and uncertainty visualizations beyond the four tested scenarios.
Reading between the lines
- A testable extension: swap the vision-and-language model used to generate visual descriptions and the language model used for answers with smaller open-weight models; if the accuracy gap persists, the design rather than proprietary model capacity carries the benefit.
- The study measured immediate task performance, not delayed retention; a transfer test (for example, reading a new chart type a week later without the assistant) would separate "understood the chart" from "got help at the moment."
- A sabotage experiment—deliberately corrupting a fraction of the assistant's cited values or mis-linking citations and rerunning the study—would show how much the result depends on agent reliability rather than on the fusion interaction itself.
- Beyond education, the same interaction could support accessible chart reading: drag-and-drop referencing plus inline citations give screen-reader users a way to anchor text to chart regions by semantic name rather than spatial position.
Signed reviews
Editorial analysis
A structured set of objections, weighed in public.
Referee Report
Summary. The paper introduces VizTA, a conversational interface for distributional visualization understanding. The core design is visual-lexical fusion: readers drag-and-drop chart elements into their queries, and the system's responses include inline citations that highlight chart marks and show tooltips. The backend is a gpt-4o-based agent seeded with structured chart data, chart knowledge, an element ID list, and a VLM-generated visual description. The evaluation is a between-subject study (n=12 per group) comparing VizTA with a baseline that ablated the visual-lexical fusion interaction and also removed the structured chart data, chart knowledge, and ID list from the agent initialization. The paper reports significantly higher correctness on single-choice comprehension questions (75.5% vs 62.5%), higher pass rates on open-ended reasoning questions (97.9% vs 75.0%), more precise data citation in oral reports, and favorable SUS ratings. Qualitative interviews support usability and engagement.
Significance. If the experimental attribution is valid, the paper makes a useful contribution to conversational visualization interfaces and visualization education. The formative study is well executed, the granularity taxonomy (element-level vs group-level) is a clear conceptual contribution, and the two interaction mechanisms (drag-and-drop deixis and inline citation highlighting) are well-motivated and generally well-received by participants. The quantitative results are large in magnitude, and the bootstrap CIs and qualitative coding provide some support. However, the central causal claim—that the visual-lexical fusion design itself causes the comprehension gain—is not identified by the reported experiment because the baseline differs on a second factor: availability of exact structured data to the agent. Therefore the significance of the design-specific claim remains unsubstantiated until a content-equated ablation is run.
major comments (2)
- [6.1.2, 6.2.1] The baseline condition ablates not only the visual-lexical fusion interaction but also the agent-initialization information sources chart data (D), chart knowledge (C), and ID list (I), as stated in Section 6.1.2. Because the tasks include data-retrieval and value-comparison questions (e.g., 'Which group has the smallest IQR?') and because Section 6.2.1 reports that VizTA users cited 117 precise values versus only 31 in BASELINE (with participant B7 explicitly saying the baseline assistant 'can't provide that level of detail'), the correctness gain (75.5 vs 62.5, p=.006) could be driven by the agent's access to exact structured data rather than by the drag-and-drop and citation interface. The paper needs a content-equated baseline—one where the agent still receives D, C, and I, but the interface omits visual-lexical fusion—to isolate the mechanism claimed in the title and abstract.
- [6.2.1] Two reported p-value/effect-size pairs are internally inconsistent with the sample size (n1=n2=12). For the SUS item Q3, p = .049 and r = .71; with N=24, r = Z/sqrt(N), so r=.71 corresponds to Z≈3.48 and p<.001, not .049. Conversely, the citation-count comparison reports p = .006 and r = .18; r=.18 corresponds to Z≈0.88 and p≈.38, not .006. Please re-examine the statistical calculations or report the correct test statistics, and check whether the same issue affects other reported effect sizes.
minor comments (6)
- [6.1.1] The sentence 'The two groups were balanced... and assigned to either the grounded or ungrounded condition' refers to conditions not defined anywhere else in the paper; clarify whether this is a leftover from an earlier design.
- [6.2.1] The SUS results are reported on a '7-point scale'; standard SUS scoring produces a 0-100 score or uses 5-point Likert items. Please specify the scoring procedure and report the corresponding standard score if applicable.
- [7] The authors acknowledge that no quantitative evaluation of the LLM's factual accuracy is reported, noting only anecdotally that the system 'rarely made mistakes.' Since the measured comprehension benefits rely on correct data values and citation anchors, a short quantitative analysis of logged responses (e.g., proportion of correct value statements and citation-element matches) would considerably strengthen the validity of the reported effects.
- [Figure 7] The caption says error bars represent 95% CIs, but panel (d) shows no CI values; consider adding numeric CI values or stating explicitly that they are omitted for clarity.
- [4.3] The choice of gpt-4o as both the LLM and the VLM is stated but not compared with alternatives; one sentence on why this model was selected or a limitation note would help.
- [3.2, Table 1] The taxonomy is demonstrated with examples for box plots, violin plots, density plots, and dotplots, but its completeness for all visual elements in the four selected chart types is asserted rather than validated; a brief checklist or validation in the supplementary material would be helpful.
Circularity Check
No significant circularity: VizTA's effectiveness claim is empirical and does not reduce to its inputs; the BASELINE ablation raises a confound but not a circularity.
full rationale
VizTA is an empirical systems and HCI paper rather than a derivation from first principles. Its central claim is supported by a between-subject user study (Section 6) with 24 participants, comparing VIZTA against an internally ablated BASELINE condition. No parameter is fitted and then relabeled as a prediction, and no outcome measure is defined in terms of the system's own inputs by construction. The BASELINE condition (Section 6.1.2) removes not only the drag-and-drop and inline-citation interaction but also the agent-initialization sources chart data (D), chart knowledge (C), and ID list (I). This means the comparison does not fully isolate the visual-lexical fusion mechanism, and the reported correctness gain (75.5 vs. 62.5) may partly reflect differences in the factual information available to the underlying LLM. That is a legitimate internal-validity or confound concern, but it is not circularity: the measured outcomes are still empirical user-performance results, not quantities equal by construction to the condition assignments. The paper also openly limits itself in Section 7, noting that LLMs can make mathematical reasoning errors and that only anecdotal evidence is offered for the agent's accuracy on precise values and citations; this is a reliability and generalizability limitation rather than a circular step. The only overlapping-author citations (e.g., [ZLYZ25] on LLM chart question answering and [LXL*25] on multi-agent planning) are used as background, design rationale, or future-work suggestions, not as load-bearing uniqueness theorems or as the evidence for the main effectiveness claim. No step in the paper reduces to its own input, so there is no significant circularity.
Assumptions & free parameters
assumptions (5)
- domain assumption The four visualization types (box plot, density plot, violin plot, quantile dotplot) adequately represent distributional uncertainty visualizations; results generalize across these types.
- ad hoc to paper The element-level vs group-level granularity taxonomy is complete and sufficient for referential expressions in chart-reading conversations.
- ad hoc to paper The semantic context templates in Table 1 correctly map visual marks to statistical meanings (e.g., IQR, CI, cumulative probability).
- ad hoc to paper gpt-4o, both as the conversational agent and as the VLM generating Visual Features, produces sufficiently accurate answers and citations for the measured benefits to be meaningful.
- standard math Statistical ground truths used in scoring single-choice questions and open-ended questions are correct and unambiguous.
Cite this review
Pith. "Pith review of VizTA: Enhancing Comprehension of Distributional Visualization with Visual-Lexical Fused Conversational Interface." pith.science (2026). https://pith.science/paper/QCDXFA5C
@misc{pith2026250414507,
  author       = {Pith},
  title        = {Pith review of: VizTA: Enhancing Comprehension of Distributional Visualization with Visual-Lexical Fused Conversational Interface},
  year         = {2026},
  howpublished = {\url{https://pith.science/paper/QCDXFA5C}},
  note         = {Machine review of arXiv:2504.14507}
}
read the original abstract
Comprehending visualizations requires readers to interpret visual encoding and the underlying meanings actively. This poses challenges for visualization novices, particularly when interpreting distributional visualizations that depict statistical uncertainty. Advancements in LLM-based conversational interfaces show promise in promoting visualization comprehension. However, they fail to provide contextual explanations at fine-grained granularity, and chart readers are still required to mentally bridge visual information and textual explanations during conversations. Our formative study highlights the expectations for both lexical and visual feedback, as well as the importance of explicitly linking these two modalities throughout the conversation. The findings motivate the design of VizTA, a visualization teaching assistant that leverages the fusion of visual and lexical feedback to help readers better comprehend visualization. VizTA features a semantic-aware conversational agent capable of explaining contextual information within visualizations and employs a visual-lexical fusion design to facilitate chart-centered conversation. A between-subject study with 24 participants demonstrates the effectiveness of VizTA in supporting the understanding and reasoning tasks of distributional visualization across multiple scenarios.
Figures


Figures from the paper (4 more)


Reference graph
Works this paper leans on
-
[1]
write newline
" write newline "" before.all 'output.state := FUNCTION fin.entry add.period write newline FUNCTION new.block output.state before.all = 'skip after.block 'output.state := if FUNCTION new.sentence output.state after.block = 'skip output.state before.all = 'skip after.sentence 'output.state := if if FUNCTION not #0 #1 if FUNCTION and 'skip pop #0 if FUNCTIO...
-
[2]
write newline
" write newline "" before.all 'output.state := FUNCTION fin.entry.original add.period write newline FUNCTION new.block output.state before.all = 'skip after.block 'output.state := if FUNCTION new.sentence output.state after.block = 'skip output.state before.all = 'skip after.sentence 'output.state := if if FUNCTION not #0 #1 if FUNCTION and 'skip pop #0 i...
-
[3]
: Researchers misunderstand confidence intervals and standard error bars
Belia S., Fidler F., Williams J., Cumming G. : Researchers misunderstand confidence intervals and standard error bars. Psychological Methods 10 , 4 (2005), 389. https://doi.org/10.1037/1082-989X.10.4.389 doi:10.1037/1082-989X.10.4.389
-
[4]
Bach B., Keck M., Rajabiyazdi F., Losev T., Meirelles I., Dykes J., Laramee R. S., AlKadi M., Stoiber C., Huron S., Perin C., Morais L., Aigner W., Kosminsky D., Boucher M., Knudsen S., Manataki A., Aerts J., Hinrichs U., Roberts J. C., Carpendale S. : Challenges and opportunities in data visualization education: A call to action. IEEE Transactions on Vis...
arXiv 2024
-
[5]
: From invisible to visible: Impacts of metadata in communicative data visualization
Burns A., Lee C., On T., Xiong C., Peck E., Mahyar N. : From invisible to visible: Impacts of metadata in communicative data visualization. IEEE Transactions on Visualization and Computer Graphics 30, 7 (2024), 3427--3443. https://doi.org/10.1109/TVCG.2022.3231716 doi:10.1109/TVCG.2022.3231716
-
[6]
: A multi-level typology of abstract visualization tasks
Brehmer M., Munzner T. : A multi-level typology of abstract visualization tasks. IEEE Transactions on Visualization and Computer Graphics 19, 12 (2013), 2376--2385. https://doi.org/10.1109/TVCG.2013.124 doi:10.1109/TVCG.2013.124
-
[7]
: How data workers cope with uncertainty: A task characterisation study
Boukhelifa N., Perrin M.-E., Huron S., Eagan J. : How data workers cope with uncertainty: A task characterisation study. In Proceedings of the ACM Conference on Human Factors in Computing Systems (2017), p. 3645–3656. https://doi.org/10.1145/3025453.3025738 doi:10.1145/3025453.3025738
arXiv 2017
-
[8]
Bancilhon M., Wright A., Ha S., Crouser R. J., Ottley A. : Why combining text and visualization could improve bayesian reasoning: A cognitive load perspective. In Proceedings of the CHI Conference on Human Factors in Computing Systems (2023), CHI '23, pp. 467: 1--15. https://doi.org/10.1145/3544548.3581218 doi:10.1145/3544548.3581218
arXiv 2023
Show all 56 references
-
[9]
Cumming G., Fidler F., Vaux D. L. : Error bars in experimental biology. The Journal of Cell Biology 177 , 1 (2007), 7--11. https://doi.org/10.1083/jcb.200611141 doi:10.1083/jcb.200611141
2007 doi
-
[10]
: Error bars considered harmful: Exploring alternate encodings for mean and error
Correll M., Gleicher M. : Error bars considered harmful: Exploring alternate encodings for mean and error. IEEE Transactions on Visualization and Computer Graphics 20, 12 (2014), 2142--2151. https://doi.org/10.1109/TVCG.2014.2346298 doi:10.1109/TVCG.2014.2346298
2014
-
[11]
W., Seo J
Choe K., Lee C., Lee S., Song J., Cho A., Kim N. W., Seo J. : Enhancing data literacy on-demand: LLM s as guides for novices in chart interpretation. IEEE Transactions on Visualization and Computer Graphics (2024), 1--17. https://doi.org/10.1109/TVCG.2024.3413195 doi:10.1109/T...
2024
-
[12]
: From good to great: Improving math reasoning with tool-augmented interleaf prompting
Chen N., Li H., Wang B., Li J. : From good to great: Improving math reasoning with tool-augmented interleaf prompting. In Proceedings of the Workshop on Natural Language Reasoning and Structured Explanations (2024), pp. 64--79. https://doi.org/10.13140/RG.2.2.30307.12325 doi:1...
2024
-
[13]
: Linking text and visualizations via contextual knowledge graph
Cai X., Weng D., Fu T., Fu S., Wang Y., Wu Y. : Linking text and visualizations via contextual knowledge graph. IEEE Transactions on Visualization and Computer Graphics (2024), 1--14. https://doi.org/10.1109/TVCG.2024.3412241 doi:10.1109/TVCG.2024.3412241
2024
-
[14]
: AutoVizuA11y : A tool to automate screen reader accessibility in charts
Duarte D., Costa R., Bizarro P., Duarte C. : AutoVizuA11y : A tool to automate screen reader accessibility in charts. Computer Graphics Forum 43, 3 (2024), e15099. https://doi.org/10.1111/cgf.15099 doi:10.1111/cgf.15099
2024 doi
-
[15]
: Tagify
Even-Or Y. : Tagify. https://yaireo.github.io/tagify/, 2024. accessed on Mar. 4, 2025
2024
-
[16]
: Uncertainty displays using quantile dotplots or CDF s improve transit decision-making
Fernandes M., Walls L., Munson S., Hullman J., Kay M. : Uncertainty displays using quantile dotplots or CDF s improve transit decision-making. In Proceedings of the ACM Conference on Human Factors in Computing Systems (2018), p. 144: 1–12. https://doi.org/10.1145/3173574.31737...
2018
-
[17]
Gorniak J., Kim Y., Wei D., Kim N. W. : VizAbility : Enhancing chart accessibility with llm-based conversational interaction. In Proceedings of the ACM Symposium on User Interface Software and Technology (2024), pp. 89:1--19. https://doi.org/10.1145/3654777.3676414 doi:10.1145...
2024
-
[18]
Garcia-Retamero R., Cokely E. T. : Communicating health risks with visual aids. Current Directions in Psychological Science 22, 5 (2013), 392--399
2013
-
[19]
Han C., Isaacs K. E. : A deixis-centered approach for documenting remote synchronous communication around data visualizations. IEEE Transactions on Visualization and Computer Graphics 31, 1 (2025), 930–940. https://doi.org/10.1109/TVCG.2024.3456351 doi:10.1109/TVCG.2024.3456351
2025
-
[20]
: FinFlier : Automating graphical overlays for financial visualizations with knowledge-grounding large language model
Hao J., Yang M., Shi Q., Jiang Y., Zhang G., Zeng W. : FinFlier : Automating graphical overlays for financial visualizations with knowledge-grounding large language model. IEEE Transactions on Visualization and Computer Graphics (2024), 1--17. https://doi.org/10.1109/TVCG.2024...
2024
-
[21]
: Visualizing uncertainty for non-expert end users: The challenge of the deterministic construal error
Joslyn S., Savelli S. : Visualizing uncertainty for non-expert end users: The challenge of the deterministic construal error. Frontiers in Computer Science 2 (2021), 590232. https://doi.org/10.3389/fcomp.2020.590232 doi:10.3389/fcomp.2020.590232
2021
-
[22]
: Visualizing samples with box plots: use box plots to illustrate the spread and differences of samples
Krzywinski M., Altman N. : Visualizing samples with box plots: use box plots to illustrate the spread and differences of samples. Nature Methods 11, 2 (2014), 119--121. https://doi.org/10.1038/nmeth.2813 doi:10.1038/nmeth.2813
2014 doi
-
[25]
: Visual reasoning strategies for effect size judgments and decisions
Kale A., Kay M., Hullman J. : Visual reasoning strategies for effect size judgments and decisions. IEEE Transactions on Visualization and Computer Graphics 27, 2 (2020), 272--282. https://doi.org/10.1109/TVCG.2020.3030335 doi:10.1109/TVCG.2020.3030335
2020
-
[26]
R., Munson S
Kay M., Kola T., Hullman J. R., Munson S. A. : When (ish) is my bus? user-centered visualizations of uncertainty in everyday, mobile predictive systems. In Proceedings of the ACM Conference on Human Factors in Computing Systems (2016), p. 5092–5103. https://doi.org/10.1145/285...
2016
-
[27]
: A deeper understanding of visualization‐text interplay in geographic data‐driven stories
Latif S., Chen S., Beck F. : A deeper understanding of visualization‐text interplay in geographic data‐driven stories. Computer Graphics Forum 40 (06 2021), 311--322. https://doi.org/10.1111/cgf.14309 doi:10.1111/cgf.14309
2021 doi
-
[28]
Lee S., Kim S.-H., Kwon B. C. : VLAT : Development of a visualization literacy assessment test. IEEE transactions on visualization and computer graphics 23, 1 (2016), 551--560. https://doi.org/10.1109/TVCG.2016.2598920 doi:10.1109/TVCG.2016.2598920
2016
-
[29]
: InkSight : Leveraging sketch interaction for documenting chart findings in computational notebooks
Lin Y., Li H., Yang L., Wu A., Qu H. : InkSight : Leveraging sketch interaction for documenting chart findings in computational notebooks. IEEE Transactions on Visualization and Computer Graphics 30, 1 (2024), 944--954. https://doi.org/10.1109/TVCG.2023.3327170 doi:10.1109/TVC...
2024
-
[30]
: Accessible visualization via natural language descriptions: A four-level model of semantic content
Lundgard A., Satyanarayan A. : Accessible visualization via natural language descriptions: A four-level model of semantic content. IEEE Transactions on Visualization and Computer Graphics 28, 1 (2022), 1073–1083. https://doi.org/10.1109/TVCG.2021.3114770 doi:10.1109/TVCG.2021.3114770
2022
-
[31]
: Agent-oriented planning in multi-agent systems
Li A., Xie Y., Li S., Tsung F., Ding B., Li Y. : Agent-oriented planning in multi-agent systems. In Proceedings of The Thirteenth International Conference on Learning Representations (2025). URL: https://openreview.net/forum?id=EqcLAU6gyU
2025
-
[32]
Latif S., Zhou Z., Kim Y., Beck F., Kim N. W. : Kori: Interactive synthesis of text and charts in data documents. IEEE Transactions on Visualization and Computer Graphics 28, 1 (2021), 184--194. https://doi.org/10.1109/TVCG.2021.3114802 doi:10.1109/TVCG.2021.3114802
2021
-
[33]
S., L \"u decke D
Makowski D., Ben-Shachar M. S., L \"u decke D. : bayestestR: Describing effects and their uncertainty, existence and significance within the Bayesian framework . Journal of Open Source Software 4 , 40 (2019), 1541. https://doi.org/10.21105/joss.01541 doi:10.21105/joss.01541
2019 doi
-
[34]
: Charagraph: Interactive generation of charts for realtime annotation of data-rich paragraphs
Masson D., Malacria S., Casiez G., Vogel D. : Charagraph: Interactive generation of charts for realtime annotation of data-rich paragraphs. In Proceedings of the ACM Conference on Human Factors in Computing Systems (2023), pp. 146: 1--18. https://doi.org/10.1145/3544548.358109...
2023
-
[35]
: Statslator: Interactive translation of nhst and estimation statistics reporting styles in scientific documents
Masson D., Malacria S., Casiez G., Vogel D. : Statslator: Interactive translation of nhst and estimation statistics reporting styles in scientific documents. In Proceedings of the ACM Symposium on User Interface Software and Technology (2023), pp. 91:1--14. https://doi.org/10....
2023
-
[36]
J., Peck E
Ottley A., Kaszowska A., Crouser R. J., Peck E. M. : The curious case of combining text and visualization. In Proceedings of Eurographics Conference on Visualization (2019). https://doi.org/10.2312/evs.20191181 doi:10.2312/evs.20191181
2019 doi
-
[37]
https://platform.openai.com/docs/api-reference/chat, 2024
OpenAI : Openai platform. https://platform.openai.com/docs/api-reference/chat, 2024
2024
-
[38]
: Uncertainty visualization
Padilla L., Kay M., Hullman J. : Uncertainty visualization. In Computational Statistics in Data Science. Wiley Online Library, 2020, pp. 405--426. https://doi.org/10.1002/9781118445112.stat08296 doi:10.1002/9781118445112.stat08296
2020 doi
-
[39]
: Mini- VLAT : A short and effective measure of visualization literacy
Pandey S., Ottley A. : Mini- VLAT : A short and effective measure of visualization literacy. Computer Graphics Forum 42, 3 (2023), 1--11. https://doi.org/10.1111/cgf.14809 doi:10.1111/cgf.14809
2023 doi
-
[40]
M., Ruginski I
Padilla L. M., Ruginski I. T., Creem-Regehr S. H. : Effects of ensemble and summary displays on interpretations of geospatial uncertainty data. Cognitive Research: Principles and Implications 2 (2017), 1--16. https://doi.org/10.1186/s41235-017-0076-1 doi:10.1186/s41235-017-0076-1
2017 doi
-
[41]
T., Boone A
Ruginski I. T., Boone A. P., Padilla L. M., Liu L., Heydari N., Kramer H. S., Hegarty M., Thompson W. B., House D. H., Creem-Regehr S. H. : Non-expert interpretations of hurricane forecast uncertainty visualizations. Spatial Cognition & Computation 16, 2 (2016), 154--172. http...
2016
-
[42]
R., Nguyen A
Rahmanzadehgervi P., Bolton L., Taesiri M. R., Nguyen A. T. : Vision language models are blind, 2024. URL: https://arxiv.org/abs/2407.06581, http://arxiv.org/abs/2407.06581 arXiv:2407.06581
2024 arXiv
-
[43]
: Leveraging text-chart links to support authoring of data-driven articles with VizFlow
Sultanum N., Chevalier F., Bylinskii Z., Liu Z. : Leveraging text-chart links to support authoring of data-driven articles with VizFlow . In Proceedings of the ACM Conference on Human Factors in Computing Systems (2021), pp. 16:1--17. https://doi.org/10.1145/3411764.3445354 do...
2021
-
[44]
M., Endert A., Stasko J
Srinivasan A., Drucker S. M., Endert A., Stasko J. : Augmenting visualizations with interactive data facts to facilitate interpretation and communication. IEEE Transactions on Visualization and Computer Graphics 25, 1 (2018), 672--681. https://doi.org/10.1109/TVCG.2018.2865145...
2018
-
[45]
: Augmenting realistic charts with virtual overlays
Shi Y., Li B., Luo Y., Chen L., Tang N. : Augmenting realistic charts with virtual overlays. In Proceedings of the ACM Conference on Human Factors in Computing Systems (2025). https://doi.org/10.1145/3706598.3714320 doi:10.1145/3706598.3714320
2025
-
[46]
: Data playwright: Authoring data videos with annotated narration
Shen L., Li H., Wang Y., Luo T., Luo Y., Qu H. : Data playwright: Authoring data videos with annotated narration. IEEE Transactions on Visualization and Computer Graphics (2024), 1--14. https://doi.org/10.1109/TVCG.2024.3477926 doi:10.1109/TVCG.2024.3477926
2024
-
[48]
: Orko: Facilitating multimodal interaction for visual exploration and analysis of networks
Srinivasan A., Stasko J. : Orko: Facilitating multimodal interaction for visual exploration and analysis of networks. IEEE Transactions on Visualization and Computer Graphics 24, 1 (2017), 511--521. https://doi.org/10.1109/TVCG.2017.2745219 doi:10.1109/TVCG.2017.2745219
2017
-
[49]
: DataTales : Investigating the use of large language models for authoring data-driven articles
Sultanum N., Srinivasan A. : DataTales : Investigating the use of large language models for authoring data-driven articles. In Proceedings of the IEEE Visualization Conference (2023), pp. 231--235. https://doi.org/10.1109/VIS54172.2023.00055 doi:10.1109/VIS54172.2023.00055
2023
-
[50]
: Towards natural language interfaces for data visualization: A survey
Shen L., Shen E., Luo Y., Yang X., Hu X., Zhang X., Tai Z., Wang J. : Towards natural language interfaces for data visualization: A survey. IEEE Transactions on Visualization and Computer Graphics 29, 6 (2023), 3121--3144. https://doi.org/10.1109/TVCG.2022.3148007 doi:10.1109/...
2023
-
[51]
: Knowing what to look for: A fact-evidence reasoning framework for decoding communicative visualization
Vaidya S., Dasgupta A. : Knowing what to look for: A fact-evidence reasoning framework for decoding communicative visualization. In Proceedings of the IEEE Visualization Conference (2020), pp. 231--235. https://doi.org/10.1109/VIS47514.2020.00053 doi:10.1109/VIS47514.2020.00053
2020
-
[52]
: Active reading of visualizations
Walny J., Huron S., Perin C., Wun T., Pusch R., Carpendale S. : Active reading of visualizations. IEEE Transactions on Visualization and Computer Graphics 24, 1 (2017), 770--780. https://doi.org/10.1109/TVCG.2017.2745958 doi:10.1109/TVCG.2017.2745958
2017
-
[53]
Wileman R. E. : Visual communicating. Educational Technology, 1993
1993
-
[54]
: Wonderflow: Narration-centric design of animated data videos
Wang Y., Shen L., You Z., Shu X., Lee B., Thompson J., Zhang H., Zhang D. : Wonderflow: Narration-centric design of animated data videos. IEEE Transactions on Visualization and Computer Graphics (2024), 1--17. https://doi.org/10.1109/TVCG.2024.3411575 doi:10.1109/TVCG.2024.3411575
2024
-
[55]
Yang F., Huang Z., Scholtz J., Arendt D. L. : How do visual explanations foster end users' appropriate trust in machine learning? In Proceedings of the ACM International Conference on Intelligent User Interfaces (2020), p. 189–201. https://doi.org/10.1145/3377325.3377480 doi:1...
2020
-
[56]
S., Kang Y
Yi J. S., Kang Y. a., Stasko J., Jacko J. : Toward a deeper understanding of the role of interaction in information visualization. IEEE Transactions on Visualization and Computer Graphics 13, 6 (2007), 1224--1231. https://doi.org/10.1109/TVCG.2007.70515 doi:10.1109/TVCG.2007.70515
2007
-
[57]
: Advancing multimodal large language models in chart question answering with visualization-referenced instruction tuning
Zeng X., Lin H., Ye Y., Zeng W. : Advancing multimodal large language models in chart question answering with visualization-referenced instruction tuning. IEEE Transactions on Visualization and Computer Graphics 31, 1 (2025), 525–535. https://doi.org/10.1109/TVCG.2024.3456159 ...
2025
-
[58]
Zhi Q., Ottley A., Metoyer R. A. : Linking and layout: Exploring the integration of text and visualization in storytelling. Computer Graphics Forum 38 (2019). https://doi.org/10.1111/cgf.13719 doi:10.1111/cgf.13719
2019 doi
-
[59]
: GistVis : Automatic generation of word-scale visualizations from data-rich documents, 2025
Zou R., Tang Y., Chen J., Lu S., Lu Y., Yang Y., Ye C. : GistVis : Automatic generation of word-scale visualizations from data-rich documents, 2025. http://arxiv.org/abs/2502.03784 arXiv:2502.03784
2025 arXiv
Reviewed August 16, 2026 · model on record in the stance chip above.
Discussion (0). Continue with ORCID to comment.