REVIEW 3 major objections 5 minor 1 cited by
Starspots on eclipsing giant stars I.: The sample and eclipse mapping examples
T0 review · 3 major / 5 minor · reviewed 2026-08-16 · deepseek-v4-flash
Pith's one-line read Eclipse mapping of starspots on the giant primaries of three TESS binaries recovers spot temperatures, sizes, and longitudes that agree with full-light-curve modeling.
desk verdict A solid pilot study and a genuinely useful catalog, but the 'remarkable agreement' in the abstract is partly built in for two of the three stars; it needs a reframing, not new data. read the letter →
The pith
A machine-rendered reading of the paper's core claim, the machinery that carries it, and where it could break.
The reading
What carries the argument
The load-bearing device is the eclipse-mapping light-curve model: the planetary transit equations modified for two stars, with each spot adding a Gaussian-ramp 'plateau' brightness bump during the eclipse. The timing of a bump inside the eclipse is converted into spot longitude, while the chord of the secondary's path across the stellar disk yields latitude and radius; the number of spots per eclipse is decided by Bayes factors computed from the Bayesian information criterion. Independent time-series spot modeling of the full light curves with analytic circular-spot equations provides the cross-check that anchors the result.
What would settle it
Measure the radial velocities of the three binaries to determine their eccentricities and re-run the eclipse mapping in an eccentric-orbit model; if the recovered spot longitudes move away from the substellar point by more than the reported uncertainties, the substellar-spot claim fails. Doppler imaging of one of these giants in the same epoch would provide an independent check on the spot longitudes and latitudes.
Extended reading notes
Core claim
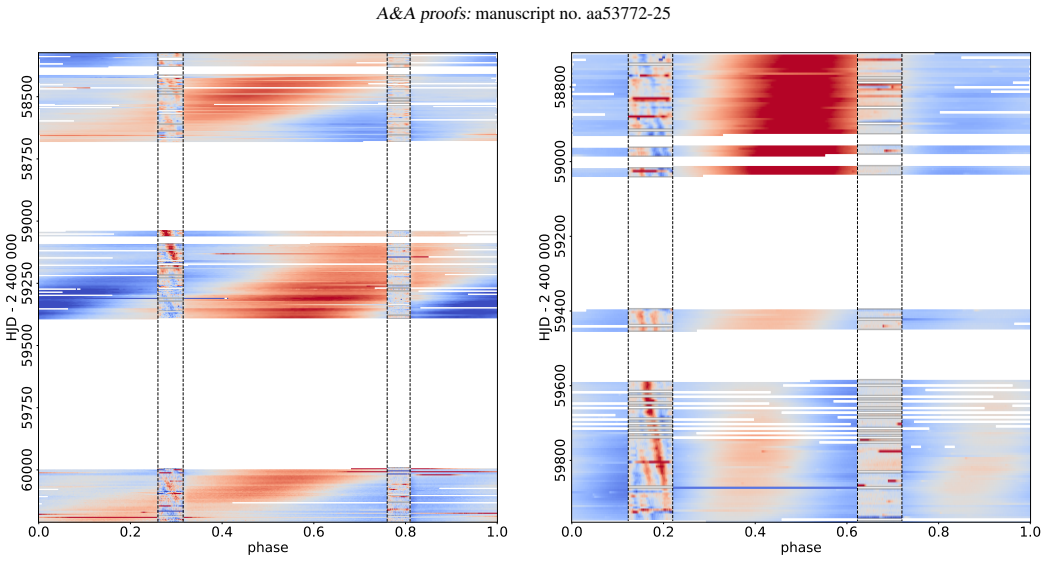
In the paper's own terms, the eclipse mapping technique previously applied to planets transiting spotted main-sequence stars is adapted to binaries where a small secondary scans a giant primary, and is demonstrated on TIC 235934420, TIC 271892852, and TIC 326257590. The spot bumps during primary eclipses are modeled as occultation features, and the resulting spot temperatures (about 3500-3700 K), angular radii (a few to roughly 25 degrees), and longitudes agree with the time-series spot modeling of the full TESS light curves. For one system the eclipse-mapping temperature is independently confirmed by two-color ZTF photometry, and for another the eclipse chord crosses latitudes near 40 degrees, giving direct evidence of high-latitude spots. All three giants show spots at or very near the substellar point, and the continuous TESS data reveal slow systematic drifts of spot longitudes over about a year.
Load-bearing premise
The mapping assumes circular orbits with primary and secondary eclipses separated by exactly half the orbital period, so a small eccentricity would change the companion's speed during the eclipse and shift every recovered spot longitude and the inferred scanned latitude.
Editorial extensions
If this is right
- The same eclipse mapping can be applied to the remaining binaries in the 29-system catalog, yielding spot latitudes, longitudes, and temperatures for a large sample of active giants.
- Because the two methods agree, spot temperatures taken from eclipse mapping can be fixed in full-light-curve modeling, reducing the degeneracy of one-color photometry.
- The direct high-latitude spot detection on TIC 271892852 shows that eclipse mapping can anchor spot latitudes that full light-curve modeling alone cannot determine.
- The slow longitude drifts measured for the three stars are consistent with weak differential rotation and can be followed year by year with TESS continuous-viewing data.
- The persistent spot at the substellar point suggests that tidal locking in these binaries systematically favors spot emergence on the hemisphere facing the companion.
Reading between the lines
- If substellar spots turn out to be a general property of tidally locked giant binaries, spot longitudes could serve as a clock for measuring the rate of tidal synchronization and the offset between orbital and rotational periods.
- The technique should transfer to subgiant or giant stars with transiting planets, where the same mapping could show whether active regions on evolved planet hosts concentrate at the subplanetary point.
- Because spots are modeled as circular and centrally occulted, the reported sizes are lower limits; joint inversion of several eclipse chords crossing the same spot could test the circular-spot assumption and recover spot shapes.
- Separating true differential rotation from spot emergence and decay will require a longer baseline, and the century-scale archival photometry already available for one target offers a direct way to extend the longitude tracking.
Signed reviews
Editorial analysis
A structured set of objections, weighed in public.
Referee Report
Summary. The manuscript presents a visually selected catalog of 29 eclipsing binaries with active giant primaries from TESS and then studies three systems in the TESS Continuous Viewing Zones (TIC 235934420, TIC 271892852, TIC 326257590). Starspot signatures during primary eclipses are modeled with a plateau-based eclipse-mapping approach, with the number of spots selected via Bayes factors and posterior sampling checked with the Gelman-Rubin statistic. The full out-of-eclipse light curves are independently modeled with time-series spot modeling, and the two sets of spot parameters are compared. The paper claims remarkable agreement between the two methods in spot temperatures, sizes, and longitudes, and that spots are always present at the substellar points of the tidally locked binaries.
Significance. If the eclipse-mapping results are correct, the paper demonstrates a valuable new application: spatially resolved spot information on giant stars in eclipsing binaries, including a direct high-latitude spot detection on TIC 271892852 and long-term spot tracking in the TESS CVZ. The inclusion of the contemporaneous two-color ZTF data for TIC 235934420 is a genuine strength, as are the explicitly stated MCMC convergence criterion (Gelman-Rubin below 1.05) and the Bayes-factor model comparison. However, the headline cross-method agreement is substantially built in for two of the three targets, because the full-light-curve model adopts the eclipse-mapping temperatures and latitudes as fixed inputs. The significance of the paper is therefore higher as a pilot methodology demonstration and catalog paper than as an independent validation of the eclipse-mapping temperatures and sizes.
major comments (3)
- [Sec. 4.6 and Sec. 6.2, Table 4] The claim of 'remarkable agreement' between eclipse mapping and full-light-curve solutions is not an independent validation for two of the three stars. In Sec. 4.6 the authors state that 'for the one-color TESS data, we had to suppose constant, typical spot temperatures based on the eclipse mapping results,' and Sec. 6.2 states that 'we used fixed spot temperatures resulting from the eclipse maps for all three giant stars.' Sec. 5.2 also fixes the TIC 271892852 latitude to the eclipse-mapping average of about 40 degrees. Because single-band TESS photometry cannot separately determine spot area and temperature contrast, the agreement in temperatures and in the radii that depend on them is partly built in by construction. The only genuinely independent cross-check in the paper is the contemporaneous ZTF two-color analysis for TIC 235934420 (Sec. 5.1 and Appendix B), which does support that one target. I recommend rewording the abstract and Sec. 6.2 to distinguish this internal consistency from the one independent temperature confirmation.
- [Abstract; Sec. 6.1; Table 3] The statement that 'spots are always present at the substellar points' overstates what the data support. The claim rests on only three binaries, and the scanned longitude ranges listed in Table 3 span roughly +/-65 to +/-77 degrees centered on the substellar point. The observations therefore demonstrate spots within a broad substellar-facing region, not necessarily at the substellar point itself. Please quantify the longitude uncertainty of individual spot detections and soften the claim accordingly, for example to 'spots are found within the scanned region centered near the substellar point in all three systems.'
- [Sec. 4.1 and Sec. 4.2] The eclipse-mapping longitude solution assumes circular orbits with primary and secondary eclipses separated by exactly P/2 (Sec. 4.1). For a small eccentricity, the secondary's sky-projected velocity during eclipse differs between the two conjunctions, shifting the time-to-longitude mapping and hence the recovered spot longitudes. This directly affects the association of spots with the substellar point. The paper does not quantify the size of this effect or place bounds on the eccentricity from the observed eclipse timing symmetry. Please add a sensitivity test varying e and the argument of periastron over plausible ranges, or give an explicit upper limit on e based on the approximately P/2 separation of the primary and secondary eclipses.
minor comments (5)
- [Fig. 17; Sec. 6.1; Appendix A.2] There are typographical object names: 'TIC 23594420' and 'TIC 32627590' in Sec. 6.1 and Fig. 17 should read TIC 235934420 and TIC 326257590, and 'TIC 23934420' in Appendix A.2 should be TIC 235934420.
- [Sec. 3.1] The cadence list '200-s, 600s and 1800s' has an inconsistent space and unit format; please make it uniform, e.g., '200-s, 600-s, and 1800-s.'
- [Appendix B, Fig. B.1] The caption states that latitudes are fixed, but the latitude panel in Fig. B.1 shows time-varying values with error bars. Please clarify whether the ZTF modeling used fixed or free latitudes.
- [Sec. 4.2 and Sec. 6.1] The longitude convention should be stated explicitly, in particular that longitude zero corresponds to the substellar point and the direction of increasing longitude; this would make the 'substellar point' claims in Sec. 6.1 easier to interpret.
- [Sec. 4.6 and Sec. 6.2] The use of the local light-curve maxima as the unspotted brightness level is a potential systematic bias for spot sizes; the authors acknowledge this issue in Sec. 4.6, but it should also be restated when the average spot radii and coverage values in Table 4 are interpreted as physical spot sizes.
Circularity Check
The claimed 'remarkable agreement' is partly built in: the full light curve models fix spot temperatures and latitudes to the eclipse-mapping values, so the temperature agreement is by construction for two of the three stars.
-
fitted input called prediction
[Abstract; Sect. 6.2 (Spot temperatures/contrasts/sizes); Table 4 note 1]
"Remarkable agreement is found between the starspot temperatures, sizes, and longitudes from the eclipse mapping results and the corresponding full light curve solutions. ... Based on this finding for the full light curve modeling we used fixed spot temperatures resulting from the eclipse maps for all three giant stars."
The full light curve modeling is run with spot temperatures fixed to the eclipse-mapping values (Table 4 note 1: “Average values based on eclipse mapping results, which are used in the full light curve modelings”). For TIC 271892852 and TIC 326257590 the subsequent “agreement” in temperature is therefore true by construction, not an independent validation. The size agreement is also conditioned on this input: Sect. 4.6 states that single-color TESS data have no temperature information, so with the temperature fixed, the fitted radii are not free to test the eclipse-mapping contrast; the paper’s statement that the size similarity “suggests that the spot contrasts (temperatures), which are kept constant ... are indeed well chosen” is a circular consistency check.
-
fitted input called prediction
[Sect. 4.6; Sect. 5.2; Sect. 6.1]
"constant latitudes were assumed around the scanned latitudes of the giants by the secondary stars ... The average is ≈40±17◦ (cf. Table 3) which we used as a fixed latitude for modeling the whole light curve ... Modeling the whole light curve using the latitudes that are safely known from eclipse mapping, we find spots near the same positions in the scanned region."
The time-series spot modeling fixes latitudes to the eclipse-mapping scanned latitudes, and then the paper reports that the two approaches “strengthen each other” and find spots near the same positions in the scanned region. The latitude component of that agreement is forced: the full light curve solutions cannot disagree in latitude because those latitudes were inserted as fixed inputs. Longitudes remain free parameters and their agreement is genuinely independent, so this step is partial rather than complete circularity.
full rationale
The paper is transparent about the coupling: Sections 4.6 and 6.2 explicitly state that the full light curve models adopt eclipse-mapping temperatures and scanned latitudes. Transparency does not remove the circularity, however. The abstract’s headline claim of “remarkable agreement” in spot temperatures reduces, for TIC 271892852 and TIC 326257590, to a comparison of a parameter with itself: the eclipse maps yield the temperatures, those exact values are fixed in the full light curve models, and the two are then reported as agreeing. The spot-size agreement is likewise weakened by the single-band degeneracy between spot area and temperature contrast, since the temperature was pre-assigned from eclipse mapping. The longitude agreement is independent and is the paper’s most solid comparative result, and the ZTF two-color measurement for TIC 235934420 provides a genuinely external temperature check. The “spots always present at the substellar points” claim is not circular by construction, but it is geometrically limited because the eclipse scans cover a broad longitude band (±65–77◦) centered on the substellar point, and only three systems are used. No load-bearing self-citation chain was found; the methodological citations to Haris et al. (2025) and Tuomi et al. (2024) are accompanied by an in-paper description of the model. Overall, the central validation claim is partially built in, but meaningful independent content remains.
Assumptions & free parameters
free parameters (6)
- Binary geometry parameters (k_f, k_r, i, a/R1, u1, u2) =
TIC 235934420: k_f = 29.30, k_r = 5.36, i = 88.68 deg, a/R1 = 5.24 (Table 3)
- Spot plateau amplitude A =
Fitted per spot event; not tabulated globally
- Spot temperature used in full-light-curve modeling =
3550 K (TIC 235934420), 3700 K (TIC 271892852), 3500 K (TIC 326257590)
- Number of spots per eclipse =
0-4, chosen by Bayes factor threshold B>150
- Spot latitudes in time-series modeling =
Fixed to scanned latitudes, e.g., +40 deg (TIC 271892852), +2 deg (TIC 326257590)
- Linear limb-darkening coefficient u =
0.66
assumptions (6)
- domain assumption The binary orbits are circular; primary and secondary eclipses are separated by P/2.
- domain assumption The spot-induced signal can be described by the plateau model in Eq. (3) with Gaussian ingress/egress.
- domain assumption The out-of-eclipse baseline is the unspotted brightness.
- domain assumption The limb-darkening law from Claret (2017) with u=0.66 applies to all three stars in the TESS bandpass.
- standard math Mandel & Agol (2002) transit equations remain valid when one star eclipses another, with the flux weighting in Eq. (2).
- standard math Jeffreys/Kass-Raftery Bayes-factor scale applies to the BIC-based model probabilities.
Cite this review
Pith. "Pith review of Starspots on eclipsing giant stars I.: The sample and eclipse mapping examples." pith.science (2026). https://pith.science/paper/CZDHS326
@misc{pith2026250415389,
  author       = {Pith},
  title        = {Pith review of: Starspots on eclipsing giant stars I.: The sample and eclipse mapping examples},
  year         = {2026},
  howpublished = {\url{https://pith.science/paper/CZDHS326}},
  note         = {Machine review of arXiv:2504.15389}
}
read the original abstract
Spotted stars in eclipsing binary systems allow us to gather significant information about the stellar surface inhomogeneities that is otherwise impossible from only photometric data. Starspots can be scanned using the eclipse (or transit) mapping technique, which takes advantage of the passage of a companion star (or planet) in front of a spotted giant star in a binary system. Based on the characteristics of their ultra-precise space photometric light curves, we compile a list of eclipsing binaries whose primary component is a spotted subgiant or giant star, with the aim of applying the eclipse mapping technique to them. Eclipsing binaries with giant primaries were selected from Transiting Exoplanet Survey Satellite (TESS) light curves by visual inspection. Spots showing up as bumps during eclipses are modeled with an eclipse mapping technique specialized for two stars, and the number of spots are found with the help of Bayes factors. The full light curves themselves were analyzed with time series spot modeling, and the results of the two approaches were compared. We present a catalog of 29 eclipsing close binaries with active giant components and analyze TIC 235934420, TIC 271892852 and TIC 326257590 from the Continuous Viewing Zones (CVZ) of TESS. Remarkable agreement is found between the starspot temperatures, sizes, and longitudes from the eclipse mapping results and the corresponding full light curve solutions. Spots are always present at the substellar points of the tidally locked binaries. Data from the TESS CVZ allow us to follow the changes of spot patterns on yearly timescales.
Figures


Figures from the paper (11 more)



Forward citations
Cited by 1 Pith paper
-
The TESS Ten Thousand Catalog: 10,001 uniformly-vetted and -validated Eclipsing Binary Stars detected in Full-Frame Image data by machine learning and analyzed by citizen scientists
A uniformly vetted catalog of 10,001 eclipsing binary stars from TESS full-frame images, including 7,936 new systems and 2,065 corrected ephemerides.
Reference graph
Works this paper leans on
-
[1]
Araújo, A. & Valio, A. 2021, ApJ, 907, L5 Araújo, A. & Valio, A. 2023, ApJ, 956, 141
work page 2021
-
[2]
Bailer-Jones, C. A. L., Rybizki, J., Fouesneau, M., Demleitner, M., & Andrae, R. 2021, AJ, 161, 147
2021
-
[3]
Balona, L. A. 1987, South African Astronomical Observatory Circular, 11, 1
work page 1987
- [4]
- [5]
-
[6]
2017, A&A, 600, A30 Collier Cameron, A
Claret, A. 2017, A&A, 600, A30 Collier Cameron, A. 1997, MNRAS, 287, 556 Collier Cameron, A. & Hilditch, R. W. 1997, MNRAS, 287, 567
work page 2017
-
[7]
& Kolláth, Z
Csubry, Z. & Kolláth, Z. 2004, in ESA Special Publication, V ol. 559, SOHO 14 Helio- and Asteroseismology: Towards a Golden Future, ed. D. Danesy, 396
2004
- [8]
Show all 62 references
-
[9]
F., Wolter, U., Schröter, S., & Schmitt, J
Czesla, S., Huber, K. F., Wolter, U., Schröter, S., & Schmitt, J. H. M. M. 2009, A&A, 505, 1277
2009
-
[10]
Davenport, J. R. A., Hebb, L., & Hawley, S. L. 2015, in Cambridge Workshop on Cool Stars, Stellar Systems, and the Sun, V ol. 18, 18th Cambridge Workshop on Cool Stars, Stellar Systems, and the Sun, ed. G. T. van Belle & H. C. Harris, 399–404
2015
-
[11]
G., Mathieu, R
Dixon, D., Stassun, K. G., Mathieu, R. D., Tayar, J., & Cao, L. 2025, arXiv e-prints, arXiv:2504.05561
2025 arXiv
-
[12]
2014, ApJ, 785, 5
Gaulme, P., Jackiewicz, J., Appourchaux, T., & Mosser, B. 2014, ApJ, 785, 5
2014
-
[13]
2016, ApJ, 832, 121
Gaulme, P., McKeever, J., Jackiewicz, J., et al. 2016, ApJ, 832, 121
2016
-
[14]
M., Leiner, E
Geller, A. M., Leiner, E. M., Bellini, A., et al. 2017, ApJ, 840, 66
2017
-
[15]
2001, Bernoulli, 7, 223
Haario, H., Saksman, E., & Tamminen, J. 2001, Bernoulli, 7, 223
2001
-
[16]
Hall, D. S. 1976, in Astrophysics and Space Science Library, V ol. 60, IAU Col- loq. 29: Multiple Periodic Variable Stars, ed. W. S. Fitch, 287
1976
-
[17]
2025, arXiv e-prints, arXiv:2502.18129
Haris, A., Tuomi, M., & Hackman, T. 2025, arXiv e-prints, arXiv:2502.18129
2025
-
[18]
Hastings, W. K. 1970, Biometrika, 57, 97
1970
-
[19]
S., & Atri, D
Herbst, K., Papaioannou, A., Airapetian, V . S., & Atri, D. 2021, ApJ, 907, 89
2021
-
[20]
2007, Mem
Holzwarth, V . 2007, Mem. Soc. Astron. Italiana, 78, 271
2007
-
[21]
& Schüssler, M
Holzwarth, V . & Schüssler, M. 2003, A&A, 405, 303
2003
-
[22]
X., Vanderburg, A., Pál, A., et al
Huang, C. X., Vanderburg, A., Pál, A., et al. 2020, Research Notes of the Amer- ican Astronomical Society, 4, 204
2020
-
[23]
Hunter, J. D. 2007, Computing in Science and Engineering, 9, 90 I¸ sık, E., Solanki, S. K., Cameron, R. H., & Shapiro, A. I. 2024, ApJ, 976, 215
2007
-
[24]
1961, Theory of Probability, International series of monographs on physics (Clarendon Press)
Jeffreys, H. 1961, Theory of Probability, International series of monographs on physics (Clarendon Press)
1961
-
[25]
M., Twicken, J
Jenkins, J. M., Twicken, J. D., McCauliff, S., et al. 2016, in Software and Cyber- infrastructure for Astronomy IV , ed. G. Chiozzi & J. C. Guzman, V ol. 9913, International Society for Optics and Photonics (SPIE), 99133E
2016
-
[26]
Kass, R. E. & Raftery, A. E. 1995, Journal of the American Statistical Associa- tion, 90, 773 K˝ovári, Zs. & Bartus, J. 1997, A&A, 323, 801 K˝ovári, Zs., Oláh, K., Kriskovics, L., et al. 2017, Astronomische Nachrichten, 338, 903
1995
-
[27]
2020, A&A, 637, A43
Klutsch, A., Frasca, A., Guillout, P., et al. 2020, A&A, 637, A43
2020
-
[28]
B., Rappaport, S
Kostov, V . B., Rappaport, S. A., Borkovits, T., et al. 2024, ApJ, 974, 25 Kovács, G., Zucker, S., & Mazeh, T. 2002, A&A, 391, 369
2024
-
[29]
2023, A&A, 674, A143
Kriskovics, L., K˝ovári, Zs., Seli, B., et al. 2023, A&A, 674, A143
2023
-
[30]
Kristiansen, M. H. K., Rappaport, S. A., Vanderburg, A. M., et al. 2022, PASP, 134, 074401
2022
-
[31]
M., Geller, A
Leiner, E. M., Geller, A. M., Gully-Santiago, M. A., Gosnell, N. M., & Tof- flemire, B. M. 2022, ApJ, 927, 222 Lightkurve Collaboration, Cardoso, J. V . d. M., Hedges, C., et al. 2018, Lightkurve: Kepler and TESS time series analysis in Python, Astrophysics Source Code Library...
2022
-
[32]
2019, AJ, 157, 64
Luger, R., Agol, E., Foreman-Mackey, D., et al. 2019, AJ, 157, 64
2019
-
[33]
Luger, R., Foreman-Mackey, D., Hedges, C., & Hogg, D. W. 2021, AJ, 162, 123
2021
-
[34]
& Agol, E
Mandel, K. & Agol, E. 2002, The Astrophysical Journal, 580, L171
2002
-
[35]
C., Berdyugina, S
Marsden, S. C., Berdyugina, S. V ., Donati, J. F., Eaton, J. A., & Williamson, M. H. 2007, Astronomische Nachrichten, 328, 1047
2007
-
[36]
J., Laher, R
Masci, F. J., Laher, R. R., Rusholme, B., et al. 2019, PASP, 131, 018003
2019
-
[37]
D., van den Berg, M., Torres, G., et al
Mathieu, R. D., van den Berg, M., Torres, G., et al. 2003, AJ, 125, 246
2003
-
[38]
W., Rosenbluth, M
Metropolis, N., Rosenbluth, A. W., Rosenbluth, M. N., Teller, A. H., & Teller, E. 1953, J. Chem. Phys., 21, 1087 Oláh, K., K˝ovári, Zs., Günther, M. N., et al. 2021, A&A, 647, A62 Oláh, K., Moór, A., K˝ovári, Zs., et al. 2014, A&A, 572, A94 Oláh, K., Seli, B., K˝ovári, Zs., Kr...
1953
-
[39]
H., An, D., Molenda- ˙Zakowicz, J., et al
Pinsonneault, M. H., An, D., Molenda- ˙Zakowicz, J., et al. 2012, ApJS, 199, 30
2012
-
[40]
L., Moutou, C., et al
Pont, F., Gilliland, R. L., Moutou, C., et al. 2007, A&A, 476, 1347
2007
-
[41]
P., Kostov, V
Powell, B. P., Kostov, V . B., Rappaport, S. A., et al. 2021, AJ, 161, 162 Prša, A., Conroy, K. E., Horvat, M., et al. 2016, ApJS, 227, 29
2021
-
[42]
R., Winn, J
Ricker, G. R., Winn, J. N., Vanderspek, R., et al. 2014, in Society of Photo- Optical Instrumentation Engineers (SPIE) Conference Series, V ol. 9143, Space Telescopes and Instrumentation 2014: Optical, Infrared, and Millime- ter Wave, ed. J. Oschmann, Jacobus M., M. Clampin, G...
2014
-
[43]
& Winn, J
Sanchis-Ojeda, R. & Winn, J. N. 2011, ApJ, 743, 61
2011
-
[44]
N., Holman, M
Sanchis-Ojeda, R., Winn, J. N., Holman, M. J., et al. 2011, ApJ, 733, 127
2011
-
[45]
Scharlemann, E. T. 1981, ApJ, 246, 292
1981
-
[46]
Scharlemann, E. T. 1982, ApJ, 253, 298
1982
-
[47]
R., Hartman, J
Schmitt, A. R., Hartman, J. D., & Kipping, D. M. 2019, arXiv e-prints, arXiv:1910.08034
2019 arXiv
-
[48]
2022, A&A, 659, A3
Seli, B., Oláh, K., Kriskovics, L., et al. 2022, A&A, 659, A3
2022
-
[49]
Z., et al
Shappee, B., Prieto, J., Stanek, K. Z., et al. 2014, in American Astronomical So- ciety Meeting Abstracts, V ol. 223, American Astronomical Society Meeting Abstracts #223, 236.03
2014
-
[50]
Silva, A. V . R. 2003, ApJ, 585, L147
2003
-
[51]
2008, ApJ, 683, L179
Silva-Valio, A. 2008, ApJ, 683, L179
2008
-
[52]
G., Oelkers, R
Stassun, K. G., Oelkers, R. J., Paegert, M., et al. 2019, AJ, 158, 138
2019
-
[53]
Strassmeier, K. G. & Bartus, J. 2000, A&A, 354, 537
2000
-
[54]
G., K ˝ovári, Zs., Weber, M., & Granzer, T
Strassmeier, K. G., K ˝ovári, Zs., Weber, M., & Granzer, T. 2024, Nature Com- munications, 15, 9986
2024
-
[55]
2024, Submitted Article number, page 15 of 20 A&A proofs: manuscript no
Tuomi, M., Haris, A., & Thomas, H. 2024, Submitted Article number, page 15 of 20 A&A proofs: manuscript no. aa53772-25 van der Walt, S., Colbert, S. C., & Varoquaux, G. 2011, Computing in Science and Engineering, 13, 22 Van Eylen, V . & Albrecht, S. 2015, ApJ, 808, 126
2024
-
[56]
2024, Universe, 10, 313
Vida, K., K˝ovári, Zs., Leitzinger, M., et al. 2024, Universe, 10, 313
2024
-
[57]
E., et al
Virtanen, P., Gommers, R., Oliphant, T. E., et al. 2020, Nature Methods, 17, 261
2020
-
[58]
2007, Astronomische Nachrichten, 328, 1075 Wes McKinney
Weber, M. 2007, Astronomische Nachrichten, 328, 1075 Wes McKinney. 2010, in Proceedings of the 9th Python in Science Conference, ed. Stéfan van der Walt & Jarrod Millman, 56 – 61
2007
-
[59]
N., Johnson, J
Winn, J. N., Johnson, J. A., Howard, A. W., et al. 2010, ApJ, 723, L223
2010
-
[60]
Wolter, U., Schmitt, J. H. M. M., Huber, K. F., et al. 2009, A&A, 504, 561
2009
-
[61]
R., & Cao, D
Xiang, Y ., Gu, S., Collier Cameron, A., Barnes, J. R., & Cao, D. 2024, ApJ, 976, 217
2024
-
[62]
H., Hua, Z
Zhao, Z. H., Hua, Z. Q., Cheng, X., Li, Z. Y ., & Ding, M. D. 2024, ApJ, 961, 130 Article number, page 16 of 20 K. Oláh et al.: Starspots on eclipsing giant stars I. Appendix A: Time-series spot modeling - details A.1. Spot latitudes Experiments were made using free latitudes ...
1997
Reviewed August 16, 2026 · model on record in the stance chip above.
Discussion (0). Continue with ORCID to comment.