REVIEW 3 major objections 6 minor 36 references
Accounting for spillover when using the augmented synthetic control method: estimating the effect of localized COVID-19 lockdowns in Chile
T0 review · 3 major / 6 minor · reviewed 2026-08-16 · deepseek-v4-flash
Pith's one-line read Stratifying synthetic-control donor pools by neighbor treatment status separates the direct, total, and spillover effects of localized lockdowns when neighboring regions are also treated.
desk verdict A clean and useful extension of Ridge ASCM to interference via stratified donor pools, but the binary neighbor summary is a genuine soft spot that needs addressing before publication. read the letter →
The pith
A machine-rendered reading of the paper's core claim, the machinery that carries it, and where it could break.
The reading
What carries the argument
The engine is the Stable Neighbor Treatment Value Assumption, written $Y_{it}(a,q)$, which says unit $i$'s outcome depends on its own treatment $a$ and a binary summary $q(i)t$ of whether any neighbor is treated. Under that assumption, ASCM-SC partitions post-treatment units into treated-with-treated-neighbor ($S_{11}$), untreated-with-treated-neighbor ($S_{01}$), and untreated-with-no-treated-neighbor ($S_{00}$). For each treated unit, a Ridge-augmented synthetic control is fitted to units in $S_{01} \setminus N(i)$ to estimate the counterfactual $Y(0,1)$ and hence the direct effect, and to units in $S_{00}$ to estimate $Y(0,0)$ and hence the total effect; subtracting the two estimates gives the spillover effect. The Ridge augmentation corrects pre-treatment imbalance between the treated unit and its donor pool, and conformal inference converts post-treatment residuals into pointwise confidence intervals.
What would settle it
Simulate data in which the true potential outcome is $Y_{it}(a, q(i)t)$ with $q(i)t$ equal to the proportion of treated neighbors, then apply ASCM-SC's binary summary and measure the bias of the direct-effect estimate as the number of treated neighbors varies. If bias rises with neighbor count while the binary version stays low, the estimator's performance is an artifact of the all-or-nothing spillover assumption.
Extended reading notes
Core claim
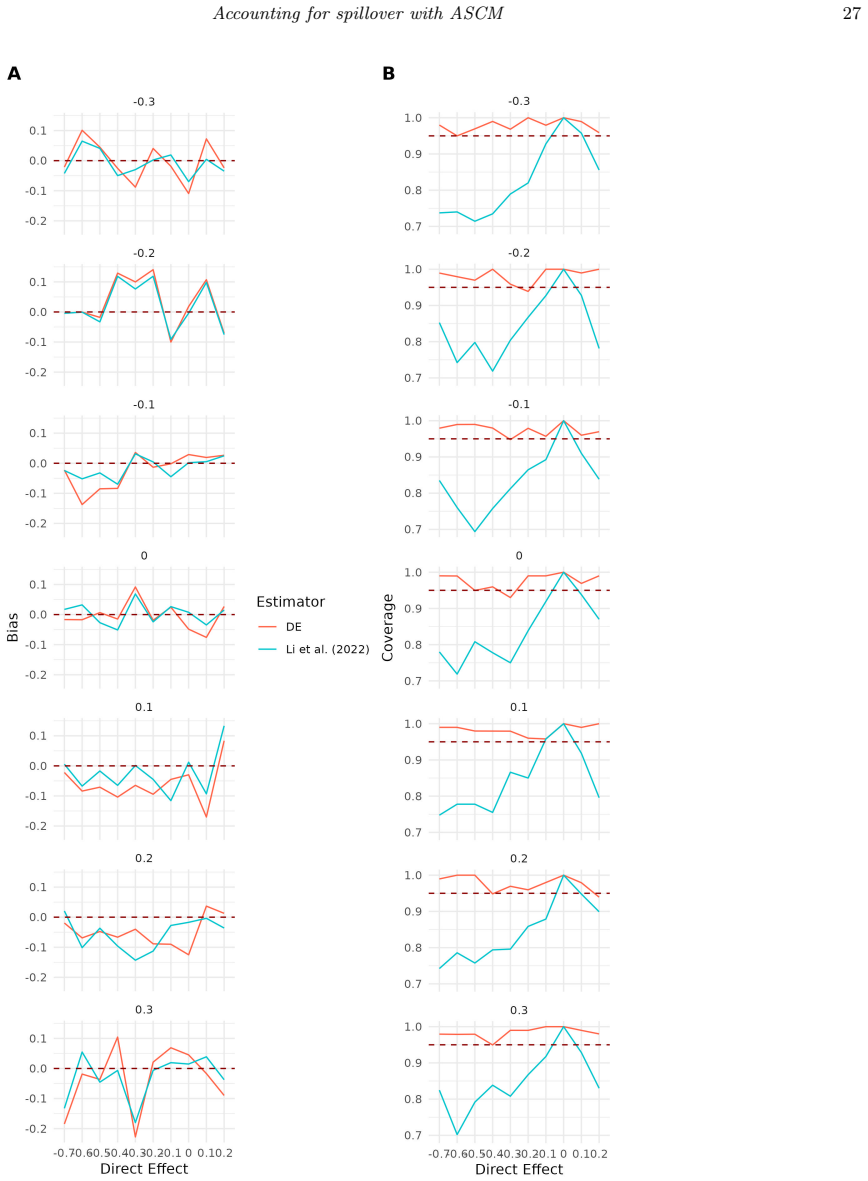
The paper's central claim is that under interference, the standard synthetic-control donor pool is contaminated: control units that are untreated but have a treated neighbor are experiencing the spillover outcome $Y(0,1)$, not the pure no-treatment outcome $Y(0,0)$, so using them as controls for a treated unit conflates direct and spillover effects. ASCM-SC removes that contamination by stratifying donors: for each treated unit with a treated neighbor, the direct effect is estimated from synthetic controls built on units in $S_{01} \setminus N(i)$ (untreated, with a treated neighbor, outside the unit's own neighborhood), and the total effect from synthetic controls built on units in $S_{00}$ (untreated, no treated neighbor); the difference estimates the spillover effect. Simulations show the direct-effect estimator generally has smaller bias than naive Ridge ASCM except when no spillover is present, and smaller bias than an existing inclusive synthetic control competitor. In the Chile application, estimated direct and total effects of the first-wave lockdowns on $\log(R_t)$ vary across the seven treated comunas, with most conformal confidence intervals containing zero.
Load-bearing premise
The load-bearing assumption is that spillover is all-or-nothing: a unit's outcome responds to whether any neighbor is treated, not to how many or which neighbors are treated, so units in the "untreated but neighboring a treated unit" group are interchangeable as controls.
Editorial extensions
If this is right
- In multi-unit rollouts with spatial clustering, estimates from a naive synthetic control blend the treated unit's own effect with the effect of neighbors' treatment; ASCM-SC keeps these separate by construction.
- The direct-effect estimator's bias advantage over naive Ridge ASCM grows as the spillover effect grows, and disappears only when there is no spillover.
- Total-effect estimates provide the policy-relevant quantity of going under lockdown together with neighbors, while the difference between total and direct gives the spillover contribution.
- Conformal inference intervals used with ASCM-SC maintain at least nominal coverage in the simulations, usually overcovering rather than undercovering.
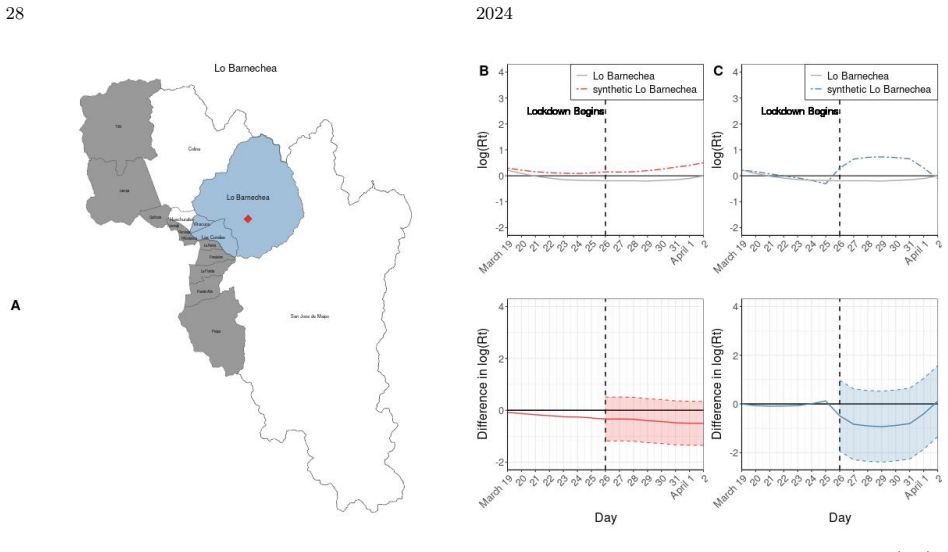
- Applied to the seven Chilean comunas that locked down in late March 2020, the method finds estimated reductions in $R_t$ from direct and neighbor lockdowns that vary across comunas, but most confidence intervals include zero.
Reading between the lines
- If the true spillover depends on how many or which neighbors are treated, the binary $q(i)t$ summary mis-specifies the counterfactual; a natural test is to re-estimate with $q(i)t$ equal to the proportion of neighboring population under lockdown, a covariate the Chile dataset already contains.
- Because ASCM-SC needs enough units in each stratum, its reliability in sparse spatial panels is an open practical question; pooling donors across treated units or stronger ridge regularization might be needed.
- The stratified-donor idea is not tied to ASCM specifically and could be grafted onto other panel causal estimators whenever interference is monotone in neighbor exposure, giving a family of spillover-aware estimators.
Signed reviews
Editorial analysis
A structured set of objections, weighed in public.
Referee Report
Summary. The paper extends the Augmented Synthetic Control Method (ASCM) to settings with interference by proposing Ridge ASCM with stratified controls (ASCM-SC). Under the Stable Neighbor Treatment Value Assumption with a binary summary of whether any neighbor is treated, the authors define direct, total, and spillover effects and estimate them by using stratified donor pools: untreated units with at least one treated neighbor (S01) for the direct effect, and untreated units with no treated neighbors (S00) for the total effect. The method is evaluated in simulations calibrated to a COVID-19 lockdown application in Chile, comparing ASCM-SC to naive ASCM, iSCM, and a modification from Li et al. (2022), and is then applied to estimate lockdown effects on the instantaneous reproduction number in seven Chilean comunas.
Significance. If the proposed method works as claimed, it offers a practical extension of synthetic control methods to a common policy setting where multiple spatially clustered units are treated and spillover between treated and untreated units is plausible. The paper is clearly written, the estimators are defined precisely, and the simulation results support the bias-reduction claim under the stated data-generating processes. The authors also provide an empirical application that illustrates the method's use. However, the central contribution depends heavily on the binary neighbor-treatment summary, which may be unrealistic for the motivating application. The claim that the stratified design preserves the validity of existing error bounds is not substantiated. These issues limit the generalizability of the method and the strength of the empirical conclusions.
major comments (3)
- [Section 3.2.1, Eq. (6)] The binary neighbor-summary assumption q(i)t = 1 if any neighbor is treated is load-bearing for the direct-effect estimator. Under this assumption, all units in S01 are treated as exchangeable for Y(0,1), regardless of how many or which neighbors are treated. In the motivating application, the covariate 'proportion of the population in neighboring municipalities under lockdown' (Section 5) indicates that spillover intensity is likely dose-dependent. If spillover magnitude varies with the number or proportion of treated neighbors, then S01 donors with different neighbor-treatment configurations have different underlying Y(0,1) values, and the synthetic control formed from them cannot represent the treated unit's counterfactual. The paper does not report simulations in which the spillover effect depends on the number or proportion of treated neighbors, so the central bias-reduction claim is not tested under this realistic violation. Please either relax the binary summary (e.g., by stratifying on the proportion of treated neighbors) or explicitly characterize the conditions under which ASCM-SC remains approximately unbiased.
- [Section 3.3.3] The claim that stratifying controls 'preserves the independence assumption' and therefore 'ensures that the bias bounds described above remain valid' is asserted without proof. The error bounds in Ben-Michael et al. (2021) assume independent errors across units and time. Interference generally induces dependence through shared latent factors, spatial correlation, or the treatment status of neighbors; stratifying the donor pool does not by itself restore independence. Even under the binary q(i)t assumption, outcomes of the treated unit and the S01 donors may be correlated. Provide a formal argument for why the existing bounds apply, or soften the claim to a heuristic statement. This is important because the conformal inference procedure in Section 3.2.4 also relies on exchangeability of residuals, which is not established in the presence of interference.
- [Section 4.1] The simulation study design should be described in the main text, at least to the extent of clarifying whether the DGP generates spillover effects that are binary (any neighbor treated) or dose-dependent (varying with the proportion or number of treated neighbors). As written, the phrase 'spillover effect due to some portion of neighbors being treated' together with the binary q(i)t notation creates ambiguity. If all simulations use binary spillover, the claim 'in general, the bias of the direct effect estimate is smaller when using ASCM-SC compared to naive ASCM' is established only for that special case. The paper would be strengthened by including a DGP where spillover intensity depends on the proportion of treated neighbors, which is the setting suggested by the Chile application.
minor comments (6)
- [Title page / author line] The author name 'T aylor' should be 'Taylor' and the municipality '˜Nu˜ noa' should be 'Ñuñoa'.
- [Section 3.1.1] The sentence 'Throughout, P indicates PN i=2' is malformed and should be rewritten, e.g., 'Throughout, summations are over i = 2,...,N unless noted otherwise.'
- [Section 3.2.1] The definition of q(i)t is introduced as 'a binary function' but is later described with 'some proportion of N(i)' in the text and in the estimand definitions. Since q(i)t is binary, please consistently clarify that q(i)t = 1 if at least one neighbor is treated, and avoid the word 'proportion' in the definition of the effects.
- [Supplementary materials] The paper states that Web Appendices A and B are 'available upon request.' For a journal submission, these materials should be included as supplementary files for the review process.
- [Section 5] The pre-intervention period is described as 'the week prior to the first wave of lockdowns.' Please state the exact number of pre-treatment time points T0 used in the analysis, as this affects the reliability of the ASCM fit and the conformal inference procedure.
- [Figure captions] The captions for Figures 1–5 should specify what each panel displays in more detail, particularly the units of the outcome (log(Rt)) and the meaning of 'bias' and 'coverage' in the simulation figures.
Circularity Check
No significant circularity: the direct and total effect estimates are post-treatment gaps from synthetic controls fit on pre-treatment data, and the estimand is not an input to any fitted parameter.
full rationale
Walking the derivation chain: Section 3.2 defines potential outcomes under SNTVA with a binary neighbor summary q(i)t, and Section 3.2.3 partitions units into S00, S01, S10, and S11. The counterfactual estimates Yhat_it(0,1) and Yhat_it(0,0) are Ridge ASCM weighted combinations of units in S01\N(i) and S00, respectively, with weights fit by minimizing pre-treatment imbalance in equation (5). The target quantities tau_DE and tau_TE are then computed as the post-treatment difference between the observed Yit and these synthetic controls, per equations (6) and (7). No fitted parameter equals, or is defined in terms of, the estimand; the estimand does not appear in the fitting objective. The central identifying assumption—that outcomes depend on neighbors' treatments only through the binary q(i)t—is an exchangeability and robustness assumption, not a circular reduction. If the true spillover is dose-dependent, the S01 donor pool is misspecified, which is a bias threat rather than a case of the prediction being constructed from the answer. The only self-citation, Krajewski and Hudgens (2024) in Section 3.1.2, is background for ASCM alongside the external Ben-Michael et al. (2021) reference and does not carry the manuscript's central claim. Section 3.3.3's assertion that stratification preserves the error bounds is unproved in the text, but that is a missing-proof and robustness concern, not circularity. The simulation comparisons in Section 4 use externally specified DGPs with known true effects, so the reported bias reductions are not forced by construction.
Assumptions & free parameters
free parameters (1)
- ridge penalty lambda_ridge =
selected via cross-validation, not reported in paper
assumptions (5)
- domain assumption Stable Neighbor Treatment Value Assumption: Yit(a)=Yit(ai, aN(i)), outcomes depend only on own treatment and treatments of immediate neighbors.
- ad hoc to paper Binary neighbor summary: q(i)t is a binary indicator of whether any neighbor is treated, so spillover effects do not depend on the number or proportion of treated neighbors.
- domain assumption Exchangeability of time residuals for conformal inference.
- domain assumption Sufficient numbers of S01 and S00 donor units outside each treated unit's neighborhood, with similar pre-treatment characteristics.
- domain assumption Synthetic control model (linear factor or autoregressive) underlies outcomes and there are no unobserved confounders affecting both treatment and outcomes.
Cite this review
Pith. "Pith review of Accounting for spillover when using the augmented synthetic control method: estimating the effect of localized COVID-19 lockdowns in Chile." pith.science (2026). https://pith.science/paper/UKT2S3OK
@misc{pith2026250416244,
  author       = {Pith},
  title        = {Pith review of: Accounting for spillover when using the augmented synthetic control method: estimating the effect of localized COVID-19 lockdowns in Chile},
  year         = {2026},
  howpublished = {\url{https://pith.science/paper/UKT2S3OK}},
  note         = {Machine review of arXiv:2504.16244}
}
read the original abstract
The implementation of public health policies, particularly in a single or small set of units (e.g., regions), can create complex dynamics with effects extending beyond the directly treated areas. This paper examines the direct effect of COVID-19 lockdowns in Chile on the comunas where they were enacted and the spillover effect from neighboring comunas. To draw inference about these effects, the Augmented Synthetic Control Method (ASCM) is extended to account for interference between neighboring units by introducing a stratified control framework. Specifically, Ridge ASCM with stratified controls (ASCM-SC) is proposed to partition control units based on treatment exposure. By leveraging control units that are untreated, or treated but outside the treated unit's neighborhood, this method estimates both the direct and spillover effects of intervention on treated and neighboring units. Simulations demonstrate improved bias reduction under various data-generating processes. ASCM-SC is applied to estimate the direct and total (direct + indirect) effects of COVID-19 lockdowns in Chile at the start of the COVID-19 pandemic. This method provides a more flexible approach for estimating the effects of public health interventions in settings with interference.
Figures


Figures from the paper (2 more)

Reference graph
Works this paper leans on
-
[1]
Abadie, A. (2021). Using synthetic controls: Feasibility, data requirements, and methodological aspects. Journal of Economic Literature 59, 391--425
work page 2021
-
[2]
Abadie, A., Diamond, A., and Hainmueller, J. (2010). Synthetic control methods for comparative case studies: Estimating the effect of California's tobacco control program. Journal of the American Statistical Association 105, 493--505
work page 2010
-
[3]
Abadie, A., Diamond, A., and Hainmueller, J. (2015). Comparative politics and the synthetic control method. American Journal of Political Science 59, 495--510
work page 2015
-
[4]
Abadie, A. and Gardeazabal, J. (2003). The economic costs of conflict: A case study of the Basque Country . American Economic Review 93, 113--132
work page 2003
-
[5]
Abadie, A. and L'Hour, J. (2021). A penalized synthetic control estimator for disaggregated data. Journal of the American Statistical Association 116, 1817--1834
work page 2021
-
[6]
Agarwal, A., Cen, S. H., Shah, D., and Yu, C. L. (2023). Network synthetic interventions: A causal framework for panel data under network interference
work page 2023
-
[7]
J., Misra, V., Shah, D., and Shen, D
Amjad, M. J., Misra, V., Shah, D., and Shen, D. (2019). mrsc: Multidimensional robust synthetic control. Proceedings of the ACM on Measurement and Analysis of Computing Systems 3,
work page 2019
-
[8]
Arkhangelsky, D., Athey, S., Hirshberg, D. A., Imbens, G. W., and Wager, S. (2021). Synthetic difference-in-differences. American Economic Review 111, 4088--4118
work page 2021
Show all 36 references
-
[9]
Athey, S., Bayati, M., Doudchenko, N., Imbens, G., and Khosravi, K. (2020). Matrix completion methods for causal panel data models
2020
-
[10]
Ben-Michael, E., Feller, A., and Rothstein, J. (2021). The augmented synthetic control method. Journal of the American Statistical Association 116, 1--27
2021
-
[11]
Ben-Michael, E., Feller, A., and Rothstein, J. (2022). Synthetic controls with staggered adoption. Journal of the Royal Statistical Society Series B: Statistical Methodology 84, 351--381
2022
-
[12]
and Dowd, C
Cao, J. and Dowd, C. (2019). Estimation and inference for synthetic control methods with spillover effects
2019
-
[13]
D., Feng, Y., and Titiunik, R
Cattaneo, M. D., Feng, Y., and Titiunik, R. (2021). Prediction intervals for synthetic control methods. Journal of the American Statistical Association 116, 1865--1880
2021
-
[14]
Chernozhukov, V., Wuthrich, K., and Zhu, Y. (2024). A t -test for synthetic controls
2024
-
[15]
Chernozhukov, V., Wüthrich, K., and Zhu, Y. (2019). Practical and robust t-test based inference for synthetic control and related methods
2019
-
[16]
M., Fraser, C., and Cauchemez, S
Cori, A., Ferguson, N. M., Fraser, C., and Cauchemez, S. (2013). A New Framework and Software to Estimate Time-Varying Reproduction Numbers During Epidemics . American Journal of Epidemiology 178, 1505--1512
2013
-
[17]
and Mellace, G
Di Stefano, R. and Mellace, G. (2024). The inclusive synthetic control method
2024
-
[18]
and Imbens, G
Doudchenko, N. and Imbens, G. W. (2016). Balancing, regression, difference-in-differences and synthetic control methods: A synthesis. NBER Working Paper 22791, National Bureau of Economic Research
2016
-
[19]
and Possebom, V
Firpo, S. and Possebom, V. (2018). Synthetic control method: Inference, sensitivity analysis and confidence sets. Journal of Causal Inference 6, 20160026
2018
-
[20]
M., and Mealli, F
Forastiere, L., Airoldi, E. M., and Mealli, F. (2021). Identification and estimation of treatment and interference effects in observational studies on networks. Journal of the American Statistical Association 116, 901--918
2021
-
[21]
Grossi, G., Mariani, M., Mattei, A., Lattarulo, P., and \" O ner, O. (2024). Direct & spillover effects of a new tramway line on the commercial vitality of peripheral streets: A synthetic-control approach. Journal of the Royal Statistical Society Series A: Statistics in Society
2024
-
[22]
Hainmueller, J. (2012). Entropy balancing for causal effects: A multivariate reweighting method to produce balanced samples in observational studies. Political Analysis 20, 25--46
2012
-
[23]
Killick, R., Fearnhead, P., and Eckley, I. (2012). Optimal detection of changepoints with a linear computational cost. Journal of the American Statistical Association 107, 1590--1598
2012
-
[24]
and Hudgens, M
Krajewski, T. and Hudgens, M. (2024). The augmented synthetic control method in public health and biomedical research. Statistical Methods in Medical Research 33, 376--391
2024
-
[25]
J., Nikolova, S., and Sutton, M
Kreif, N., Grieve, R., Hangartner, D., Turner, A. J., Nikolova, S., and Sutton, M. (2016). Examination of the synthetic control method for evaluating health policies with multiple treated units. Health Economics 25, 1514--1528
2016
-
[26]
A., and Zubizarreta, J
Li, Y., Undurraga, E. A., and Zubizarreta, J. R. (2022). Effectiveness of localized lockdowns in the C ovid-19 pandemic. American Journal of Epidemiology 191, 812--824
2022
-
[27]
Melnychuk, A. (2024). Iterative synthetic control method: A comparative study. arXiv preprint arXiv:2405.01645
2024 arXiv
-
[28]
and Bojinov, I
Menchetti, F. and Bojinov, I. (2022). Estimating the effectiveness of permanent price reductions for competing products using multivariate bayesian structural time series models. Annals of Applied Statistics 16, 414--435
2022
-
[29]
Ogburn, E. L. and VanderWeele, T. J. (2014). Causal diagrams for interference. Statistical Science 29, 559--578
2014
-
[30]
W., Saunders, J., and Kilmer, B
Robbins, M. W., Saunders, J., and Kilmer, B. (2017). A framework for synthetic control methods with high-dimensional, micro-level data: Evaluating a neighborhood-specific crime intervention. Journal of the American Statistical Association 112, 109--126
2017
-
[31]
Rubin, D. B. (1980). Randomization analysis of experimental data: The fisher randomization test comment. Journal of the American Statistical Association 75, 591--593
1980
-
[32]
Tchetgen Tchetgen, E. J. and VanderWeele, T. J. (2012). On causal inference in the presence of interference. Statistical Methods in Medical Research 21, 55--75
2012
-
[33]
Zhao, Q., Ju, N., Bacallado, S., and Shah, R. D. (2021). BETS: The dangers of selection bias in early analyses of the coronavirus disease (COVID-19) pandemic . The Annals of Applied Statistics 15, 363 -- 390
2021
-
[34]
write newline
" write newline "" before.all 'output.state := FUNCTION fin.entry add.period write newline FUNCTION new.block output.state before.all = 'skip after.block 'output.state := if FUNCTION new.sentence output.state after.block = 'skip output.state before.all = 'skip after.sentence '...
-
[35]
Cox, D. R. (1972). Regression models and life tables (with discussion). Journal of the Royal Statistical Society, Series B 34, 187--200
1972
-
[36]
Hastie, T., Tibshirani, R., and Friedman, J. (2001). The Elements of Statistical Learning: Data Mining, Inference, and Prediction. New York: Springer
2001
Reviewed August 16, 2026 · model on record in the stance chip above.
Discussion (0). Continue with ORCID to comment.