REVIEW 5 major objections 4 minor 32 references
Kolmogorov analysis of JWST deep survey galaxies
T0 review · 5 major / 4 minor · reviewed 2026-08-16 · deepseek-v4-flash
Pith's one-line read Using the Kolmogorov stochasticity parameter on 148 JWST galaxy spectra, this paper claims the randomness properties of the peak-wavelength distribution change at z≈2.7 with >99% confidence.
desk verdict A clean application of KSP to JWST spectra, but the claimed z≈2.7 break is unsupported by the statistics as presented. read the letter →
The pith
A machine-rendered reading of the paper's core claim, the machinery that carries it, and where it could break.
The reading
What carries the argument
The machinery is the Kolmogorov stochasticity parameter, defined as λ_n = sqrt(n) sup_x |F_n(x) - F(x)|, where F_n is the empirical cumulative distribution of the sorted sample and F is a theoretical cumulative distribution. Kolmogorov's theorem gives a universal limiting distribution for this statistic that is independent of F, allowing it to serve as an objective measure of comparative randomness. The paper applies it to the normalized wavelength sequence in redshift windows, generates one thousand mock samples from a generalized normal distribution to define the expected value and the 99 percent confidence interval, and uses a moving average with Δz = 0.1 to locate the transition.
What would settle it
Re-run the Kolmogorov analysis on mock spectra that place the same underlying emission line at each observed wavelength with realistic NIRSpec noise; if the z≈2.7 excursion also appears when the input signal has no redshift dependence, the claimed transition is an artifact of noise or calibration.
Extended reading notes
Core claim
The central claim is that the Kolmogorov stochasticity parameter of the rest-frame peak wavelengths, normalized per redshift interval to zero mean and unit variance and compared against a generalized normal distribution, departs from the mock-data expectation in a redshift-dependent way. The departure grows to about 4 sigma and, after moving-average smoothing over a redshift window of 0.1, marks a transition at z≈2.7. The authors interpret this as a change in the relative weight of random and regular sub-signals in the galactic spectra at that redshift, possibly tied to the intergalactic medium or to galaxy evolution. They report the result at over 99 percent confidence.
Load-bearing premise
The result depends on detector noise and calibration systematics being identical across the entire redshift range, so that the only thing changing with redshift is the galaxy signal itself.
Editorial extensions
If this is right
- The spectral peak wavelength distribution of JWST galaxies is not statistically stationary across the redshift range 1.86 to 7.05.
- A change at z≈2.7 means the random-regular mix in the emission lines differs at higher redshift, so galaxy samples above and below that redshift should not be pooled without accounting for the difference.
- If astrophysical in origin, the transition provides a new redshift marker for galaxy or intergalactic-medium evolution that is independent of traditional photometric or color diagnostics.
- The same Kolmogorov analysis can be applied to other emission lines and to other deep surveys to test whether the transition is line-specific or a general spectral property.
Reading between the lines
- A direct test of the interpretation is to compute the same statistic on other rest-frame lines, such as [O III] or H-beta, in the same galaxies; if the z≈2.7 transition reflects changing interstellar-medium conditions, it should also appear in those lines, while a wavelength-dependent instrumental effect would shift or vanish.
- The 148-galaxy sample spans a wide range of signal-to-noise; removing the lowest-quality spectra or requiring secure redshift flags would show whether a few faint objects drive the 4-sigma excursion.
- Because the Kolmogorov statistic is computed from peak wavelengths only, a redshift-dependent mix of galaxy types, such as active galactic nuclei versus star-forming galaxies, could mimic the signal; classifying galaxies independently would distinguish population mixing from a true spectral change.
Signed reviews
Editorial analysis
A structured set of objections, weighed in public.
Referee Report
Summary. This Letter applies the Kolmogorov stochasticity parameter (KSP) to JWST/NIRSpec spectra of 148 galaxies from the UNCOVER survey, selected to have their spectral maximum near rest-frame 656 nm and spanning redshifts 1.86–7.05. For 1000 random redshift intervals each containing 10–20 galaxies, the authors compute the KSP of the normalized wavelength values and compare it with mock data drawn from a generalized normal distribution with unit variance. They report deviations up to 4σ, smooth the KSP sequence with a moving average of Δz = 0.1, and conclude that the spectral properties change at z ≃ 2.7 at over 99% confidence level, which they attribute to possible evolution of galaxies or the intergalactic medium.
Significance. If the claimed break at z ≃ 2.7 were robust, it would point to a genuine redshift-dependent change in the distribution of rest-frame spectral peaks in high-redshift JWST galaxies, with potential implications for galaxy evolution or IGM studies. The paper uses a publicly available dataset and a well-defined statistical quantity, the KSP, and it makes a concrete, falsifiable prediction about where the change occurs. However, the central claim is not supported by the statistical analysis as presented: the significance estimate ignores the strong correlation among overlapping redshift windows, the break redshift is selected post hoc, the null distribution is under-specified, and the crucial assumption of redshift-independent instrumental noise is stated but untested. As a result, the paper currently does not provide convincing evidence for the claimed effect.
major comments (5)
- [Section 4] The shape parameter of the generalized normal distribution is never specified. The text states that a 'generalized normal distribution with variance equal to 1' is used as the theoretical distribution and that there is 'a single free parameter representing the sharpness of the distribution,' but the value of that parameter is not given. Because the mock-data comparison in Figs. 2–4 is the only basis for the reported 99% confidence, the entire null distribution is under-defined and the analysis cannot be reproduced.
- [Section 4, Figs. 2–3] The 1000 redshift intervals are heavily overlapping, with each containing only 10–20 of the 148 galaxies. The KSP values in adjacent intervals are therefore strongly correlated, yet the 99% confidence intervals and the σλ used to compute Δλ/σλ in Fig. 3 are pointwise. A 4σ excursion somewhere in a long, correlated sequence is not a 4σ detection; the paper provides no correction for the effective number of independent intervals or for multiple testing.
- [Section 4, Fig. 4 and Section 5] The transition redshift z ≃ 2.7 is identified only after inspecting the smoothed KSP curve. No change-point test is performed, and no look-elsewhere penalty is applied. The paper's headline statement that the change is at 'over a 99% confidence level' is therefore not supported: the redshift is effectively a free parameter chosen to maximize the deviation, so the quoted confidence is circular.
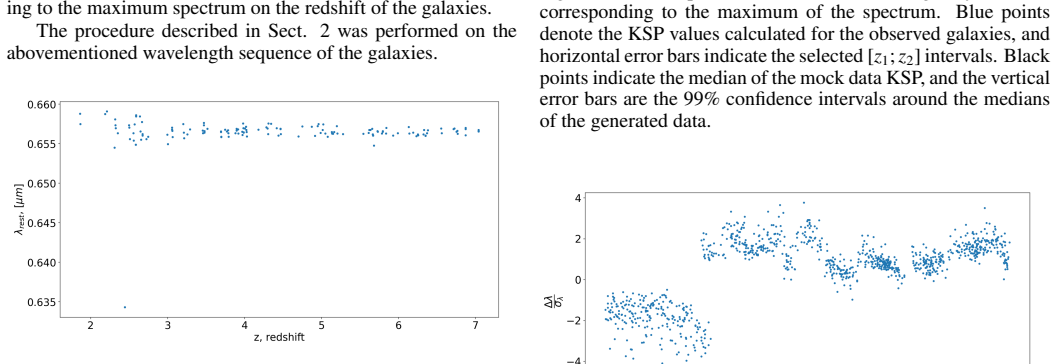
- [Section 5] The conclusion explicitly requires that 'the instrumental noise and certain systematics are identical for the galaxies of the dataset,' but this assumption is not tested. Because the rest-frame 656 nm peak shifts from about 1.9 μm at z = 1.86 to about 5.3 μm at z = 7.05, the observed-frame position moves across substantially different JWST/NIRSpec sensitivity, resolution, and calibration regimes. Redshift-dependent systematics could easily produce a spurious apparent break, and the analysis offers no control, such as splitting the sample by wavelength or comparing against galaxies with different rest-frame lines.
- [Section 4] The normalization of wavelength values to zero mean and unit variance before comparison with a fixed theoretical distribution invalidates the use of the Kolmogorov distribution Φ(λ) in Eq. (2) as the null distribution, because the data are no longer i.i.d. samples from the assumed distribution with known parameters. The paper does not state whether the mock data are normalized in the same way; if they are not, the null is mismatched, and if they are, the effective null distribution differs from the analytical KSP distribution due to the estimation of mean and variance. Either way, the quoted significance levels are not justified.
minor comments (4)
- [Section 4, sentence after Eq. (3)] The text contains a typo: 'di fference' should be 'difference'.
- [Introduction] The reference 'Roberston et al 2023' appears in the text, but the reference list contains 'Robertson B.E., Tacchella S., Johnson B.D. et al, 2022'; the spelling and year should be corrected.
- [Fig. 2 caption] The caption reads 'horizontal error bars indicate the selected [z1; z2] intervals,' but these are the horizontal segments of the blue points; the term 'error bars' is misleading. Clarify the visualization.
- [Abstract and Section 5] The phrase 'at over a 99% confidence level' is not formally defined as a frequentist confidence interval; specify whether this is a pointwise significance level after smoothing, and state the exact test used.
Circularity Check
No formal circularity; the KSP analysis is a self-contained Monte Carlo comparison, though the z≈2.7 break is affected by post hoc selection and overlapping-bin correlations.
full rationale
The paper's central claim is that the Kolmogorov stochasticity parameter (KSP) of rest-frame 656 nm peak wavelengths changes at z≈2.7 at over 99% confidence. The derivation is self-contained: the KSP statistic is defined in Eq. (2) against a chosen theoretical distribution (a generalized normal with variance 1), mock data are generated from that same distribution, and the observed KSP values are compared to the mock distribution. Normalizing the observed wavelengths to zero mean and unit variance does not make the comparison circular, because the empirical cumulative distribution function's shape remains free; the mocks provide a calibrated null for the chosen parametric family. The self-citations to Gurzadyan and Kocharyan (2008) and related papers are historical examples of the method's prior applications, not inputs to the current calculation. No uniqueness theorem is invoked, and no ansatz is smuggled in via citation. The location z≈2.7 is identified post hoc from the smoothed KSP curve, and the 99% confidence intervals are pointwise and do not account for the heavy overlap of the 1000 random redshift intervals or the moving-average smoothing; these are legitimate statistical validity concerns, but they are not circularity in the sense of the result being equivalent to its inputs by construction. The paper itself concedes an untested crucial assumption that 'instrumental noise and certain systematics are identical for the galaxies of the dataset' (Section 5); this is a correctness risk, not a circular step. Therefore no circularity score is warranted.
Assumptions & free parameters
free parameters (3)
- Generalized normal shape parameter =
not stated
- Transition redshift z ~ 2.7 =
~2.7
- Moving average window Delta z = 0.1 =
0.1
assumptions (5)
- standard math Kolmogorov's theorem gives the limit distribution of the KSP for continuous CDFs.
- domain assumption The normalized wavelength values in each redshift interval follow a generalized normal distribution with variance 1.
- domain assumption Instrumental noise and systematics are identical for all galaxies in the sample.
- domain assumption The selected galaxies (peak near 656 nm rest frame) form a homogeneous sample across redshift.
- domain assumption KSP remains an efficient randomness indicator for samples of 10-20 points.
Cite this review
Pith. "Pith review of Kolmogorov analysis of JWST deep survey galaxies." pith.science (2026). https://pith.science/paper/ENB4AWMR
@misc{pith2026250417208,
  author       = {Pith},
  title        = {Pith review of: Kolmogorov analysis of JWST deep survey galaxies},
  year         = {2026},
  howpublished = {\url{https://pith.science/paper/ENB4AWMR}},
  note         = {Machine review of arXiv:2504.17208}
}
read the original abstract
JWST galaxy deep spectral surveys provide a unique opportunity to trace a broad range of evolutionary features of galaxies and the intergalactic medium given the huge distance the photons are propagating. We have analyzed the spectral data of JWST galaxies up to a redshift of around 7 using the Kolmogorov technique, which is an efficient tool for testing the tiny comparative randomness properties of cumulative signals, that is, for distinguishing the contributions of regular and stochastic sub-signals. Our aim is to determine if certain identical spectral features of galaxies have undergone any distortions or systematic evolution across a broad range of redshifts. Our results indicate a change in the spectral properties of the sample galaxies at around z \simeq 2.7 at over a 99% confidence level.
Figures


Reference graph
Works this paper leans on
-
[1]
Arnold V.I., 2008a, Nonlinearity, 21, T109
-
[2]
Arnold V.I., 2008b, Uspekhi Mat.Nauk, 63, 5
-
[3]
Moscow Math
Arnold V.I., 2009a, Trans. Moscow Math. Soc., 70, 31
-
[4]
Arnold V.I., 2009b, Funct. An. Other Math. 2, 139
-
[5]
Atto A.M., Berthoumieu Y., Megret R., 2013, Entropy, 15, 4782
2013
-
[6]
Bezanson R., Labbe I., Whitaker K. E. et al., 2024, ApJ, 974, 92
work page 2024
-
[7]
Cooper R.A., Caputi K.I., Iani E. et al, 2025, arXiv:2502.18310
arXiv 2025
-
[8]
De Paolis F., Gurzadyan V.G., Nucita A.A. et al, 2014, A&A, 565, L3
work page 2014
Show all 32 references
-
[9]
et al, 2025, arXiv:2503.03431
D'Silva J.C.J., Driver S.P., Lagos C.D.P. et al, 2025, arXiv:2503.03431
2025 arXiv
-
[10]
and Kocharyan A.A., 2008, A&A 492, L33
Gurzadyan V.G. and Kocharyan A.A., 2008, A&A 492, L33
2008
-
[11]
et al, 2009, A&A, 497, 343
Gurzadyan V.G., Allahverdyan A.E., Ghahramanyan T. et al, 2009, A&A, 497, 343
2009
-
[12]
Gurzadyan V.G., Kashin A.L., Khachatryan H.G., et al, 2010, EPL, 91, 19001
2010
-
[13]
et al, 2011, EPL, 95, 69001
Gurzadyan V.G., Durret F., Ghahramanyan, T. et al, 2011, EPL, 95, 69001
2011
-
[14]
et al, 2014, A&A 566, A135
Gurzadyan V.G., Kashin A.L., Khachatryan H.G. et al, 2014, A&A 566, A135
2014
-
[15]
Gurzadyan V.G., Stepanian A., 2021, A&A 653, A145
2021
-
[16]
Gurzadyan V.G., Fimin N.N., Chechetkin V.M., 2023, A&A, 677, A161
2023
-
[17]
Gurzadyan V.G., Fimin N.N., Chechetkin V.M., 2025, A&A, 694, A252
2025
-
[18]
et al, 2022, A&A, 661, A80
Jakobsen P., Ferruit P., Alves de Oliveira C. et al, 2022, A&A, 661, A80
2022
-
[19]
Kolmogorov A.N., 1933, G.Ist.Ital.Attuari 4, 83
1933
-
[20]
et al, 2025, arXiv:2503.07774
Liu F.Y., Dunlop J.S., McLure R.J. et al, 2025, arXiv:2503.07774
2025
-
[21]
W., Feinberg L.D., Perrin M.D
McElwain M. W., Feinberg L.D., Perrin M.D. et al. Publ. Astron. Soc. Pac., 2023, 135, 058001
2023
-
[22]
et al, 2025, arXiv:2503.01579
Martis N., Withers S., Felicioni G. et al, 2025, arXiv:2503.01579
2025 arXiv
-
[23]
Mistele T., McGaugh A., Lelli F., et al, 2024, ApJL, 969, L3
2024
-
[24]
et al, 2025, arXiv:2503.15594
Pérez-González P.G., Östlin G., Costantin L. et al, 2025, arXiv:2503.15594
2025
-
[25]
H., Bezanson R., Labbe I., et al
Price S. H., Bezanson R., Labbe I., et al. 2024, arXiv:2408.03920
2024 arXiv
-
[26]
et al, 2022, ApJL, 942, L42
Robertson B.E., Tacchella S., Johnson B.D. et al, 2022, ApJL, 942, L42
2022
-
[27]
et al, 2025, arXiv:2502.19174
Runnholm A., Hayes M.J., Mehta V. et al, 2025, arXiv:2502.19174
2025 arXiv
- [28]
-
[29]
et al, 2015, MNRAS, 450, 11
Szapudi I., Kovacs A., Granett B.G. et al, 2015, MNRAS, 450, 11
2015
-
[30]
et al, 2025, MNRAS, 539, 347
Varnish T.W.O., Wu X., Pearson C. et al, 2025, MNRAS, 539, 347
2025
-
[31]
, " * write output.state after.block = add.period write newline
ENTRY address author booktitle chapter edition editor howpublished institution journal key month note number organization pages publisher school series title type volume year label extra.label sort.label short.list INTEGERS output.state before.all mid.sentence after.sentence a...
-
[32]
write newline
" write newline "" before.all 'output.state := FUNCTION n.dashify 't := "" t empty not t #1 #1 substring "-" = t #1 #2 substring "--" = not "--" * t #2 global.max substring 't := t #1 #1 substring "-" = "-" * t #2 global.max substring 't := while if t #1 #1 substring * t #2 gl...
Reviewed August 16, 2026 · model on record in the stance chip above.
Discussion (0). Continue with ORCID to comment.