REVIEW 3 major objections 5 minor 1 cited by
Spectral Irradiance Variability in Lyman-Alpha Emission During Solar Flares
T0 review · 3 major / 5 minor · reviewed 2026-08-16 · deepseek-v4-flash
Pith's one-line read This paper claims that Lyman-alpha spectral variability during solar flares is primarily driven by nonthermal chromospheric heating, with red-wing excess tracing chromospheric evaporation and blue-wing excess tracing erupting filament…
desk verdict A useful first look at spectrally resolved M-class Ly-alpha flares, but the red/blue asymmetry claims are on shakier ground than the nonthermal timing correlation. read the letter →
The pith
A machine-rendered reading of the paper's core claim, the machinery that carries it, and where it could break.
The reading
What carries the argument
The central object is the Lyα line profile, rastered by SOLSTICE into roughly 67-second spectral scans and divided into bands: whole scan, whole line, line core, near and far red wings, near and far blue wings, and Si iii. The load-bearing comparison is between the timing of enhancement in each band and RHESSI HXR bursts. The physical mechanism invoked is the optically thick line's wavelength-dependent formation: nonthermal heating excites neutral hydrogen and preferentially enhances the wings relative to the core, while chromospheric evaporation produces redshifted emission (red wing excess) and an erupting filament produces blueshifted emission (blue wing excess).
What would settle it
Compare the SOLSTICE wing-band peak times with RHESSI 25–50 keV burst times at sub-raster resolution by simulating a synthetic flare with a known time evolution and scanning it through the 67-second SOLSTICE raster; if the observed red/blue peak delays can be reproduced by scanning alone, the evaporation and filament attributions would not be required. Alternatively, an M-class flare observed with higher-cadence spectral Lyα (for example, 1-second cadence and 0.008 Å resolution) should show red-wing and blue-wing peaks that track HXR bursts at the minute scale; if they do not, the nonthermal origin is falsified.
Extended reading notes
Core claim
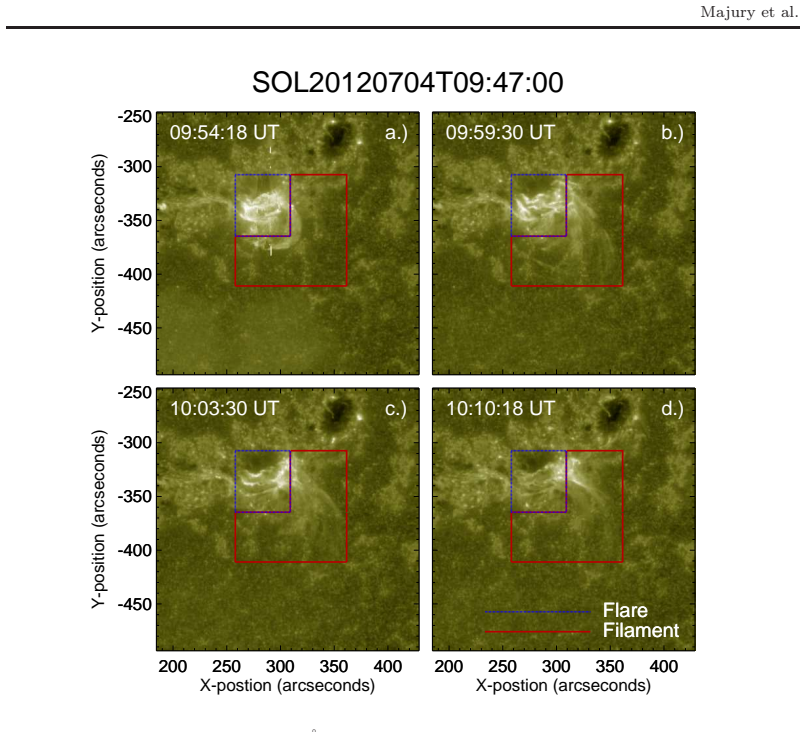
The paper's key finding is that enhancements across the Lyα line profile during two M-class flares (an M8.3 event on 12 February 2010 and an M5.3 event on 4 July 2012) closely match bursts of HXR emission in the 25–50 keV RHESSI channel, indicating that nonthermal electrons depositing energy in the chromosphere drive most of the Lyα brightening. At flare peak, the wings are enhanced more than the line core, and the red wing is enhanced more than the blue wing; the paper attributes the red asymmetry to chromospheric evaporation. In the second flare, the blue wing peaks later and coincides with a bright filament eruption seen in SDO/AIA 1600 Å images, so the blue excess is attributed to blueshifted material from the eruption. A secondary result is that the Si iii line at 1206 Å can carry a large relative enhancement, which may contaminate broadband Lyα measurements that include this line.
Load-bearing premise
The load-bearing premise is that each SOLSTICE raster's median peak time can be compared directly with RHESSI HXR burst times even though the 67-second raster scans different wavelengths at different moments; if intra-raster timing shifts the apparent peak times, the nonthermal attribution weakens.
Editorial extensions
If this is right
- If Lyα enhancements are primarily nonthermal, then Lyα spectral observations can serve as a proxy for flare-accelerated electron energy deposition in the chromosphere, complementing HXR data.
- A red wing excess at flare peak becomes a spectral marker of chromospheric evaporation, while a later blue wing excess becomes a marker of filament material moving toward the observer.
- The strong Si iii enhancement implies that broadband Lyα photometers whose response includes 1206 Å may overstate true Lyα flare excess, so past statistical estimates may need re-interpretation.
- The two flares' similar GOES class yet different wing and Si iii enhancements show that flare class alone does not determine Lyα spectral response; electron beam properties and eruption geometry matter.
Reading between the lines
- An untested corollary is that in stellar flares, where HXR is rarely observable, time-resolved Lyα profile asymmetry could be used to infer the presence and Doppler shift of erupting material and evaporation flows.
- The paper leaves open whether the blue-wing excess is Doppler-shifted filament emission or separate nonthermal heating; a testable extension would compare Lyα blue-wing centroid shifts with simultaneous 1600 Å filament velocities.
- The raster-induced asymmetry noted in the paper could be characterized quantitatively by scanning a synthetic time-varying line profile through the SOLSTICE 67-second pattern; this would put a firm error bar on the reported red/blue asymmetry timings.
- If Si iii contamination is significant, re-analysis of GOES/EUVS-E flare statistics with line-blend corrections would make Lyα flare enhancement estimates more accurate and may reduce the reported discrepancy between SORCE/SOLSTICE and GOES/EUVS-E.
Signed reviews
Editorial analysis
A structured set of objections, weighed in public.
Referee Report
Summary. This paper presents the first multi-instrument study of spectrally resolved Lyman-alpha flare observations from SORCE/SOLSTICE calibration rasters, for an M8.3 flare on 2010 February 12 and an M5.3 flare on 2012 July 4. The authors integrate the SOLSTICE spectra into core, near-wing, far-wing, and Si III bands, compute relative enhancements above pre-flare backgrounds, and compare the timing and amplitude of these enhancements with RHESSI hard X-ray count rates, GOES/EUVS-E broadband Ly-alpha photometry, GOES/XRS soft X-ray fluxes, and SDO/AIA 1600 Å imaging. They report that Ly-alpha enhancements across the profile are temporally correlated with HXR bursts, that red-wing asymmetries at the flare peaks indicate chromospheric evaporation, and that blue-wing enhancements in the 2012 flare may be associated with an erupting filament. The paper explicitly acknowledges the small sample size, the rastering nature of SOLSTICE, and the large irradiance uncertainties as limitations.
Significance. If the central interpretation holds, this is a valuable use of newly released SOLSTICE calibration scans and one of the few spectrally resolved Ly-alpha flare datasets with simultaneous hard X-ray coverage. The cross-instrument validation against GOES/EUVS-E, the use of publicly available calibrated data, and the independence of the X-ray and UV measurements are genuine strengths; no modeled quantity is fitted to the data, and the nonthermal correlation is supported by several independent datasets. The proposed diagnostics (red-wing excess for chromospheric evaporation, blue-wing excess for erupting filaments) are interesting and falsifiable with future EUVST/SNIFS data. However, the spectral asymmetry claims currently rest on measurements taken at different times within a 67 s raster, and several of the quoted asymmetry differences are not statistically significant when the uncertainties are combined properly. The paper is therefore a useful observational contribution whose main spectral conclusion needs additional quantitative support before it can be accepted.
major comments (3)
- [§2.1, §3.1, Tables 2–3] The asymmetry metric in Tables 2 and 3 compares each wing band's peak enhancement at its own median scan time rather than at a common time. SOLSTICE scans from red to blue within a 67 s raster: in SOL2010 the Far Red band peaked at 11:25:38 UT and the Far Blue at 11:26:11 UT, while RHESSI 25–50 keV peaked at 11:25:32 UT and GOES/EUVS-E at 11:25:45 UT. If the Ly-alpha enhancement was already decaying after the HXR peak, the earlier-scanned red points would appear systematically brighter than the later blue points by roughly the decay over the 33 s separation, and the observed Far Red/Far Blue difference of 6.1 percentage points is of the order that such a decay could produce. Section 2.1 acknowledges that 'rastering may introduce instrumentally driven asymmetries' and Section 4 lists rastering as a limitation, but no quantitative bound or correction is provided before the asymmetry is attributed to chromospheric evaporation. Please provide a quantitative assessment, for example using the GOES/EUVS-E 10 s light curve or the SOLSTICE Whole Scan time series to estimate the expected intra-raster decay, or restrict the evaporation claim to measurements taken within the same time interval.
- [§3.1, Table 2] The claim that the Far Red/Far Blue asymmetry of SOL2010 'slightly exceed[s] uncertainty' is not supported by the quoted 1σ errors: combining the two independent errors in quadrature gives sqrt(4.9^2+5.0^2) = 7.0 percentage points, which is larger than the 6.1 percentage point difference. The Near Wing asymmetry (2.5 points with errors of 3.8 and 4.0) and the SOL2012 asymmetries also fall within the combined 1σ uncertainties. Since these asymmetries are the evidence for chromospheric evaporation, the difference should be reported with its combined uncertainty and, where possible, a paired test that accounts for the same-raster temporal structure; as presented, the red-wing asymmetry is not statistically significant.
- [§3.1–3.2, Tables 2–3] The temporal association between SOLSTICE band peaks and RHESSI HXR bursts is described as good agreement and alignment, but each SOLSTICE band is a 67 s raster whose median time carries a ±33 s ambiguity. In SOL2012, for example, the Far Blue Wing median time of 09:54:54 UT is within ±33 s of both the third HXR burst (09:54:16 UT) and the fourth (09:54:52 UT), so the claimed one-to-one assignment to the fourth burst is not uniquely determined. Please propagate the raster integration time into the timing comparisons, or soften the one-to-one language; this is needed for the nonthermal attribution to be load-bearing.
minor comments (5)
- [Figure 5 caption] The caption contains a typo: 'X-postion' should be 'X-position'.
- [§2.5, Figure 1 caption] Figure 1 labels the 1600 Å image as 'uncorrected SDO/AIA 1600 Å' while Section 2.5 states that degradation correction is applied to the 1600 Å light curves; please make this distinction consistent and explicit.
- [Tables 2–3] Several band enhancements are not individually significant at 1σ (for example, the SOL2010 Line Core enhancement of 2.9 ± 3.2%); please state this explicitly in the text or in the figure rather than only in the asymmetry discussion.
- [§2.1] The phrase 'effective raster cadence of ~1 minute' is slightly misleading because a complete 64-point raster takes about 67 s and consecutive rasters are roughly an orbit apart; clarify the cadence terminology.
- [§3.1] The possible O V 1218.34 Å blend contribution to the Near Red Wing asymmetry is mentioned but not quantified; please state whether this contribution is expected to be negligible or flag it as an unquantified caveat.
Circularity Check
No significant circularity: the central Ly-alpha/HXR correlations are comparisons of independent measurements, with no fitted parameter or definitional reduction.
full rationale
The paper's derivation chain is observational rather than model-based: SOLSTICE spectral bands, GOES/EUVS-E photometry, RHESSI hard X-ray count rates, and SDO/AIA 1600 A imaging are independent data sets, and the claimed correlations between Ly-alpha enhancements and HXR bursts are empirical coincidences in time, not quantities defined in terms of one another. No parameter is fitted to a subset of the data and then renamed as a prediction; no equation reduces to an input by construction. Self-citations to Milligan and Chamberlin (2016), Milligan et al. (2020), Milligan (2021), and Greatorex, Milligan, and Chamberlin (2023) supply statistical and instrumental context, but the key timing comparisons rest on RHESSI and GOES/EUVS-E data obtained independently of those papers, so the self-citations are not load-bearing. The acknowledged concern that SOLSTICE rastering introduces non-simultaneity between red- and blue-wing measurements (Section 2.1: 'rastering may introduce instrumentally driven asymmetries') is a genuine data-quality limitation that may weaken the physical attribution of wing asymmetries, but it is a measurement artifact concern, not circular reasoning: the red/blue asymmetry values are not constructed from the physical conclusion they are used to support. The paper also explicitly flags its small sample and modest spectral resolution in Section 4. Accordingly, no circular step satisfying the required standard is present, and the score is 0.
Assumptions & free parameters
free parameters (2)
- Band boundaries for line profile integration =
See Table 1; includes Whole Scan 1203 to 1227 angstroms and wing/core bands derived from those data points.
- Background reference measurements =
11:14:40 to 11:18:09 UT for flare 1; first raster at 09:47:18 UT for flare 2.
assumptions (5)
- domain assumption SORCE/SOLSTICE v18 level-3 wavelength calibration scans are flux-calibrated and adequate for relative flare enhancement measurements.
- domain assumption GOES/EUVS-E broadband photometry provides a valid Lyman-alpha reference after scaling to SOLSTICE and degradation correction.
- domain assumption RHESSI 25 to 50 keV and other hard X-ray channels trace flare-accelerated nonthermal electrons.
- domain assumption SDO/AIA 1600 angstrom and STEREO 304 angstrom images can be used as spatial proxies for chromospheric and filament Lyman-alpha emission.
- domain assumption Comparing a roughly 67 second SOLSTICE raster to 4 second RHESSI data with median raster times preserves the relevant temporal association.
Cite this review
Pith. "Pith review of Spectral Irradiance Variability in Lyman-Alpha Emission During Solar Flares." pith.science (2026). https://pith.science/paper/5L2QEKB6
@misc{pith2026250417667,
  author       = {Pith},
  title        = {Pith review of: Spectral Irradiance Variability in Lyman-Alpha Emission During Solar Flares},
  year         = {2026},
  howpublished = {\url{https://pith.science/paper/5L2QEKB6}},
  note         = {Machine review of arXiv:2504.17667}
}
read the original abstract
The Lyman-alpha (Ly{\alpha};1216 {\AA}) line is the brightest emission line in the quiescent solar spectrum and radiates a significant fraction of the available nonthermal energy during flares. Despite its importance, there is a lack of detailed studies of Ly{\alpha} spectral variability during flares. Recently, spectrally resolved Ly{\alpha} flare observations from the SORCE/SOLSTICE instrument have become available. This study examines Ly{\alpha} spectral variability and its relationship with HXR emission from nonthermal electrons, using observations of two M-class flares from SORCE/SOLSTICE and RHESSI. Imaging observations from STEREO/SECCHI EUVI and SDO/AIA provide further context. Enhancements across the Ly{\alpha} line profile were found to closely correlate with bursts of HXR emission, suggesting a primarily nonthermal origin. Red enhancement asymmetries at the peak of each flare were attributed to chromospheric evaporation, while blue wing enhancement and blue asymmetry were linked to a bright filament-eruption seen in SDO/AIA 1600 {\AA} images. These findings contribute to the understanding of spectral Ly{\alpha} variability during flares and highlight the need for future studies using a higher quality and quantity of spectral Ly{\alpha} flare observations. Such studies will further characterise the physical mechanisms driving Ly{\alpha} flare variability.
Figures


Figures from the paper (3 more)


Forward citations
Cited by 1 Pith paper
-
Observations of Flare Induced Doppler Shifts in the Si~\textsc{iii} $1206\,\textrm{{\AA}}$ line
A first analysis of flare-induced Doppler shifts in the Si III 1206 Å line reports a 201 km/s redshift and a 40 km/s blueshift, with the blueshift possibly tied to a filament eruption.
Reference graph
Works this paper leans on
-
[1]
barticle Auch \`e re , F. : 2005 , Effect of the H I Ly Chromospheric Flux Anisotropy on the Total Intensity of the Resonantly Scattered Coronal Radiation . 622 , 737 . https://doi.org/10.1086/427903 . 2005ApJ...622..737A . barticle
doi:10.1086/427903 2005
-
[2]
barticle Bartoe , J.-D.F. , Brueckner , G.E. , Purcell , J.D. , Tousey , R. : 1977 , Extreme ultraviolet spectrograph ATM experiment S082B. Applied Optics 16 , 879 . https://doi.org/10.1364/AO.16.000879 . 1977ApOpt..16..879B . barticle
-
[3]
barticle Bonnet , R.M. , Lemaire , P. , Vial , J.C. , Artzner , G. , Gouttebroze , P. , Jouchoux , A. , Leibacher , J.W. , Skumanich , A. , Vidal-Madjar , A. : 1978 , The LPSP instrument on OSO 8. II. In-flight performance and preliminary results. 221 , 1032 . https://doi.org/10.1086/156109 . 1978ApJ...221.1032B . barticle
-
[4]
barticle Brekke , P. , Rottman , G.J. , Fontenla , J. , Judge , P.G. : 1996 , The Ultraviolet Spectrum of a 3B Class Flare Observed with SOLSTICE . 468 , 418 . https://doi.org/10.1086/177701 . 1996ApJ...468..418B . barticle
-
[5]
barticle Brown , J.C. : 1971 , The Deduction of Energy Spectra of Non-Thermal Electrons in Flares from the Observed Dynamic Spectra of Hard X-Ray Bursts . 18 , 489 . https://doi.org/10.1007/BF00149070 . 1971SoPh...18..489B . barticle
-
[6]
barticle Brown , S.A. , Fletcher , L. , Labrosse , N. : 2016 , Doppler speeds of the hydrogen Lyman lines in solar flares from EVE . 596 , A51 . https://doi.org/10.1051/0004-6361/201628390 . 2016A&A...596A..51B . barticle
-
[7]
barticle Brown , S.A. , Fletcher , L. , Kerr , G.S. , Labrosse , N. , Kowalski , A.F. , De La Cruz Rodr \' guez , J. : 2018 , Modeling of the Hydrogen Lyman Lines in Solar Flares . 862 , 59 . https://doi.org/10.3847/1538-4357/aacc29 . 2018ApJ...862...59B . barticle
-
[8]
barticle Canfield , R.C. , Cook , J.W. : 1978 , ATM evidence for a nonthermal proton/electron energy flux ratio in solar flares. 225 , 650 . https://doi.org/10.1086/156525 . 1978ApJ...225..650C . barticle
Show all 62 references
-
[9]
, van Hoosier , M.E
barticle Canfield , R.C. , van Hoosier , M.E. : 1980 , Observed L profiles for two solar flares: 14 : 12 UT 15 June, 1973 and 23 : 16 UT 21 January, 1974 . 67 , 339 . https://doi.org/10.1007/BF00149811 . 1980SoPh...67..339C . barticle
1980 doi
-
[10]
, Landi , E
barticle Dere , K.P. , Landi , E. , Mason , H.E. , Monsignori Fossi , B.C. , Young , P.R. : 1997 , CHIANTI - an atomic database for emission lines . 125 , 149 . https://doi.org/10.1051/aas:1997368 . 1997A&AS..125..149D . barticle
1997 doi
-
[11]
, Hochedez , J.-F
barticle Dominique , M. , Hochedez , J.-F. , Schmutz , W. , Dammasch , I.E. , Shapiro , A.I. , Kretzschmar , M. , Zhukov , A.N. , Gillotay , D. , Stockman , Y. , BenMoussa , A. : 2013 , The LYRA Instrument Onboard PROBA2: Description and In-Flight Performance . 286 , 21 . http...
2013 doi
-
[12]
, Del Zanna , G
barticle Dufresne , R.P. , Del Zanna , G. , Young , P.R. , Dere , K.P. , Deliporanidou , E. , Barnes , W.T. , Landi , E. : 2024 , CHIANTI An Atomic Database for Emission Lines Paper. XVIII. Version 11, Advanced Ionization Equilibrium Models: Density and Charge Transfer Effects...
2024 doi
-
[13]
, Crotser , D
bchapter Eparvier , F.G. , Crotser , D. , Jones , A.R. , McClintock , W.E. , Snow , M. , Woods , T.N. : 2009 , The Extreme Ultraviolet Sensor (EUVS) for GOES-R . In: Fineschi , S. , Fennelly , J.A. (eds.) Solar Physics and Space Weather Instrumentation III , Society of Photo-O...
2009 doi
-
[14]
, Avrett , E.H
barticle Fontenla , J.M. , Avrett , E.H. , Loeser , R. : 1991 , Energy Balance in the Solar Transition Region. II. Effects of Pressure and Energy Input on Hydrostatic Models . 377 , 712 . https://doi.org/10.1086/170399 . 1991ApJ...377..712F . barticle
1991 doi
-
[15]
, Zhu , C
barticle Gan , W.-Q. , Zhu , C. , Deng , Y.-Y. , Li , H. , Su , Y. , Zhang , H.-Y. , Chen , B. , Zhang , Z. , Wu , J. , Deng , L. , Huang , Y. , Yang , J.-F. , Cui , J.-J. , Chang , J. , Wang , C. , Wu , J. , Yin , Z.-S. , Chen , W. , Fang , C. , Yan , Y.-H. , Lin , J. , Xiong...
2019
-
[16]
, Auch \`e re , F
barticle Gordino , M. , Auch \`e re , F. , Vial , J.-C. , Bocchialini , K. , Hassler , D.M. , Bando , T. , Ishikawa , R. , Kano , R. , Kobayashi , K. , Narukage , N. , Trujillo Bueno , J. , Winebarger , A. : 2022 , Empirical relations between the intensities of Lyman lines of ...
2022 doi
-
[17]
, Milligan , R.O
barticle Greatorex , H.J. , Milligan , R.O. , Chamberlin , P.C. : 2023 , Observational Analysis of Ly Emission in Equivalent-magnitude Solar Flares . 954 , 120 . https://doi.org/10.3847/1538-4357/acea7f . 2023ApJ...954..120G . barticle
2023 doi
-
[18]
, Milligan , R.O
botherref Greatorex , H.J. , Milligan , R.O. , Dammasch , I.E. : 2024, On the Instrumental Discrepancies in Lyman-alpha Observations of Solar Flares . arXiv e-prints, arXiv:2411.00736. 2024arXiv241100736G . botherref
2024 arXiv
-
[19]
, Tarbell , T.D
barticle Handy , B.N. , Tarbell , T.D. , Wolfson , C.J. , Korendyke , C.M. , Vourlidas , A. : 1999 , Calibrated H I Lyman Observations with TRACE . 190 , 351 . https://doi.org/10.1023/A:1005257618422 . 1999SoPh..190..351H . barticle
1999 doi
-
[20]
, Vidotto , A.A
barticle Hazra , G. , Vidotto , A.A. , Carolan , S. , Villarreal D'Angelo , C. , Manchester , W. : 2022 , The impact of coronal mass ejections and flares on the atmosphere of the hot Jupiter HD189733b . 509 , 5858 . https://doi.org/10.1093/mnras/stab3271 . 2022MNRAS.509.5858H ...
2022 doi
-
[21]
, Li , Y
barticle Hong , J. , Li , Y. , Ding , M.D. , Carlsson , M. : 2019 , The Response of the Ly Line in Different Flare Heating Models . 879 , 128 . https://doi.org/10.3847/1538-4357/ab262e . 2019ApJ...879..128H . barticle
2019 doi
-
[22]
, Moses , J.D
barticle Howard , R.A. , Moses , J.D. , Vourlidas , A. , Newmark , J.S. , Socker , D.G. , Plunkett , S.P. , Korendyke , C.M. , Cook , J.W. , Hurley , A. , Davila , J.M. , Thompson , W.T. , St Cyr , O.C. , Mentzell , E. , Mehalick , K. , Lemen , J.R. , Wuelser , J.P. , Duncan ,...
2008
-
[23]
, Kucera , T.A
barticle Kaiser , M.L. , Kucera , T.A. , Davila , J.M. , St. Cyr , O.C. , Guhathakurta , M. , Christian , E. : 2008 , The STEREO Mission: An Introduction . 136 , 5 . https://doi.org/10.1007/s11214-007-9277-0 . 2008SSRv..136....5K . barticle
2008 doi
-
[24]
, Lynch , B.J
barticle Kazachenko , M.D. , Lynch , B.J. , Welsch , B.T. , Sun , X. : 2017 , A Database of Flare Ribbon Properties from the Solar Dynamics Observatory. I. Reconnection Flux . 845 , 49 . https://doi.org/10.3847/1538-4357/aa7ed6 . 2017ApJ...845...49K . barticle
2017 doi
-
[25]
, Allred , J.C
barticle Kerr , G.S. , Allred , J.C. , Kowalski , A.F. , Milligan , R.O. , Hudson , H.S. , Zambrana Prado , N. , Kucera , T.A. , Brosius , J.W. : 2023 , Prospects of Detecting Nonthermal Protons in Solar Flares via Lyman Line Spectroscopy: Revisiting the Orrall-Zirker Effect ....
2023 doi
-
[26]
, Brown , J.C
barticle Kontar , E.P. , Brown , J.C. , Emslie , A.G. , Hajdas , W. , Holman , G.D. , Hurford , G.J. , Ka s parov \'a , J. , Mallik , P.C.V. , Massone , A.M. , McConnell , M.L. , Piana , M. , Prato , M. , Schmahl , E.J. , Suarez-Garcia , E. : 2011 , Deducing Electron Propertie...
2011 doi
-
[27]
o gl , S. , Gr \
barticle Krucker , S. , Hurford , G.J. , Grimm , O. , K \"o gl , S. , Gr \"o belbauer , H.-P. , Etesi , L. , Casadei , D. , Csillaghy , A. , Benz , A.O. , Arnold , N.G. , Molendini , F. , Orleanski , P. , Schori , D. , Xiao , H. , Kuhar , M. , Hochmuth , N. , Felix , S. , Schr...
2020
-
[28]
, Takakura , T
barticle Kurokawa , H. , Takakura , T. , Ohki , K. : 1988 , Close relationship between H-alpha and hard X-ray emissions at the impulsive phase of a solar flare . 40 , 357 . 1988PASJ...40..357K . barticle
1988
-
[29]
, Bourrier , V
barticle Lecavelier des Etangs , A. , Bourrier , V. , Wheatley , P.J. , Dupuy , H. , Ehrenreich , D. , Vidal-Madjar , A. , H \'e brard , G. , Ballester , G.E. , D \'e sert , J.-M. , Ferlet , R. , Sing , D.K. : 2012 , Temporal variations in the evaporating atmosphere of the exo...
2012 doi
-
[30]
, Choucq-Bruston , M
barticle Lemaire , P. , Choucq-Bruston , M. , Vial , J.-C. : 1984 , Simultaneous H and K Ca ii, h and k Mg ii, L and L H i profiles of the April 15, 1978 solar flare observed with the OSO-8/L.P.S.P. experiment . 90 , 63 . https://doi.org/10.1007/BF00153785 . 1984SoPh...90...63...
1984 doi
-
[31]
, Title , A.M
barticle Lemen , J.R. , Title , A.M. , Akin , D.J. , Boerner , P.F. , Chou , C. , Drake , J.F. , Duncan , D.W. , Edwards , C.G. , Friedlaender , F.M. , Heyman , G.F. , Hurlburt , N.E. , Katz , N.L. , Kushner , G.D. , Levay , M. , Lindgren , R.W. , Mathur , D.P. , McFeaters , E...
2012
-
[32]
, Chen , B
barticle Li , H. , Chen , B. , Feng , L. , Li , Y. , Huang , Y. , Li , J.-W. , Lu , L. , Xue , J.-C. , Ying , B.-L. , Zhao , J. , Yang , Y.-T. , Gan , W.-Q. , Fang , C. , Song , K.-F. , Wang , H. , Guo , Q.-F. , He , L.-P. , Zhu , B. , Zhu , C. , Deng , L. , Bao , H.-C. , Cao ...
2019 doi
-
[33]
, Li , Q
barticle Li , Y. , Li , Q. , Song , D.-C. , Battaglia , A.F. , Xiao , H. , Krucker , S. , Sch \"u hle , U. , Li , H. , Gan , W. , Ding , M.D. : 2022 , The Ly Emission in a C1.4 Solar Flare Observed by the Extreme Ultraviolet Imager aboard Solar Orbiter . 936 , 142 . https://do...
2022 doi
-
[34]
, Dennis , B.R
barticle Lin , R.P. , Dennis , B.R. , Hurford , G.J. , Smith , D.M. , Zehnder , A. , Harvey , P.R. , Curtis , D.W. , Pankow , D. , Turin , P. , Bester , M. , Csillaghy , A. , Lewis , M. , Madden , N. , van Beek , H.F. , Appleby , M. , Raudorf , T. , McTiernan , J. , Ramaty , R...
2002
-
[35]
, Tian , H
barticle Lu , H.-p. , Tian , H. , Chen , H.-c. , Xu , Y. , Hou , Z.-y. , Bai , X.-y. , Tan , G.-y. , Yang , Z.-h. , Ren , J. : 2023 , Full Velocities and Propagation Directions of Coronal Mass Ejections Inferred from Simultaneous Full-disk Imaging and Sun-as-a-star Spectroscop...
2023 doi
-
[36]
, Viereck , R
botherref Machol , J. , Viereck , R. , Jones , A. : 2014, GOES NOP EUV Data, v2 . Technical report, National Oceanic and Atmospheric Association. https://www.ngdc.noaa.gov/stp/GOES/doc/GOES_NOP_EUV_v2.pdf. botherref
2014
-
[37]
, Rottman , G.J
barticle Mcclintock , W.E. , Rottman , G.J. , Woods , T.N. : 2005 , Solar-Stellar Irradiance Comparison Experiment II (Solstice II): Instrument Concept and Design . 230 , 225 . https://doi.org/10.1007/s11207-005-7432-x . 2005SoPh..230..225M . barticle
2005 doi
-
[38]
: 2021 , Solar Irradiance Variability Due to Solar Flares Observed in Lyman-Alpha Emission
barticle Milligan , R.O. : 2021 , Solar Irradiance Variability Due to Solar Flares Observed in Lyman-Alpha Emission . 296 , 51 . https://doi.org/10.1007/s11207-021-01796-3 . 2021SoPh..296...51M . barticle
2021 doi
-
[39]
, Chamberlin , P.C
barticle Milligan , R.O. , Chamberlin , P.C. : 2016 , Anomalous temporal behaviour of broadband Ly observations during solar flares from SDO/EVE . 587 , A123 . https://doi.org/10.1051/0004-6361/201526682 . 2016A&A...587A.123M . barticle
2016 doi
-
[40]
, Hudson , H.S
barticle Milligan , R.O. , Hudson , H.S. , Chamberlin , P.C. , Hannah , I.G. , Hayes , L.A. : 2020 , Lyman-alpha Variability During Solar Flares Over Solar Cycle 24 Using GOES-15/EUVS-E . Space Weather 18 , e02331 . https://doi.org/10.1029/2019SW002331 . 2020SpWea..1802331M . barticle
2020 doi
-
[41]
barticle M \"u ller , D. , St. Cyr , O.C. , Zouganelis , I. , Gilbert , H.R. , Marsden , R. , Nieves-Chinchilla , T. , Antonucci , E. , Auch \`e re , F. , Berghmans , D. , Horbury , T.S. , Howard , R.A. , Krucker , S. , Maksimovic , M. , Owen , C.J. , Rochus , P. , Rodriguez-P...
2020
-
[42]
: 1968 , Comparison of Solar X-Ray Line Emission with Microwave Emission during Flares
barticle Neupert , W.M. : 1968 , Comparison of Solar X-Ray Line Emission with Microwave Emission during Flares . 153 , L59 . https://doi.org/10.1086/180220 . 1968ApJ...153L..59N . barticle
1968 doi
-
[43]
, Asai , A
barticle Otsu , T. , Asai , A. : 2024 , Multiwavelength Sun-as-a-star Analysis of the M8.7 Flare on 2022 October 2 Using H and EUV Spectra Taken by SMART/SDDI and SDO/EVE . 964 , 75 . https://doi.org/10.3847/1538-4357/ad24ec . 2024ApJ...964...75O . barticle
2024 doi
-
[44]
, Thompson , B.J
barticle Pesnell , W.D. , Thompson , B.J. , Chamberlin , P.C. : 2012 , The Solar Dynamics Observatory (SDO) . 275 , 3 . https://doi.org/10.1007/s11207-011-9841-3 . 2012SoPh..275....3P . barticle
2012 doi
-
[45]
, Rudawy , P
barticle Radziszewski , K. , Rudawy , P. , Phillips , K.J.H. : 2011 , High time resolution observations of solar H flares. II. Search for signatures of electron beam heating . 535 , A123 . https://doi.org/10.1051/0004-6361/200911924 . 2011A&A...535A.123R . barticle
2011 doi
-
[46]
u chel , V. , Buchlin , E. , B \
barticle Rochus , P. , Auch \`e re , F. , Berghmans , D. , Harra , L. , Schmutz , W. , Sch \"u hle , U. , Addison , P. , Appourchaux , T. , Aznar Cuadrado , R. , Baker , D. , Barbay , J. , Bates , D. , BenMoussa , A. , Bergmann , M. , Beurthe , C. , Borgo , B. , Bonte , K. , B...
2020
-
[47]
: 2005 , The SORCE Mission
barticle Rottman , G. : 2005 , The SORCE Mission . 230 , 7 . https://doi.org/10.1007/s11207-005-8112-6 . 2005SoPh..230....7R . barticle
2005 doi
-
[48]
, Woods , T.N
barticle Rottman , G.J. , Woods , T.N. , Sparn , T.P. : 1993 , Solar-Stellar Irradiance Comparison Experiment 1. I - Instrument design and operation . 98 , 10,667 . https://doi.org/10.1029/93JD00462 . 1993JGR....9810667R . barticle
1993 doi
-
[49]
: 1983 , H I Lyman-alpha in the sun - The effects of partial redistribution in the line wings
barticle Roussel-Dupre , D. : 1983 , H I Lyman-alpha in the sun - The effects of partial redistribution in the line wings . 272 , 723 . https://doi.org/10.1086/161335 . 1983ApJ...272..723R . barticle
1983 doi
-
[50]
, Fletcher , L
barticle Rubio da Costa , F. , Fletcher , L. , Labrosse , N. , Zuccarello , F. : 2009 , Observations of a solar flare and filament eruption in Lyman and X-rays . 507 , 1005 . https://doi.org/10.1051/0004-6361/200912651 . 2009A&A...507.1005R . barticle
2009 doi
-
[51]
, Imada , S
bchapter Shimizu , T. , Imada , S. , Kawate , T. , Ichimoto , K. , Suematsu , Y. , Hara , H. , Katsukawa , Y. , Kubo , M. , Toriumi , S. , Watanabe , T. , Yokoyama , T. , Korendyke , C.M. , Warren , H.P. , Tarbell , T. , De Pontieu , B. , Teriaca , L. , Sch \"u hle , U.H. , So...
2019
-
[52]
, Reid , H.A.S
barticle Sim \ o es , P.J.A. , Reid , H.A.S. , Milligan , R.O. , Fletcher , L. : 2019 , The Spectral Content of SDO/AIA 1600 and 1700 A Filters from Flare and Plage Observations . 870 , 114 . https://doi.org/10.3847/1538-4357/aaf28d . 2019ApJ...870..114S . barticle
2019 doi
-
[53]
, McClintock , W.E
barticle Snow , M. , McClintock , W.E. , Woods , T.N. , Elliott , J.P. : 2022 , SOLar-STellar Irradiance Comparison Experiment II (SOLSTICE II): End-of-Mission Validation of the SOLSTICE Technique . 297 , 55 . https://doi.org/10.1007/s11207-022-01984-9 . 2022SoPh..297...55S . barticle
2022 doi
-
[54]
, Avrett , E.H
barticle Vernazza , J.E. , Avrett , E.H. , Loeser , R. : 1973 , Structure of the Solar Chromosphere. Basic Computations and Summary of the Results . 184 , 605 . https://doi.org/10.1086/152353 . 1973ApJ...184..605V . barticle
1973 doi
-
[55]
, Avrett , E.H
barticle Vernazza , J.E. , Avrett , E.H. , Loeser , R. : 1981 , Structure of the solar chromosphere. III. Models of the EUV brightness components of the quiet sun. 45 , 635 . https://doi.org/10.1086/190731 . 1981ApJS...45..635V . barticle
1981 doi
-
[56]
: 2014 , The Solar-C Mission
bchapter Watanabe , T. : 2014 , The Solar-C Mission . In: Oschmann , J. Jacobus M. , Clampin , M. , Fazio , G.G. , MacEwen , H.A. (eds.) Space Telescopes and Instrumentation 2014: Optical, Infrared, and Millimeter Wave , Society of Photo-Optical Instrumentation Engineers (SPIE...
2014 doi
-
[57]
, Dominique , M
barticle Wauters , L. , Dominique , M. , Milligan , R. , Dammasch , I.E. , Kretzschmar , M. , Machol , J. : 2022 , Observation of a Flare and Filament Eruption in Lyman- on 8 September 2011 by the PRoject for OnBoard Autonomy/Large Yield Radiometer (PROBA2/LYRA) . 297 , 36 . h...
2022 doi
-
[58]
, Eparvier , F.G
barticle Woods , T.N. , Eparvier , F.G. , Fontenla , J. , Harder , J. , Kopp , G. , McClintock , W.E. , Rottman , G. , Smiley , B. , Snow , M. : 2004 , Solar irradiance variability during the October 2003 solar storm period . 31 , L10802 . https://doi.org/10.1029/2004GL019571 ...
2004 doi
-
[59]
, Eparvier , F.G
barticle Woods , T.N. , Eparvier , F.G. , Hock , R. , Jones , A.R. , Woodraska , D. , Judge , D. , Didkovsky , L. , Lean , J. , Mariska , J. , Warren , H. , McMullin , D. , Chamberlin , P. , Berthiaume , G. , Bailey , S. , Fuller-Rowell , T. , Sojka , J. , Tobiska , W.K. , Vie...
2012
-
[60]
, Lemen , J.R
bchapter Wuelser , J.-P. , Lemen , J.R. , Tarbell , T.D. , Wolfson , C.J. , Cannon , J.C. , Carpenter , B.A. , Duncan , D.W. , Gradwohl , G.S. , Meyer , S.B. , Moore , A.S. , Navarro , R.L. , Pearson , J.D. , Rossi , G.R. , Springer , L.A. , Howard , R.A. , Moses , J.D. , Newm...
2004
-
[61]
, Tian , H
barticle Xu , Y. , Tian , H. , Hou , Z. , Yang , Z. , Gao , Y. , Bai , X. : 2022 , Sun-as-a-star Spectroscopic Observations of the Line-of-sight Velocity of a Solar Eruption on 2021 October 28 . 931 , 76 . https://doi.org/10.3847/1538-4357/ac69d5 . 2022ApJ...931...76X . barticle
2022 doi
-
[62]
, Chen , D.-Y
barticle Zhang , Z. , Chen , D.-Y. , Wu , J. , Chang , J. , Hu , Y.-M. , Su , Y. , Zhang , Y. , Wang , J.-P. , Liang , Y.-M. , Ma , T. , Guo , J.-H. , Cai , M.-S. , Zhang , Y.-Q. , Huang , Y.-Y. , Peng , X.-Y. , Tang , Z.-B. , Zhao , X. , Zhou , H.-H. , Wang , L.-G. , Song , J...
2019
Reviewed August 16, 2026 · model on record in the stance chip above.
Discussion (0). Continue with ORCID to comment.