Interplay between pitch control and top speed in soccer: The stamina factor
Pith reviewed 2026-05-22 19:04 UTC · model grok-4.3
The pith
A soccer pitch control model using each player's measured top speed reveals positive but position-constrained correlations with accumulated control.
A machine-rendered reading of the paper's core claim, the machinery that carries it, and where it could break.
Core claim
The central claim is that incorporating player-specific top speeds measured during matches into a pitch control probability model produces higher control estimates for faster players, but the correlation is constrained by position, with defenders leading overall. Adjusting speeds via a stamina factor changes control according to a logarithmic relation whose magnitude varies by role, enabling direct what-if calculations for individual speed gains and team-level advantages.
What carries the argument
A pitch control probability algorithm that assigns each player a distinct top speed drawn from match data and modulates it with a stamina factor to quantify speed adjustments.
If this is right
- Defenders achieve the highest accumulated pitch control despite not being the fastest players.
- The impact of the stamina factor on pitch control follows a logarithmic function.
- The influence of the stamina factor varies significantly by player position.
- Team-level analysis can identify which teams gain the greatest advantage from their players' top speeds.
- Pitch control differences can be compared between the first and second halves of matches.
Where Pith is reading between the lines
- Coaches might prioritize speed training for positions where the logarithmic stamina gain is largest.
- The framework could be used to model how fatigue-driven speed loss shifts control over a full match.
- Analogous individual-speed adjustments might improve spatial-control models in other team invasion sports.
Load-bearing premise
Top speeds measured from match performance data can be accurately determined and inserted directly into the pitch control model without additional validation or adjustments.
What would settle it
Recalculating the correlations after replacing match-derived top speeds with independently timed sprint-test values for the same players and finding that the positive link with accumulated control disappears or reverses for multiple positions.
Figures




read the original abstract
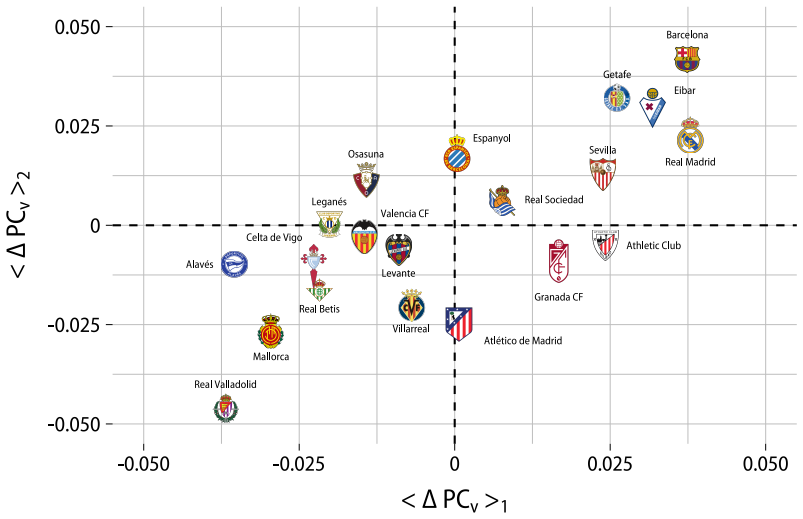
In this study, we investigate the interplay between player speed and ball control in soccer. We present a novel pitch control algorithm that quantifies the probability of a player gaining possession at any location on the field. Our model accounts for the heterogeneity of player speeds by measuring performance during matches and assigning each player a specific top speed. We then compare the pitch control percentages derived from our approach with those from classical models, which assume uniform top speeds for all players, and analyze the results across different player roles (defenders, midfielders, and forwards). Our findings reveal a positive correlation between a player's top speed and their accumulated pitch control, with certain players benefiting more from this relationship. However, this positive correlation is constrained by the role of the player in the team, with defenders achieving the highest accumulated pitch control despite not being the fastest. Furthermore, our methodology supports team-level analysis, identifying which teams gain the greatest advantage from their players' top speeds, and extends to comparisons between the first and second halves of matches. Our model also enables exploration of how changes in top speed may affect pitch control at both the individual and team levels. To facilitate this, we introduce the stamina factor, a parameter that adjusts a player's top speed. We find that the impact of the stamina factor on pitch control follows a logarithmic function, with the scaling factor quantifying the potential benefits of increased speed. Interestingly, the influence of the stamina factor varies significantly by player position. Overall, our approach provides valuable insights into which teams or players could benefit most from improvements in physical performance.
Editorial analysis
A structured set of objections, weighed in public.
Referee Report
Summary. The paper presents a novel pitch control probability model for soccer that incorporates player-specific top speeds measured from match performance data instead of assuming uniform speeds across players. It compares the resulting pitch control percentages to classical uniform-speed models, reports a positive correlation between top speed and accumulated pitch control that is modulated by player position (with defenders achieving the highest control despite not being the fastest), and introduces a 'stamina factor' parameter to scale top speeds. The impact of this factor on pitch control is reported to follow a logarithmic function whose scaling quantifies speed benefits, with position-dependent variation; the model is also applied to team-level and first/second-half comparisons.
Significance. If the methodological details and validations hold, the work could contribute to more realistic pitch control modeling by capturing real heterogeneity in player speeds and offering a simple parametric way (via the stamina factor) to explore physical performance changes. The position-specific findings and team-level extensions might inform training or scouting priorities, though the absence of explicit validation steps for speed extraction limits immediate applicability.
major comments (3)
- [Methods] The protocol for extracting and validating player-specific top speeds from match data is not described (no mention of tracking source, peak identification criteria, context filtering, or cross-validation against independent measures). This is load-bearing for the central claims of speed–pitch-control correlation and position modulation, as systematic biases in speed inputs could artifactually produce the reported patterns.
- [Results (stamina factor analysis)] The logarithmic form of the stamina factor's impact on pitch control (and the associated scaling factor) is presented without clarification on whether it is independently derived from the model equations or obtained by fitting to the same pitch control outputs used for the main results. If fitted, this risks circularity in the position-dependent variation claims.
- [Results (correlation analysis)] No statistical details (correlation coefficients, significance tests, confidence intervals, or controls for player role as a confounder) are supplied for the positive speed–pitch-control correlation or its position constraints, undermining assessment of whether the defender advantage is robust or driven by unmodeled tactical factors.
minor comments (2)
- [Abstract] The abstract would benefit from stating the sample size (number of matches/players), data source for speeds, and basic model assumptions to allow readers to gauge scope.
- [Model description] Notation for the pitch control probability and stamina factor scaling should be defined explicitly at first use to improve readability for readers unfamiliar with prior pitch control literature.
Simulated Author's Rebuttal
We thank the referee for their thoughtful and constructive comments, which have helped us identify areas where the manuscript can be strengthened. We address each major comment point by point below, indicating the revisions we plan to make.
read point-by-point responses
-
Referee: [Methods] The protocol for extracting and validating player-specific top speeds from match data is not described (no mention of tracking source, peak identification criteria, context filtering, or cross-validation against independent measures). This is load-bearing for the central claims of speed–pitch-control correlation and position modulation, as systematic biases in speed inputs could artifactually produce the reported patterns.
Authors: We agree that the Methods section requires substantially more detail on the speed extraction process to support the central claims. In the revised manuscript we will add a dedicated subsection describing the tracking data source, the precise criteria used to identify peak speeds (including time windows and filtering for open-play contexts), any exclusion rules for non-representative periods, and available validation steps such as consistency checks across matches. This addition will allow readers to assess potential biases directly. revision: yes
-
Referee: [Results (stamina factor analysis)] The logarithmic form of the stamina factor's impact on pitch control (and the associated scaling factor) is presented without clarification on whether it is independently derived from the model equations or obtained by fitting to the same pitch control outputs used for the main results. If fitted, this risks circularity in the position-dependent variation claims.
Authors: The logarithmic relationship was identified empirically by varying the stamina factor over a range of values and observing the resulting pitch-control curves; it is not an analytic consequence of the model equations. To reduce concerns about circularity we will explicitly state the empirical nature of the fit in the revised text, supply the underlying data points or additional diagnostic plots, and note that position-dependent scaling is a descriptive outcome of the same simulations. If space permits we will also explore a hold-out validation of the functional form. revision: partial
-
Referee: [Results (correlation analysis)] No statistical details (correlation coefficients, significance tests, confidence intervals, or controls for player role as a confounder) are supplied for the positive speed–pitch-control correlation or its position constraints, undermining assessment of whether the defender advantage is robust or driven by unmodeled tactical factors.
Authors: We acknowledge the lack of formal statistical reporting. The revised manuscript will report Pearson (or Spearman) correlation coefficients, associated p-values, and 95% confidence intervals for the speed–pitch-control relationship. We will additionally present partial-correlation or regression analyses that control for player role, thereby quantifying the robustness of the position-specific patterns such as the defender advantage. revision: yes
Circularity Check
No significant circularity detected in derivation chain
full rationale
The paper introduces a novel pitch control probability model that incorporates player-specific top speeds extracted from match data, contrasts results against uniform-speed baselines, reports position-dependent correlations, and defines a stamina factor to explore speed adjustments whose effect is stated to follow a logarithmic form. No equations, self-citations, or derivation steps are quoted in the available text that reduce the reported correlations, logarithmic scaling, or position effects to tautological reproduction of the input speeds or fitted parameters by construction. The central claims therefore retain independent content from the model construction and data analysis rather than collapsing into self-definition or renamed fits.
Axiom & Free-Parameter Ledger
free parameters (1)
- stamina factor scaling
axioms (2)
- domain assumption Top speeds can be reliably extracted from match performance data for each player
- domain assumption Possession probability at any field location can be quantified from player speeds and positions
invented entities (1)
-
stamina factor
no independent evidence
Reference graph
Works this paper leans on
-
[1]
Okubo, A. (1986). Dynamical aspects of animal grouping: swarms, schools, flocks, and herds. Advances in biophysics, 22, 1-94. 14
work page 1986
-
[2]
Sumpter, D. J. (2006). The principles of collective animal behaviour. Philosophical transactions of the royal society B: Biological Sciences, 361(1465), 5-22
work page 2006
-
[3]
Vicsek, T., & Zafeiris, A. (2010). Collective motion. Physics Reports, 517(3-4), 71-140
work page 2010
-
[4]
Hamilton, W. D. (1971). Geometry for the selfish herd. Journal of Theoretical Biology, 31(2), 295-311
work page 1971
-
[5]
Vicsek, T., Czirok, A., Ben-Jacob, E., Cohen, I., & Shochet, O. (1995). Novel type of phase transition in a system of self-driven particles. Physical Review Letters, 75 (6), 1226
work page 1995
-
[6]
Gudmundsson, J., & Horton, M. (2017). Spatio-temporal analysis of team sports. ACM Comput. Surv. 50, 22
work page 2017
-
[7]
Balague, N., Torrents, C., Hristovski, R., Davids, K., & Ara´ ujo, D. (2013). Overview of complex systems in sport. Journal of Systems Science and Complexity, 26, 4-13
work page 2013
-
[8]
Nonlinear dynamics and networks in sports
Buld´ u, J.M., G´ omez, M.A., Herrera-Diestra, J.L., & Mart´ ınez, J.H. Nonlinear dynamics and networks in sports. Chaos, Solitons & Fractals 2021, 142, 110518
work page 2021
-
[9]
Memmert, D., Lemmink, K. A., & Sampaio, J. (2017). Current approaches to tactical performance analyses in soccer using position data. Sports medicine, 47(1), 1-10
work page 2017
-
[10]
Cervone, D., D’Amour, A., Bornn, L., & Goldsberry, K. (2016). A Multiresolution Stochastic Process Model for Predicting Basketball Possession Outcomes. Journal of the American Statistical Association, 111(514), 585–599. https://doi.org/10.1080/01621459.2016.1141685
-
[11]
Seidl, T., Cherukumudi, A., Hartnett, A., Carr, P., & Lucey, P. (2018, February). Bhostgusters: Real- time interactive play sketching with synthesized NBA defenses. In Proceeding of the 12th MIT Sloan Sports Analytics Conference, Boston, MA. Boston: MIT
work page 2018
-
[12]
Bridgeman, L. A., & Gill, N. D. (2021). The use of global positioning and accelerometer systems in age-grade and senior rugby union: a systematic review. Sports Medicine-Open, 7, 1-34
work page 2021
-
[13]
Rahimian, P. & Toka, L. (2022). ”Optical tracking in team sports: A survey on player and ball tracking methods in soccer and other team sports” Journal of Quantitative Analysis in Sports, 18, no. 1, pp. 35-57. https://doi.org/10.1515/jqas-2020-0088
-
[14]
Torres-Ronda, L., Beanland, E., Whitehead, S., Sweeting, A., & Clubb, J. (2022). Tracking systems in team sports: a narrative review of applications of the data and sport specific analysis. Sports Medicine- Open, 8(1), 15
work page 2022
-
[15]
Kovalchik, S. A. (2023). Player tracking data in sports. Annual Review of Statistics and Its Application, 10(1), 677-697
work page 2023
-
[16]
Novillo, ´A., Cord´ on-Carmona, A., Garc´ ıa-Aliaga, A., Roman, I. R., del Campo, R. L., Resta, R., & Buld´ u, J. M. (2024). Analysis of player speed and angle toward the ball in soccer. Scientific Reports, 14(1), 11780
work page 2024
-
[17]
Marcelino, R., Sampaio, J., Amichay, G., Gon¸ calves, B., Couzin, I. D., & Nagy, M. (2020). Collective movement analysis reveals coordination tactics of team players in soccer matches. Chaos, Solitons & Fractals, 138, 109831
work page 2020
-
[18]
Buld´ u, J. M., Garrido, D., Antequera, D. R., Busquets, J., Estrada, E., Resta, R., & del Campo, R. L. (2020b). soccer tracking networks: Beyond event-based connectivity, in Conference on Analytics in Sports Tomorrow 2020, ed F.C. Barcelona., 1–13
work page 2020
-
[19]
Chacoma, A., Billoni, O. V., & Kuperman, M. N. (2022). Complexity emerges in measures of the marking dynamics in soccer games. Physical Review E, 106(4), 044308
work page 2022
-
[20]
Taki, T., & Hasegawa, J.I. (1998). Dominant region: a basic feature for group motion analysis and its application to teamwork evaluation in soccer games. In Videometrics VI, 3641,48-57, S.P.I.E
work page 1998
-
[21]
(1908) Nouvelles applications des parametres continus a la theorie des formes quadra- tiques
Voronoi, G.M. (1908) Nouvelles applications des parametres continus a la theorie des formes quadra- tiques. J. Reine Angew. Math., 134, 198
work page 1908
-
[22]
Kim, S. (2004). Voronoi analysis of a soccer game. Nonlinear Analysis: Modelling and Control, 9(3), 233-240
work page 2004
-
[23]
Spearman, W., Basye, A., Dick, G., Hotovy, R., & Pop, P. (2017). Physics-based modeling of pass probabilities in soccer. In Proceeding of the 11th MIT Sloan Sports Analytics Conference
work page 2017
-
[24]
Tuo, Q., Wang, L., Huang, G., Zhang, H., & Liu, H. (2019). Running performance of soccer players dur- ing matches in the 2018 FIFA World Cup: Differences among confederations. Frontiers in Psychology, 15 10, 1044
work page 2019
-
[25]
https://tracab.com/products/tracab-technologies/tracab-optical/ [Accessed on 10th May 2024]
work page 2024
-
[26]
Pons, E., Garc´ ıa-Calvo, T., Resta, R., Blanco, H., L´ opez Del Campo, R., D´ ıaz Garc´ ıa, J., & Pulido, J.J. (2019). A comparison of a GPS device and a multi-camera video technology during official soccer matches: Agreement between systems. PloS One, 14(8), e0220729
work page 2019
-
[27]
Felipe, J.L., Garcia-Unanue, J., Viejo-Romero, D., Navandar, A., & S´ anchez-S´ anchez, J. (2019). Vali- dation of a video-based performance analysis system (Mediacoach ®) to analyze the physical demands during matches in LaLiga. Sensors 19(19), 4113
work page 2019
-
[28]
https://github.com/Friends-of-Tracking-Data-FoTD/LaurieOnTracking [Accessed on 10th January 2024]. 16
work page 2024
discussion (0)
Sign in with ORCID, Apple, or X to comment. Anyone can read and Pith papers without signing in.