REVIEW 4 major objections 5 minor 35 references
Fairness-aware Dynamic Hosting Capacity and the Impacts of Strategic Solar PV Curtailment
T0 review · 4 major / 5 minor · reviewed 2026-08-16 · deepseek-v4-flash
Pith's one-line read Tighter grid bounds enable 50% more solar with 5% curtailment
desk verdict A modest but real tightening of the CIA branch-current bound, a clean fairness extension, and an interesting 50%-for-5% curtailment result that is a perfect-foresight simulation, not yet a robustness guarantee. read the letter →
The pith
A machine-rendered reading of the paper's core claim, the machinery that carries it, and where it could break.
The reading
What carries the argument
The load-bearing object is the convex inner approximation (CIA): a hyperrectangle of nodal power injections inside the AC-admissible set, computed by solving the convex problem (P1) twice, once for upper and once for lower injection limits. The improvement is a new upper bound, Eq. (10), which replaces the conservative branch-current bound from the earlier method with a second-order-cone constraint, $\|(2P^\bullet_{ij},\,2Q^\bullet_{ij},\,l^+_{ij}-v^-_i)\|_2 \le l^+_{ij}+v^-_i$, derived as the epigraph of $l_{ij} = (P_{ij}^2+Q_{ij}^2)/v_i$. Because the cone bound tracks the true branch-current relation much more closely, the voltage proxy $V^+$ is smaller, the feasible rectangle is larger, and every point inside it remains certified safe. Fairness is then imposed with the L1-L2 norm inequality $(1-\epsilon+\epsilon/\sqrt{N})\|p\|_2 \le \|p\|_1$, which is second-order-cone representable and explicitly enforces at least $\epsilon$-fair allocations; with demand-proportional weights it becomes Eq. (15).
What would settle it
Repeat the Scenario 1-F2 dynamic hosting-capacity computation on the same feeder, then run an actual AC power-flow simulation at every 5-minute time step using nodal demand and solar measurements with, say, plus or minus 10% forecast error or with measured diverse PV profiles instead of one shared profile; if any point inside the advertised hyperrectangle violates voltage or branch-current limits, the central guarantee fails.
Extended reading notes
Core claim
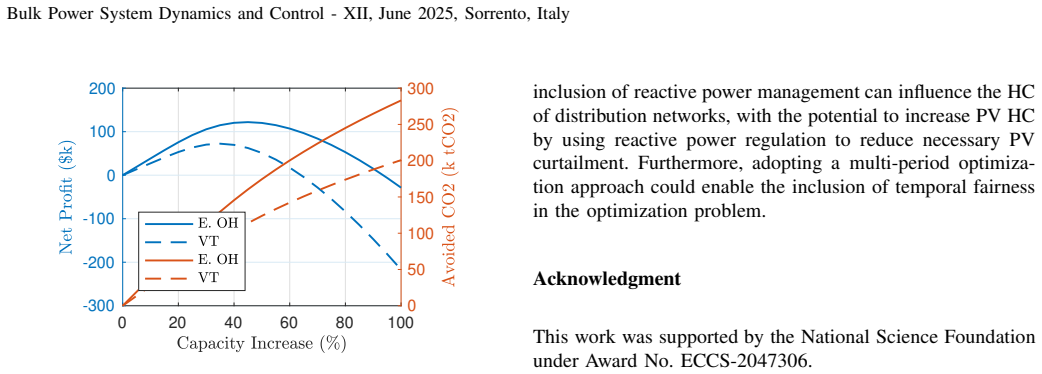
The central discovery is that the SOC-based upper bound in Eq. (10) is a tighter convex envelope for branch currents than the bound used in the prior convex inner approximation, so every hyperrectangle of independently controllable injections fits inside the true AC-admissible set while having larger volume. This makes the hosting-capacity computation less conservative without sacrificing the guarantee that every point in the computed rectangle is AC-admissible. On the modified IEEE-37 feeder, the method yields a dynamic hosting capacity under Scenario 1-F2, an unweighted linear objective with demand-proportional fairness at epsilon = 0.85, such that a 50% increase over the static base PV capacity requires curtailment of only about 5 to 7% of annual solar energy, and at a $100/tCO2 carbon price the carbon revenue exceeds the curtailment cost, giving positive net profit in the range of roughly 30% capacity increase. Fairness is quantified with Jain's fairness index applied to the ratio of hosting capacity to demand, and the paper finds that fairer allocations reduce both PV curtailment and CO2 emissions compared with unfair allocations.
Load-bearing premise
The entire safety guarantee rests on the claim that every power injection inside the computed hyperrectangle is AC-admissible, which is inherited from the convex inner approximation and, in the dynamic case, presumes exact 5-minute demand and solar output at every node with a single shared solar profile and perfect foresight.
Editorial extensions
If this is right
- The tighter SOC bound directly enlarges the hosting-capacity hyperrectangle, so utilities can allow more distributed solar at the same level of safety assurance.
- A 50% increase in installed PV capacity can be absorbed with only about 5% annual energy curtailment, meaning curtailment need not be a barrier to aggressive solar targets.
- Fair, demand-proportional allocation reduces both curtailment and CO2 emissions compared with unweighted or demand-weighted linear objectives that let some nodes dominate.
- When carbon revenue is counted at $100/tCO2, net profit peaks near a 30% capacity increase and stays positive over a meaningful range, so carbon pricing can justify deliberate curtailment.
- Locational grid emissions matter: the same method yields far larger carbon reductions in fossil-heavy regions than in regions with already clean generation.
Reading between the lines
- Editorial inference: the no-negative-grid-impacts guarantee depends on exact 5-minute demand and solar forecasts; with forecast error or geographically diverse PV profiles, the advertised safety margin would need a robust or chance-constrained reformulation, which the paper lists as future work.
- Editorial inference: temporal fairness is only measured after the fact in this paper, so embedding it directly as a multi-period optimization constraint is a natural next step that would likely reduce the sharp temporal drops in hosting capacity seen for unfair scenarios.
- Editorial inference: the same tightened inner approximation could be applied beyond solar hosting to storage, electric vehicles, or demand response, wherever independent DER injections must be certified AC-admissible.
- Editorial inference: a utility could tune both the fairness parameter epsilon and the capacity increase against its local carbon price and curtailment tariff, turning the paper's curves into a direct investment rule.
Signed reviews
Editorial analysis
A structured set of objections, weighed in public.
Referee Report
Summary. This paper extends the convex inner approximation (CIA) method of [12] for radial distribution feeders by replacing the Taylor-based upper bound on branch currents with a second-order-cone (SOC) epigraph constraint that uses four corner combinations of the proxy power-flow variables. It then formulates dynamic hosting capacity (DHC) as a sequence of convex programs and introduces an ε-fairness constraint based on the L1-L2 norm inequality, with two objective variants (linear/logarithmic and demand-weighted). On a modified IEEE-37 feeder with one year of 5-minute demand and solar data, the authors report that a 50% increase in PV capacity is possible with roughly 5% annual solar curtailment, and that a demand-proportional fair allocation (Scenario 1-F2, ε=0.85) yields higher net profit when curtailment cost is balanced against carbon revenue at $100/tCO2. The paper also quantifies temporal and spatial Jain Fairness Index values and compares results across six allocation scenarios, demand levels, and carbon prices.
Significance. If the numerical results are corrected, the paper makes a useful contribution: the SOC upper bound is a valid convex restriction and is shown on test systems to be tighter than the bound from [12]; the ε-fairness constraint provides a tunable and convex way to control spatial equity in host-capacity allocation; and the case study addresses a practically important trade-off between curtailment, hosting capacity, and carbon value. The paper also deserves credit for benchmarking the inner approximation against actual AC power-flow solutions via MatPower sweeps (Figs. 3–4) and for explicitly relating ε-fairness to Jain's Fairness Index in Eq. (16). However, the headline quantitative claims currently rest on a unit inconsistency in the carbon calculation, a numerical claim in the abstract that is not supported by Table IV, and an unqualified 'no negative grid impacts' statement that assumes perfect 5-minute foresight.
major comments (4)
- [Section 4.4, Eq. (30)] The carbon-avoidance equation mixes units. In the text, P_add is in MW, Δt is in hours (5 minutes), mgrid is defined as gCO2/MWh near Eq. (30), and mpv is defined as gCO2/kWh in the same section; these quantities cannot be subtracted as written. If both emission factors are intended in gCO2/kWh, then the product P_add (MW) times Δt (h) must be multiplied by 1000 to convert MWh to kWh before applying the g-to-tonne factor of 10^-6, and that factor of 1000 is missing. If mgrid is truly in gCO2/MWh, then mpv must be converted to the same units. Either way, the carbon revenue and net-profit numbers in Table IV and Figs. 17–19 are not reliable as reported. Please correct the units, re-run the economic calculations, and update the abstract and conclusions accordingly.
- [Abstract and Table IV] The abstract states that 'with no more than 5% annual solar PV energy curtailed, it is possible to increase solar PV hosting capacity by at least 50%.' Table IV, however, reports the curtailed-energy percentage at the 50% capacity-increase point as 6.5% for Scenario 3, 6.9% for Scenario 4 and Scenario 1-F2, 7.3% for Scenario 1-F1, and up to 10% for Scenario 1. No scenario in the table satisfies the 'no more than 5%' condition at 50% increase. Please reconcile the numerical claim with the reported results, or report the capacity-increase level at which curtailment is actually no more than 5% and adjust the abstract and conclusions accordingly.
- [Section 5 and Eq. (24)] The 'no negative grid impacts' guarantee is certified only for the exact 5-minute nodal demand profile and the single shared PV profile used to solve (P1). The curtailment rule in Eq. (24) caps PV output at p+_g,i(t), but if the actual demand at an interval is lower than the value used in the optimization, or if solar output differs across nodes, the realized injection vector can lie outside the hyperrectangle for which AC admissibility was certified. Since Section 5 lists uncertainty in net-demand and geographically diverse PV generation profiles as future work, the abstract's unconditional 'no negative grid impacts' statement overstates what the simulations establish. Please add a forecast-error sensitivity study or explicitly qualify the result as a perfect-foresight planning result.
- [Section 2.4, Eq. (10) and Fig. 4] The paper claims that the proposed SOC upper bound satisfies l+_SOC ≤ l+_from[12] for all branch currents and uses this dominance to argue for a larger hyperrectangle in Table I. This dominance is only demonstrated by simulation for one injection pattern on the IEEE-37 network; no proof is given that the SOC bound always dominates the Taylor-based bound from [12]. If the dominance is not guaranteed, then the 'more accurate and larger inner approximation' claim is case-dependent. Please either provide a proof or state the comparison as an empirical observation and soften the corresponding claims in the introduction and Section 2.4.
minor comments (5)
- [Footnote 5, Section 3.2] The choice of ε=0.85 is made on the same case study and tuned for capacity increases below 60%. Since the headline result uses this value, please state the selection criterion explicitly and discuss how sensitive the main conclusions are to ε outside the tested range.
- [Section 4.4, Eq. (30)] The variable mpv is introduced as a constant (40 gCO2/kWh) but appears as mpv(t) in Eq. (30); please clarify whether it is time-varying or constant.
- [Section 2.5, Eqs. (12k)–(12l)] The inequalities in (12k)–(12l) appear reversed relative to the definitions of P+ and P− in (4), unless overline/underline notation was lost in typesetting. Please check the direction of the bound constraints or clarify the notation.
- [Section 3.2, Eq. (15)] The LaTeX artifacts 'radicaltp/radicalvertex' should be replaced with a properly typeset square root, and the assumption α_i > 0 should be stated in the text before Eq. (15).
- [Section 4.2, Eq. (25)] The parenthetical 'where base case corresponds to the minimum base energy across all scenarios' is confusing, since Ebase in Eq. (25) is scenario-specific through Lpv,i in Eq. (19); please clarify the definition.
Circularity Check
No significant circularity: the SOC envelope is a mathematically derived tightening of [12] and the headline result is an explicitly tuned simulation outcome, not a prediction forced by construction.
full rationale
The paper's derivation chain is self-contained at the points that matter. The new upper bound in Eq. (10) is obtained by replacing the nonconvex branch-current equation (1d) with its rotated-SOC epigraph; since V- <= V is enforced by the proxy constraints, the inequality l+ >= (P^2+Q^2)/V- >= (P^2+Q^2)/V gives a valid upper bound, and the paper benchmarks the tightness of this bound against actual branch currents computed from (1d) via PowerModels (Fig. 4) and against the MatPower AC-admissible set (Fig. 3). This is external evidence, not a self-citation. The fairness formulation uses the L1-L2 inequality from [19] (Sundar et al.), which is not prior work of the present authors, and the JFI metric is explicitly chosen to be 'aligned with our definition of fairness' rather than being presented as an independent discovery. The choice epsilon=0.85 is acknowledged as a simulation-based selection ('based on extensive simulations, selecting epsilon = 0.85 results in the best performance'), so the 50%/5% headline is a tuned case-study result, not a fitted parameter renamed as an out-of-sample prediction. The self-citations to [11], [12], and [26] are to peer-reviewed prior work and to a data source; the CIA guarantee from [12] is a published mathematical result whose stated assumptions do not include the new SOC envelope or the fairness claims, and the new bound is validated independently. The energy accounting in Eqs. (24)-(28) is arithmetic identity (curtailed energy is defined as max(0, P_new - p+); additional energy is E_new - E_curt - E_base), so it does not smuggle the conclusion into the input. The acknowledged perfect-foresight limitation is a robustness/correctness caveat, not circularity. Overall, no load-bearing step reduces to its own input by construction.
Assumptions & free parameters
free parameters (4)
- epsilon fairness parameter =
0.85
- carbon price lambda_CO2 =
$100/tCO2 (main case; range $50-$200)
- curtailment charge lambda_curt =
$0.20/kWh (VT), $0.15/kWh (Eastern Ohio)
- demand scaling factor =
+25% / -25%
assumptions (6)
- domain assumption DistFlow equations (1) exactly model the balanced radial distribution feeder.
- domain assumption Every point inside the hyperrectangle computed from (P1) is AC-admissible.
- standard math The branch-current function l(P,Q,V)=(P^2+Q^2)/V is convex on V>0, so the first-order lower bound and SOC upper bound are valid.
- domain assumption All DER nodes use the same time-synchronized solar generation profile, and 5-minute demand and solar data are known exactly.
- domain assumption WattTime MOER data and the solar/fuel life-cycle emission factors are accurate.
- ad hoc to paper The economic analysis need not include capital or upgrade costs when claiming 'net positive economic impact'.
Cite this review
Pith. "Pith review of Fairness-aware Dynamic Hosting Capacity and the Impacts of Strategic Solar PV Curtailment." pith.science (2026). https://pith.science/paper/SA5SVEBT
@misc{pith2026250418905,
  author       = {Pith},
  title        = {Pith review of: Fairness-aware Dynamic Hosting Capacity and the Impacts of Strategic Solar PV Curtailment},
  year         = {2026},
  howpublished = {\url{https://pith.science/paper/SA5SVEBT}},
  note         = {Machine review of arXiv:2504.18905}
}
read the original abstract
Rapid deployment of distributed energy resources (DERs), such as solar photovoltaics (PV), poses a risk to the distribution grid under high penetration. Therefore, studying hosting capacity (HC) limits considering grid physics and demand variability is crucial. This paper introduces an improved framework for determining the HC of radial distribution networks by enhancing an existing convex inner approximation (CIA) approach. The proposed method achieves a more accurate and larger inner approximation, resulting in better HC limits. We also consider time-varying demand and the design of objective functions to ensure equitable access to grid resources. A case study with solar PV integration is conducted using a modified IEEE-37 radial network to examine the impact of increased PV capacity, demonstrating that with no more than 5% annual solar PV energy curtailed, it is possible to increase solar PV hosting capacity by at least 50% with no negative grid impacts and a net positive economic impact when accounted for the cost of carbon. Results show that fair allocation methods can lead to higher net profits and reduced PV curtailment and CO2.
Figures


Figures from the paper (13 more)


Reference graph
Works this paper leans on
-
[12]
N. Nazir and M. Almassalkhi, “Grid-aware aggregation a nd real-time disaggregation of distributed energy resources in radial n etworks,” IEEE Transactions on Power Systems , vol. 37, no. 3, pp. 1706–1717, 2021
work page 2021
-
[19]
A Parametric, Second-Order Cone Representable Model of Fairness for Decision-Making Problems
K. Sundar, D. Deka, and R. Bent, “A parametric, second-o rder cone representable model of fairness for decision-making p roblems,” https://arxiv.org/abs/2412.05143, 2024
work page Pith review arXiv 2024
-
[1]
US Solar Market In sight Report,
S. E. I. Association and W. Mackenzie, “US Solar Market In sight Report,” https://www.seia.org/us-solar-market-insigh t, 2024
work page 2024
-
[2]
Annual Energy Outlook 2023: Na rrative,
U. E. I. Administration, “Annual Energy Outlook 2023: Na rrative,” https://www.eia.gov/outlooks/aeo, March 2023
work page 2023
-
[3]
M. M. Haque and P . Wolfs, “A review of high pv penetrations in lv distribution networks: Present status, impacts and mitiga tion measures,” Renewable and Sustainable Energy Reviews , vol. 62, pp. 1195–1208, 2016
work page 2016
-
[4]
B. Bletterie, S. Kadam, R. Bolgaryn, and A. Zegers, “V olt age Control with PV Inverters in Low V oltage Networks—In Depth Analysis of Different Concepts and Parameterization Criteria,” IEEE Transactions on Power Systems , vol. 32, no. 1, pp. 177–185, Jan 2017
work page 2017
-
[5]
ANOCA: AC Network-aware Opti mal Curtailment Approach for Dynamic Hosting Capacity,
E. O. Badmus and A. Pandey, “ANOCA: AC Network-aware Opti mal Curtailment Approach for Dynamic Hosting Capacity,” 2024
work page 2024
-
[6]
Wind and Solar Energy Cu rtailment: Experience and Practices in the United States,
L. Bird, J. Cochran, and X. Wang, “Wind and Solar Energy Cu rtailment: Experience and Practices in the United States,” National Re newable Energy Laboratory (NREL), Technical Report NREL/TP–6A20- 60983, Mar 2014
work page 2014
Show all 35 references
-
[7]
Too much of a goo d thing? global trends in the curtailment of solar pv,
E. O’Shaughnessy, J. R. Cruce, and K. Xu, “Too much of a goo d thing? global trends in the curtailment of solar pv,” Solar Energy, vol. 208, pp. 1068–1077, 2020
2020
-
[8]
DER Hosting Capacity Enve lope in Unbalanced Distribution Systems,
M. Mahmoodi and L. Blackhall, “DER Hosting Capacity Enve lope in Unbalanced Distribution Systems,” in 2021 IEEE PES Innovative Smart Grid Technologies Europe (ISGT Europe) , 2021, pp. 1–6
2021
-
[9]
Us ing OPF- Based Operating Envelopes to Facilitate Residential DER Se rvices,
M. Z. Liu, L. F. Ochoa, P . K. C. Wong, and J. Theunissen, “Us ing OPF- Based Operating Envelopes to Facilitate Residential DER Se rvices,” IEEE Transactions on Smart Grid , vol. 13, no. 6, pp. 4494–4504, Jan. 2022
2022
-
[10]
Examining the limits of the application of semidefinite pro gramming to power flow problems,
B. C. Lesieutre, D. K. Molzahn, A. R. Borden, and C. L. DeM arco, “Examining the limits of the application of semidefinite pro gramming to power flow problems,” in 2011 49th Annual Allerton Conference on Communication, Control, and Computing (Allerton) , 2011, pp. 1492– 1499
2011
-
[11]
Convex inner approximati on of the feeder hosting capacity limits on dispatchable demand,
N. Nazir and M. Almassalkhi, “Convex inner approximati on of the feeder hosting capacity limits on dispatchable demand,” in 2019 IEEE 58th Conference on Decision and Control (CDC) , Nice, France, 2019, pp. 4858–4864
2019
-
[13]
Optimal sizing of capacitors plac ed on a radial distribution system,
M. Baran and F. F. Wu, “Optimal sizing of capacitors plac ed on a radial distribution system,” IEEE Transactions on Power Delivery, vol. 4, no. 1, pp. 735–743, 1989
1989
-
[14]
Inequitable access to distributed energy resources due to grid infrastructure limits in california,
A. M. Brockway, J. Conde, and D. Callaway, “Inequitable access to distributed energy resources due to grid infrastructure limits in california,” Nature Energy, vol. 6, pp. 892–903, 2021
2021
-
[15]
The impact of policies and business models on income equity in rooftop s olar adoption,
E. O’Shaughnessy, G. Barbose, R. Wiser, and et al., “The impact of policies and business models on income equity in rooftop s olar adoption,” Nature Energy, vol. 6, pp. 84–91, 2021
2021
-
[16]
Robust Dynamic Operating E nvelopes for DER Integration in Unbalanced Distribution Networks,
B. Liu and J. H. Braslavsky, “Robust Dynamic Operating E nvelopes for DER Integration in Unbalanced Distribution Networks,” IEEE Transac- tions on Power Systems , vol. 39, no. 2, pp. 3921–3936, March 2024. Bulk Power System Dynamics and Control - XII, June 2025, Sorr ento, Italy
2024
-
[17]
Operating Envelopes for Prosumers in L V Net works: A Weighted Proportional Fairness Approach,
K. Petrou, M. Z. Liu, A. T. Procopiou, L. F. Ochoa, J. Theu nissen, and J. Harding, “Operating Envelopes for Prosumers in L V Net works: A Weighted Proportional Fairness Approach,” in 2020 IEEE PES In- novative Smart Grid Technologies Europe (ISGT-Europe) , The Hague, Netherla...
2020
-
[18]
Fair Resource Allocation Schemes and Network Dimensioning Problems,
W. Ogryczak, T. ´Sliwi´ nski, and A. Wierzbicki, “Fair Resource Allocation Schemes and Network Dimensioning Problems,” Journal of Telecommu- nications and Information Technology , no. 3, pp. 34–42, 2003
2003
-
[20]
Non-loca l approxima- tion of power flow equations with guaranteed error bounds,
R. Heidari, M. M. Seron, and J. H. Braslavsky, “Non-loca l approxima- tion of power flow equations with guaranteed error bounds,” i n 2017 Australian and New Zealand Control Conference (ANZCC) , 2017, pp. 83–88
2017
-
[21]
Exact Convex Relax ation of Optimal Power Flow in Radial Networks,
L. Gan, N. Li, U. Topcu, and S. H. Low, “Exact Convex Relax ation of Optimal Power Flow in Radial Networks,” IEEE Transactions on Automatic Control, vol. 60, no. 1, pp. 72–87, 2015
2015
-
[22]
A Survey of Relaxations and Approximations of the Power Flow Equations,
D. K. Molzahn and I. A. Hiskens, “A Survey of Relaxations and Approximations of the Power Flow Equations,” F oundations and Trends in Electric Energy Systems , vol. 4, no. 1-2, pp. 1–221, 2019
2019
-
[23]
Mat- power: Steady-state operations, planning, and analysis to ols for power systems research and education,
R. D. Zimmerman, C. E. Murillo-S´ anchez, and R. J. Thoma s, “Mat- power: Steady-state operations, planning, and analysis to ols for power systems research and education,” IEEE Transactions on Power Systems , vol. 26, no. 1, pp. 12–19, 2011
2011
-
[24]
Powe rModels.jl: An Open-Source Framework for Exploring Power Flow Formulat ions,
C. Coffrin, R. Bent, K. Sundar, Y . Ng, and M. Lubin, “Powe rModels.jl: An Open-Source Framework for Exploring Power Flow Formulat ions,” in 2018 Power Systems Computation Conference (PSCC) , June 2018, pp. 1–8
2018
-
[25]
Boyd and L
S. Boyd and L. V andenberghe, Convex Optimization . Cambridge: Cambridge University Press, 2004
2004
-
[26]
Hierarchical, grid-aware, and economically optimal coo rdination of distributed energy resources in realistic distribution systems,
M. Almassalkhi, S. Brahma, N. Nazir, H. Ossareh, P . Rach erla, S. Kundu, S. P . Nandanoori, T. Ramachandran, A. Singhal, D. G ayme et al., “Hierarchical, grid-aware, and economically optimal coo rdination of distributed energy resources in realistic distribution systems,” Ene...
2020
-
[27]
L. N. Trefethen and D. B. III, Numerical Linear Algebra . Philadelphia, PA: SIAM, 1997
1997
-
[28]
A Quantitative Measure of Fair- ness and Discrimination for Resource Allocation in Shared C omputer Systems,
R. Jain, D. M. Chiu, and W. Hawe, “A Quantitative Measure of Fair- ness and Discrimination for Resource Allocation in Shared C omputer Systems,” DEC Research, Tech. Rep. TR-301, 1984
1984
-
[29]
Fair-over-ti me distributed energy resource coordination,
H. Moring, X. Farrell, and J. L. Mathieu, “Fair-over-ti me distributed energy resource coordination,” in 2024 60th Annual Allerton Conference on Communication, Control, and Computing , 2024, pp. 1–8
2024
-
[30]
Rates and Regulations,
Green Mountain Power, “Rates and Regulations,” https://greenmountainpower.com/rates/
-
[31]
Carbon Pricing Dashboard: Compliance Car bon Prices,
World Bank, “Carbon Pricing Dashboard: Compliance Car bon Prices,” https://carbonpricingdashboard.worldbank.org/compliance/price
-
[32]
Comprehensive evidence implies a higher so cial cost of co2,
K. Rennert, F. Errickson, B. C. Prest, L. Rennels, R. G. N ewell, W. Pizer, C. Kingdon, J. Wingenroth, R. Cooke, B. Parthum, D. Smith, K. Cromar, D. Diaz, F. C. Moore, U. K. M¨ uller, R. J. Plevin, A. E. Raftery , H. ˇSevˇ c´ ıkov´ a, H. Sheets, J. H. Stock, T. Tan, M. Watson,...
2022
-
[33]
Life Cycle Ass essment Har- monization,
National Renewable Energy Laboratory, “Life Cycle Ass essment Har- monization,” https://www.nrel.gov/analysis/life-cycl e-assessment.html , 2024
2024
-
[34]
WattTime Data Signals API,
WattTime, “WattTime Data Signals API,” https://watttime.org/data-science/data-signals/ , 2024
2024
-
[35]
Electric Po wer Monthly: Table 5.6.A. Average Price of Electricity to Ultimate Custo mers by End- Use Sector,
U.S. Energy Information Administration, “Electric Po wer Monthly: Table 5.6.A. Average Price of Electricity to Ultimate Custo mers by End- Use Sector,” 2023
2023
Reviewed August 16, 2026 · model on record in the stance chip above.
Discussion (0). Continue with ORCID to comment.