REVIEW 3 major objections 5 minor 14 references
Tracking an eruptive intermediate prominence originating from the farside of the Sun
T0 review · 3 major / 5 minor · reviewed 2026-08-16 · deepseek-v4-flash
Pith's one-line read Using a croissant-shaped geometric model fitted to three simultaneous EUV views, this paper reconstructs a prominence erupting behind the Sun's eastern limb on 2023 March 12 and locates its source region and far-side footpoint.
desk verdict A credible first application of GCS to a farside prominence, but the 'pinpointed' footpoint coordinates carry more uncertainty than the abstract suggests. read the letter →
The pith
A machine-rendered reading of the paper's core claim, the machinery that carries it, and where it could break.
The reading
What carries the argument
The load-bearing object is the Graduated Cylindrical Shell (GCS) model, a purely geometric croissant composed of two coplanar conical legs joined by a middle circular cross-section, with parameters leg height $h$, half-angle $\alpha$, aspect ratio $\kappa=\sin\delta$, source Carrington longitude $\varphi$, latitude $\theta$, and tilt angle $\gamma$ with respect to the meridian. The paper projects this parametric shell into the image planes of simultaneous EUV and Lyman-$\alpha$ observations and adjusts the parameters until the projections overlie the prominence, using the leading-edge height $h_{\mathrm{LE}} = h(1+\kappa)(1+\sin\alpha)/[(1-\kappa^2)\cos\alpha]$. This step carries the whole argument because it turns projected 2D shapes into a 3D source location and propagation direction; the spectroscopic rotation signal and time-slice trajectories then carry the subsidiary kink-instability inference.
What would settle it
Fit the same 16 moments with a non-coplanar or two-shell version of the model, or track the prominence by direct triangulation from a spacecraft with a significantly larger vantage separation than the roughly $28^\circ$ available here; if the best-fit source longitude moves by more than the fit uncertainties or the leading edge deviates from the GCS prediction, the single-croissant radial-propagation assumption fails. A future farside magnetogram showing no polarity inversion line connecting roughly $110^\circ$E, $43^\circ$N with $162^\circ$E, $44^\circ$N would also undermine the claimed source and footpoint locations.
Extended reading notes
Core claim
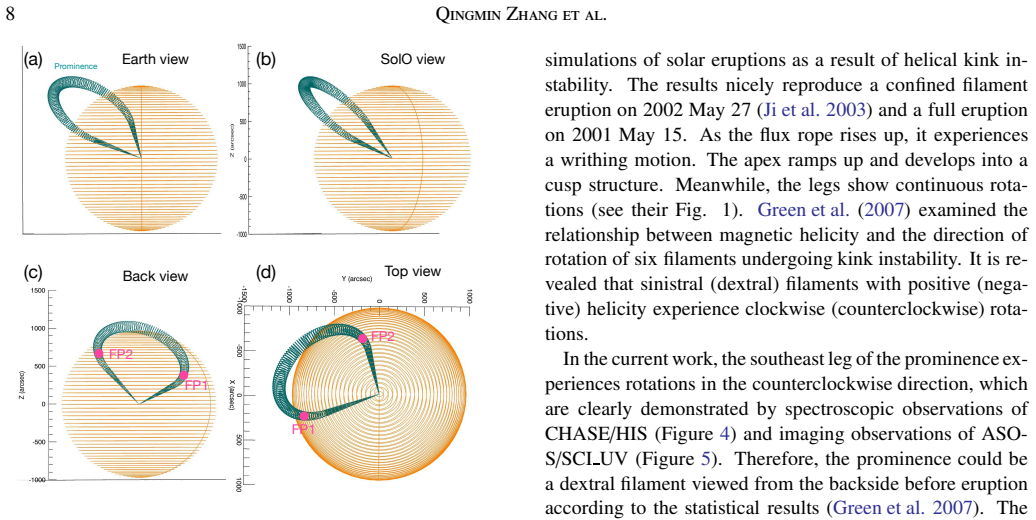
On its own terms, the paper's central claim is that the standard GCS forward model provides a valid 3D reconstruction of an intermediate prominence whose structure spans the visible and far side of the Sun. Between 02:30 and 04:25 UT the fitted model reproduces the loop-like prominence from three viewpoints, with a fixed leg separation of about $2\alpha \approx 80^\circ$ and aspect ratio $\kappa \approx 0.05$; the leading edge rises from about $1.26\,R_{\odot}$ to $2.27\,R_{\odot}$. The fit yields Carrington longitude $\varphi \approx -110^\circ$ (about $110^\circ$ east of the Sun-Earth line), latitude $\theta \approx 40^\circ$–$43^\circ$, and tilt $\gamma \approx 70^\circ$ with respect to the meridian, which places the source behind the limb and identifies the second footpoint at $162^\circ$E, $44^\circ$N, about 896 Mm from the visible footpoint. A cubic fit to the leading-edge height gives a true CME speed increasing from about 610 to 849 km s$^{-1}$. This is presented as the first time GCS has been used to track a prominence itself for nearly two hours.
Load-bearing premise
The reconstruction stands on the assumption that the prominence really has the GCS croissant geometry—two straight, coplanar conical legs joined by a circular arc—and that it propagated radially without deflection, even though no farside magnetograms exist to check the true magnetic field and the paper itself notes the model is purely geometrical.
Editorial extensions
If this is right
- Farside prominence eruptions can be located and tracked in 3D even when only EUV and Lyman-alpha images from near-Earth and near-1 AU viewpoints are available.
- For CMEs associated with tracked prominences, the GCS propagation direction converts apparent speeds into true speeds; here the true speed rises from about 610 to 849 km s$^{-1}$.
- The standard GCS model can handle intermediate prominences with widely separated footpoints, beyond the reach of the earlier revised cone and revised GCS models.
- The counterclockwise rotation, cusp-shaped apex, and post-04:30 drift of the northwest leg fit the writhing signature of ideal kink instability, adding a farside example of that trigger mechanism.
- The absence of a type II radio burst indicates the CME likely did not drive a shock wave, a relevant constraint for predicting solar energetic particles.
Reading between the lines
- If the GCS approach transfers reliably, the same fitting could localize the parent active regions of farside flares and energetic-particle or sustained-gamma-ray events whenever two or more EUV imagers with modest separation are looking, without waiting for direct farside magnetograms.
- The paper's caveat that the farside magnetic field is unknown suggests a natural validation test: once farside magnetograms become available, check whether the fitted polarity inversion line actually connects the two GCS footpoints.
- The cusp formation and leg drift after 04:30 UT can be read as the time when the coplanar GCS assumption starts to fail; splitting the tracking into pre- and post-cusp fits could quantify the writhing deflection.
- The catalog of earlier behind-the-limb events in the paper is dominated by fast, shock-driving CMEs; applying this method to slower events such as this one may reveal a larger population of moderate farside eruptions with weaker space-weather impact.
Signed reviews
Editorial analysis
A structured set of objections, weighed in public.
Referee Report
Summary. The paper presents multiwavelength and multiview observations of an intermediate prominence eruption on 2023 March 12, whose southeast footpoint is in AR 13252 on the visible disk and whose northwest footpoint is on the farside. Using SDO/AIA, GOES-16/SUVI, ASO-S/SCI UV, SolO/EUI, CHASE/HIS, and STEREO-A/COR2 data, the authors characterize the prominence's rise, rotation, cusp formation, and associated B7.8 flare and partial-halo CME. Their central novelty claim is the first application of the standard GCS forward model to reconstruct and continuously track the prominence for about two hours, from which they pinpoint the farside source region at (110E, 43N) and the second footpoint at (162E, 44N), and derive the true CME speed range 610-849 km/s. They attribute the eruption to the ideal kink instability based on the observed counterclockwise leg rotation, apex cusping, and northwest-leg drift, while acknowledging that the total twist could not be measured.
Significance. If the GCS-based reconstruction is robust, the paper would be a valuable demonstration that forward modeling of an eruptive prominence can locate the source region of a farside eruption and constrain its second footpoint, using the close-to-radial propagation assumption. The study makes good use of a rare multi-spacecraft data set (SDO, STEREO-A, SolO, ASO-S, CHASE) and combines EUV, Ly-alpha, H-alpha Doppler, and coronagraph observations. The derived kinematics, the morphology parameters (edge-on and face-on widths, tilt angle), and the comparison with a PFSS extrapolation are useful characterizations of a large intermediate prominence. However, the quantitative claim of 'pinpointing' the farside locations currently lacks explicit uncertainty quantification and sensitivity testing, which is the main factor preventing the results from being fully conclusive.
major comments (3)
- [Section 3.2, Table 3] Uncertainties are reported only for h and h_LE, while no uncertainties or sensitivity ranges are given for the fitted GCS parameters phi, theta, gamma, alpha, and kappa, and hence none for the derived source region (110E, 43N) or the second footpoint (162E, 44N). Because the GCS fits are manual (Figures 9 and 11), the 'pinpointed' claim in the abstract and conclusion needs a quantitative robustness test, such as an exploration of initial-guess sensitivity or a reporting of the spread of phi, theta, and gamma across the 16 fitted moments. Without that, the farside footpoint coordinates should be presented as approximate rather than pinpointed.
- [Section 4.2 and Figures 9-12] The GCS model assumes two coplanar legs, radial propagation, and no deflection, while the observations show a rotating southeast leg (Figure 5), a cusp at the apex after about 04:04 UT, and a drifting northwest leg after 04:30 UT. The fits are nevertheless extended through 04:04-04:25 UT (Figure 11), and the paper states that the modeling is 'acceptable,' despite the change in morphology. Given that STA and SolO are within 28 degrees of the Sun-Earth line (Table 1), the depth sensitivity is weak, and a small deviation from coplanarity could shift the extrapolated footpoint by tens of degrees. The authors should quantify this sensitivity, for example, by varying the leg geometry or the tilt angle within plausible ranges and showing the resulting spread in FP2 coordinates, or by explicitly discussing why the cusp phase does not bias the earlier fits.
- [Section 3.2, Equations (1)-(3)] The true speed range (610-849 km/s) is derived from the GCS-tracked leading-edge height h_LE(t), but the paper does not propagate the uncertainties in the GCS model parameters into the height or the resulting speed and acceleration. Since the deprojection depends sensitively on the assumed direction of propagation, any bias in phi, theta, or gamma directly affects the 'true' speed. The authors should provide a sensitivity analysis, for instance, by repeating the height-time and speed calculations with GCS parameters perturbed by a few degrees, and report the resulting range in v_LE.
minor comments (5)
- [Abstract and Section 5] The claim 'For the first time, we apply the GCS modeling in 3D reconstruction and tracking of the prominence for nearly two hours' should be qualified because Zhou et al. (2023) already applied GCS to a behind-the-limb prominence and derived its source region; the novelty here could be phrased as the first continuous GCS tracking of a prominence over such a long interval, rather than a blanket 'first time' statement.
- [Table 3] The origin of the reported uncertainties in h and h_LE is not described; a sentence in Section 3.2 explaining how the error bars were estimated (e.g., from manual fitting variability or pixel scales) would improve reproducibility.
- [Section 3.2] The text uses both Carrington longitude phi (-110 degrees) and heliographic longitude ('110E') for the source region; the relation between these two notations should be clarified to avoid confusion, especially because the farside footpoint is reported as '162E, 44N' while the GCS phi is not given in the same form.
- [Section 4.2, Figure 13] The PFSS comparison is described as 'roughly consistent' between the PIL and the FP1-FP2 connection, but because the farside magnetogram is unavailable and the PFSS is only a potential-field approximation, this should be stated as a weak consistency check rather than as confirmation of the GCS result.
- [Section 4.1] The kink-instability conclusion is based on qualitative morphology (rotation, cusp, drifting leg) and the authors properly note that the total twist could not be measured; it would be helpful to explicitly list which alternative triggers (flux emergence or torus instability) are least constrained by the present data, to guide the reader on the confidence level of the 'most likely' attribution.
Circularity Check
No circularity: the GCS reconstruction is a standard forward-model fit to observations, not a derivation assuming its conclusion.
full rationale
The paper's central claim is that a standard Graduated Cylindrical Shell (GCS) model, fit to multiview EUV and Ly-alpha images, reconstructs the eruptive prominence and yields the source region (110E, 43N) and northwest footpoint (162E, 44N). This is a forward-modeling/inversion procedure: the GCS parameters (phi, theta, gamma, alpha, delta, kappa, h) are adjusted so that model projections match the observed prominence threads, and the reported coordinates are expressions of those fitted parameters. The GCS model itself is taken from independent, external prior work (Thernisien et al. 2006, 2009, 2011), and the paper does not redefine GCS in terms of its own results. No equation in the manuscript defines a fitted quantity in terms of the claimed conclusion, and no parameter is fit to a subset of data and then 'predicted' for a closely related quantity. The authors' self-citations concern a revised cone model, a modified GCS model, and coordinate-transform details, but the paper explicitly uses the standard GCS model, so these citations are not load-bearing for the central claim. The acknowledged limitations—purely geometric model, no farside LOS magnetograms, unsuitable GCS fits after 04:30 UT, and narrow (<28 deg) viewing baseline—are assumptions and uncertainty sources, not circular reasoning. The skeptical concern about the extrapolated farside footpoint being sensitive to the coplanar, radial-propagation assumption is a correctness/robustness risk, not a circularity. Therefore no significant circularity is present.
Assumptions & free parameters
free parameters (3)
- GCS model parameters (h, alpha, delta, kappa, phi, theta, gamma) =
alpha=40 deg, delta=3 deg, kappa=0.05, phi=-110 deg, theta=40-43 deg, gamma=70 deg; h from 388.8 to 702.0 Mm
- Cubic polynomial coefficients c0-c3 for hLE(t) in Equation (2) =
Not reported numerically; shown only as fitted curves in Figure 12
- Quadratic height-time fit coefficient (CME acceleration) =
9.35 m/s^2
assumptions (4)
- domain assumption The prominence can be represented by the standard GCS geometrical model: two coplanar conical legs and a circular cross-section.
- domain assumption Radial propagation of the prominence and CME with no deflection.
- domain assumption The prominence is adequately observed as a bright feature in EUV and Ly-alpha images from multiple viewpoints, and the same physical structure is identified across instruments.
- domain assumption The PFSS model provides a reasonable approximation of the coronal magnetic field for comparing the reconstructed footpoints with a polarity inversion line.
Cite this review
Pith. "Pith review of Tracking an eruptive intermediate prominence originating from the farside of the Sun." pith.science (2026). https://pith.science/paper/VBZEU7NE
@misc{pith2026250501684,
  author       = {Pith},
  title        = {Pith review of: Tracking an eruptive intermediate prominence originating from the farside of the Sun},
  year         = {2026},
  howpublished = {\url{https://pith.science/paper/VBZEU7NE}},
  note         = {Machine review of arXiv:2505.01684}
}
abstract
In this paper, we carry out multiwavelength and multiview observations of the eruption of an intermediate prominence originating from the farside of the Sun on 2023 March 12. The southeast footpoint of the prominence is located in active region (AR) 13252. The eruption generates a B7.8 class flare and a partial halo coronal mass ejection (CME). The prominence takes off at 02:00 UT and accelerates for nearly three hours. Rotation of the southeast leg of the prominence in the counterclockwise direction is revealed by spectroscopic and imaging observations. The apex of the prominence changes from a smooth loop to a cusp structure during the rising motion and the northwest leg displays a drift motion after 04:30 UT, implying a writhing motion. Hence, the prominence eruption is most likely triggered by ideal kink instability. For the first time, we apply the Graduated Cylindrical Shell (GCS) modeling in three-dimensional reconstruction and tracking of the prominence for nearly two hours. Both the source region (110$\degr$E, 43$\degr$N) and northwest footpoint (162$\degr$E, 44$\degr$N) are located. The edge-on and face-on angular widths of the prominence are $\sim$6$\degr$ and $\sim$86$\degr$, respectively. The axis has a tilt angle of $\sim$70$\degr$ with the meridian. The heliocentric distance of the prominence leading edge increases from $\sim$1.26\,$R_{\sun}$ to $\sim$2.27\,$R_{\sun}$. The true speed of the CME increases from $\sim$610 to $\sim$849 km s$^{-1}$.
Figures


Figures from the paper (7 more)




Reference graph
Works this paper leans on
-
[5]
doi:10.1007/s11214-007-9277-0 Kliem, B., Titov, V . S., & T¨ or¨ ok, T. 2004, A&A, 413, L23. doi:10.1051/0004-6361:20031690 Kliem, B. & T¨ or¨ ok, T. 2006, PhRvL, 96, 255002. doi:10.1103/PhysRevLett.96.255002 Kumar, P ., Cho, K.-S., Bong, S.-C., et al. 2012, ApJ, Initiat ion of Coronal Mass Ejection and Associated Flare Caused by Helica l Kink Instability...
-
[11]
doi:10.1007/s11207-012-0084-8 Wang, J., Yan, X., Guo, Q., et al. 2019, MNRAS, 488, 3794. doi:10.1093/mnras/stz1935 Wedemeyer-B¨ ohm, S., Scullion, E., Steiner, O., et al. 2012, Nature, 486, 505. doi:10.1038/nature11202 Wei, H., Huang, Z., Zhang, Q., et al. 2024, SoPh, 299, 64. doi:10.1007/s11207-024-02306-x Witasse, O., S´ anchez-Cano, B., Mays, M. L., et...
-
[57]
doi:10.1007/s11207-009-9363-4 Lin, J. & Forbes, T. G. 2000, J. Geophys. Res., 105, 2375. doi:10.1029/1999JA900477 Liu, R., Alexander, D., & Gilbert, H. R. 2007, ApJ, 661, 1260. doi:10.1086/513269 Liu, Z., Xu, J., Gu, B.-Z., et al. 2014, Research in Astronomy and Astrophysics, 14, 705-718. doi:10.1088 /1674-4527/14/6/009 Luna, M., Karpen, J., Ballester, J....
-
[98]
doi:10.3847/1538-4357/aa9ffc Xing, C., Aulanier, G., Cheng, X., et al. 2024, ApJ, Unveilin g the Initiation Route of Coronal Mass Ejections through Their Sl ow Rise Phase, 966, 1, 70. doi:10.3847 /1538-4357/ad2ea9 Yan, X. L., Xue, Z. K., Liu, J. H., et al. 2014a, ApJ, 782, 67. doi:10.1088/0004-637X/782/2/67 Yan, X. L., Xue, Z. K., Liu, J. H., et al. 2014b,...
-
[111]
doi:10.1007/s11207-009-9346-5 Thernisien, A. 2011, ApJS, 194, 33. doi:10.1088/0067-0049/194/2/33 Thompson, W. T. 2011, Journal of Atmospheric and Solar-Terrestrial Physics, 73, 1138. doi:10.1016/j.jastp.2010.07.005 Thompson, W. T., Kliem, B., & T¨ or¨ ok, T. 2012, SoPh, 276, 241. doi:10.1007/s11207-011-9868-5 T¨ or¨ ok, T., Kliem, B., & Titov, V . S. 2004...
-
[140]
doi:10.3847/1538-4357/ad206d Zhang, J., Guo, J., Zhang, Y ., et al. 2024d, Geophys. Res. Let t., 51, e2024GL111775. doi:10.1029/2024GL111775 Zhao, X., Xia, C., Keppens, R., et al. 2017, ApJ, 841, 106. doi:10.3847/1538-4357/aa7142 Zhong, Z., Guo, Y ., & Ding, M. D. 2021, Nature Communications , The role of non-axisymmetry of magnetic flux rope in constraini...
-
[150]
doi:10.3847/1538-4357/ace420 Sahade, A., V ourlidas, A., & Mac Cormack, C. 2025, ApJ, 978, 4 1. doi:10.3847/1538-4357/ad96ba Schatten, K. H., Wilcox, J. M., & Ness, N. F. 1969, SoPh, 6, 442 . doi:10.1007/BF00146478 Scherrer, P . H., Schou, J., Bush, R. I., et al. 2012, SoPh, 275 , 207. doi:10.1007/s11207-011-9834-2 Schmieder, B., D´ emoulin, P ., & Aulani...
-
[179]
doi:10.3847/1538-4357/ad8354 Shen, Y ., Liu, Y ., & Su, J. 2012, ApJ, 750, 12. doi:10.1088/0004-637X/750/1/12 Song, H., Li, L., & Chen, Y . 2022, ApJ, 933, 68. doi:10.3847/1538-4357/ac7239 Song, Y ., Ning, Z., Li, D., et al. 2024, ApJ, 975, 280. doi:10.3847/1538-4357/ad813c Sterling, A. C., Moore, R. L., Falconer, D. A., et al. 2015, Na ture, 523, 437. do...
Show all 14 references
-
[275]
2006, , Stereoscopy basics for the STEREO missi on, astro-ph/0612649
doi:10.1029/JA090iA01p00275 Inhester, B. 2006, , Stereoscopy basics for the STEREO missi on, astro-ph/0612649. doi:10.48550/arXiv.astro-ph/0612649 Isavnin, A. 2016, ApJ, 833, 267. doi:10.3847 /1538-4357/833/2/267 Isenberg, P . A. & Forbes, T. G. 2007, ApJ, 670, 1453. doi:10.10...
-
[503]
2015, ApJ, Circumsolar Energetic Particle Distribution on 2011 Novem ber 3, 799, 1, 55
doi:10.1086/309030 G´ omez-Herrero, R., Dresing, N., Klassen, A., et al. 2015, ApJ, Circumsolar Energetic Particle Distribution on 2011 Novem ber 3, 799, 1, 55. doi:10.1088 /0004-637X/799/1/55 Gopalswamy, N., M¨ akel¨ a, P ., Yashiro, S., et al. 2018, ApJL, Interplanetary Type...
2015
-
[833]
2018, Space Weather, 16, 216
doi:10.1086/320559 M¨ ostl, C., Amerstorfer, T., Palmerio, E., et al. 2018, Space Weather, 16, 216. doi:10.1002/2017SW001735 M¨ uller, D., St. Cyr, O. C., Zouganelis, I., et al. 2020, A&A, 642, A1. doi:10.1051/0004-6361/202038467 Ning, Z., Cao, W., Okamoto, T. J., et al. 2009,...
2018 doi
-
[1577]
doi:10.1126/science.1145447 Palmerio, E., Kilpua, E. K. J., M¨ ostl, C., et al. 2018, Space Weather, 16, 442. doi:10.1002/2017SW001767 Palmerio, E., Carcaboso, F., Khoo, L. Y ., et al. 2024, ApJ, On the Mesoscale Structure of Coronal Mass Ejections at Mercury’s Orbit: BepiColo...
2018 doi
-
[3255]
2024b, ApJ, 977, 4
doi:10.1093/mnras/stae1936 Zhang, Q., Ou, Y ., Huang, Z., et al. 2024b, ApJ, 977, 4. doi:10.3847/1538-4357/ad8bad Zhang, Y ., Zhang, Q., Song, D.-. chao ., et al. 2024c, ApJ, 963 ,
-
[9198]
doi:10.1038/s41467-024-53538-1 Thernisien, A. F. R., Howard, R. A., & V ourlidas, A. 2006, ApJ , 652, 763. doi:10.1086/508254 Thernisien, A., V ourlidas, A., & Howard, R. A. 2009, SoPh, 25 6,
2006 doi
Reviewed August 16, 2026 · model on record in the stance chip above.
Discussion (0). Continue with ORCID to comment.