REVIEW 3 major objections 6 minor 46 references
Massive Acquisition of Ultraviolet Color Excess Information from GALEX and UVOT Bands
T0 review · 3 major / 6 minor · reviewed 2026-08-15 · deepseek-v4-flash
Pith's one-line read The authors derive ultraviolet color excesses for 11.6 million stars and find that the extinction parameter R_V from the ultraviolet disagrees with infrared-optical maps, evidence against a one-parameter dust law.
desk verdict A genuinely useful, much larger UV color-excess catalog, but the headline claim that a single-parameter RV law fails is not yet supported by the calibration. read the letter →
The pith
A machine-rendered reading of the paper's core claim, the machinery that carries it, and where it could break.
The reading
What carries the argument
The load-bearing machinery is the blue-edge method as a zero-extinction selector, coupled to a random forest regression as an interpolator. For every narrow bin of stellar parameters (100 K in $T_\mathrm{eff}$, 0.1 dex in [Fe/H], 0.5 dex in $\log g$), the bluest 5% of stars after 3-$\sigma$ clipping in the optical bands are declared zero- or low-extinction sources; the median ultraviolet color of those stars in each bin is the representative intrinsic color, and the random forest smooths these representatives into a continuous function of the three parameters. Color excess is then the observed ultraviolet color minus the predicted intrinsic color, and the excesses are gridded into HEALPix extinction maps. The same color-excess ratios feed a forward model that, after correcting for effective-wavelength shifts, matches observed ratios against a standard extinction curve (the F99 law) on a grid of $R_V$ values to assign each star an $R_V$.
What would settle it
Compare the calibration's zero point against an independent dust-free sample: take stars in high-latitude sightlines with negligible dust column (e.g., confirmed by very low far-infrared dust emission) and check whether their derived ultraviolet color excesses scatter around zero; a systematic positive offset would show the bluest-5% samples are still reddened. A sharper test targets the $R_V$ claim: toward a set of well-studied clouds where the extinction curve has been measured directly from paired spectra of reddened and unreddened stars, the paper's ultraviolet color excesses predict an $R_V$ that should either agree or disagree with the infrared-optical value; the FUV band, whose intrinsic colors show a 0.33 mag median offset from stellar models, is the most sensitive place to look for this discrepancy.
Extended reading notes
Core claim
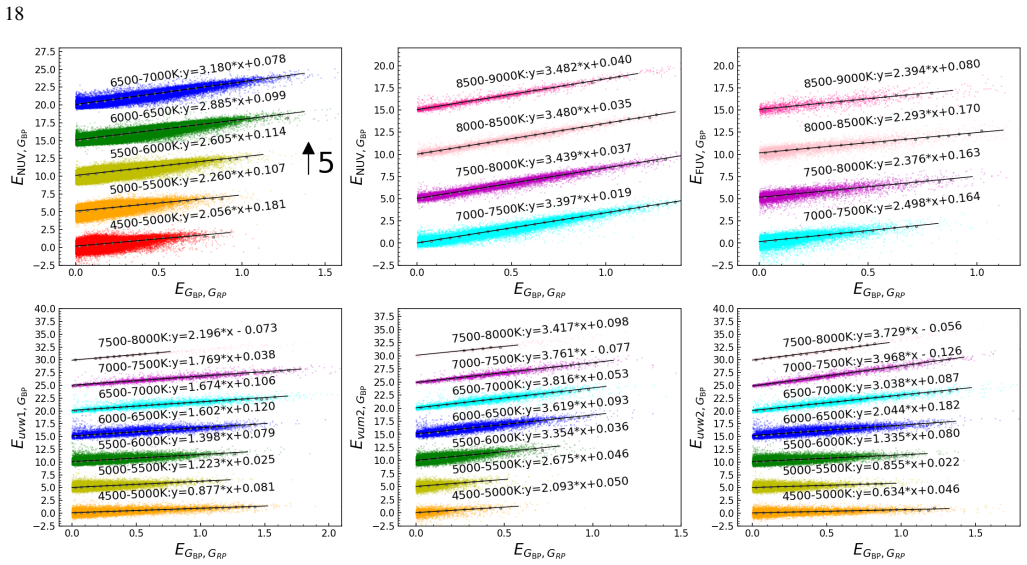
The central discovery, stated on the paper's own terms, is a calibration that makes ultraviolet extinction measurable at scale: an empirical mapping from stellar parameters ($T_\mathrm{eff}$, [Fe/H], $\log g$) to intrinsic ultraviolet color indices, built with the blue-edge method and random forest regression, that converts the overlap between Gaia XP stellar parameters and GALEX/UVOT photometry into a tenfold-larger ultraviolet color-excess catalog. Subtracting predicted intrinsic colors from observed colors yields $E_{\mathrm{NUV},G_\mathrm{BP}}$ for 11,624,802 stars, $E_{\mathrm{FUV},G_\mathrm{BP}}$ for 65,531 stars, and $E_{\mathrm{uvw1},G_\mathrm{BP}}$, $E_{\mathrm{uvm2},G_\mathrm{BP}}$, $E_{\mathrm{uvw2},G_\mathrm{BP}}$ for 336,633, 137,739, and 253,271 stars, with typical uncertainties of 0.21, 0.30, 0.19, 0.24, and 0.21 mag, and from these it builds HEALPix extinction maps whose near-UV version covers about two-thirds of the sky. The decisive result is the $R_V$ comparison: fitting each star's ultraviolet-to-optical color-excess ratios against a standard extinction curve on a grid of $R_V$ values gives a sky map of $R_V$ that differs noticeably from, and in places anti-correlates with, the $R_V$ maps built from infrared and optical data in previous work, while a control $R_V$ map derived from infrared and optical bands with the same pipeline reproduces those maps. The paper reads that split as evidence that a single-parameter $R_V$ extinction law cannot simultaneously describe the infrared, optical, and ultraviolet extinction behavior.
Load-bearing premise
Everything downstream rests on the blue-edge premise: within every narrow box of temperature, metallicity, and gravity, the bluest 5% of stars (after optical 3-$\sigma$ clipping) are genuinely almost dust-free, so their median color is the true intrinsic color; if any box's bluest stars are still reddened, or are biased by chromospheric activity or ultraviolet variability, the intrinsic colors shift and every color excess, map, and $R_V$ value inherits a systematic offset.
Editorial extensions
If this is right
- The near-UV color-excess catalog (~11.6 million stars) and the two-thirds-sky NUV extinction map become a reference resource for correcting ultraviolet photometry and for tracing dust at high Galactic latitudes, where ultraviolet extinction is several times more sensitive than optical.
- The UVOT-band color excesses ($uvw1$, $uvm2$, $uvw2$) extend extinction measurements across the 2175 Å feature, so the catalog can constrain variations in the ultraviolet bump, not just the far-ultraviolet rise.
- If the $R_V$ disagreement is real, then converting infrared-optical $R_V$ maps into ultraviolet extinction corrections will systematically misestimate ultraviolet reddening, and multi-parameter extinction laws will be required for any analysis spanning UV-to-IR observations.
- Because the intrinsic-color calibration now includes giants and stars down to 4500 K in the near-UV, the same pipeline can be reapplied as new photometric surveys appear, with the per-bin blue-edge threshold acting as the main dial between sample size and zero-point fidelity.
Reading between the lines
- Beyond the paper: the anti-correlation between ultraviolet-based and infrared-optical $R_V$ admits a second reading the paper does not fully exclude — that the ultraviolet intrinsic-color zero point drifts with stellar parameters in ways the blue-edge method cannot see; re-deriving the $R_V$ map with the random forest trained only on stars in nearly dust-free high-latitude fields would separate du
- Beyond the paper: because FUV shows the largest model offsets (0.33 mag median versus PARSEC) and is the most extinction-sensitive band, the FUV link in the $R_V$ chain is the most fragile; a small systematic there would propagate directly into the reported disagreement, so the FUV color-excess subsample is the natural first target for external validation.
- Beyond the paper: the same pipeline applied to future ultraviolet surveys could produce all-sky ultraviolet extinction maps, and the comparison of the UV-based $R_V$ map with spectroscopically measured extinction curves toward individual clouds would give a direct, model-independent test of whether the dust law really needs more than one parameter.
Signed reviews
Editorial analysis
A structured set of objections, weighed in public.
Referee Report
Summary. This manuscript presents a large ultraviolet color-excess catalog for the GALEX NUV/FUV and Swift/UVOT uvw1, uvm2, and uvw2 bands. Using stellar parameters from LAMOST, GALAH, APOGEE, and Zhang et al. (2023) XP-spectra catalog, the authors apply the blue-edge method to define intrinsic UV colors as functions of Teff, [Fe/H], and log g, then derive color excesses for 11.6 million NUV, 65,531 FUV, and 336,633/137,739/253,271 UVOT sources. They construct HEALPix extinction maps, compare them with Green et al. (2019) and Sun et al. (2021a), and finally derive an R_V map from UV/optical color-excess ratios. The resulting R_V distribution shows noticeable differences and even anti-correlations with infrared/optical R_V maps (ZYC23, ZG25), leading to the conclusion that a single-parameter R_V extinction law is insufficient across IR/optical/UV.
Significance. If the catalog and R_V conclusion hold, this is a substantial community resource: the NUV color-excess sample is nearly an order of magnitude larger than Sun et al. (2021a), the UV extinction maps cover large sky fractions, and the cross-survey comparisons (Figures 7 and 9) and optical comparison with Green et al. (2019) (Figure 8) indicate good internal consistency and precision. The machine-readable catalog and maps are likely to be useful for many extinction-law and dust studies. However, the headline physical conclusion about the failure of a single-parameter R_V law rests on the blue-edge zero point of the intrinsic UV colors, which is a shared assumption for every derived color excess and R_V value. The manuscript's own validation shows a 0.33 mag median FUV offset against PARSEC and systematic cool-star residuals in all UV bands, so the R_V anti-correlation is not yet demonstrated to be physical rather than a calibration artifact.
major comments (3)
- [Section 3.1 and Section 3.3] The blue-edge zero point is the single shared anchor for all color excesses and for the R_V map in Section 5.2. Because Sun et al. (2021a) uses the same method, the agreement with S21 in Section 4.3 (median differences ~0.02 mag) does not validate the absolute zero point. Section 3.3 reports a 0.33 mag median offset between the derived FUV intrinsic colors and PARSEC, and Figures 4 and 5 show large cool-star residuals in all UV bands. At the E(B-V) > 0.1 mag threshold used to construct the R_V map, a 0.1-0.3 mag zero-point error is of the same order as the signal and can invert the fitted UV/optical color-excess ratio, plausibly producing the anti-correlation in Figure 18. Please demonstrate that the R_V anti-correlation survives plausible zero-point corrections, for example by recalibrating the intrinsic colors to PARSEC or to a sample with independently confirmed low extinction, and by propagating the PARSEC residual dispersions into the R_V fits.
- [Section 5.2 and Figure 18] The anti-correlation between the UV-based R_V and the ZYC23/ZG25 R_V maps is the sole evidence for the conclusion that a single-parameter R_V extinction law is insufficient. The manuscript does not provide a statistical significance test of this anti-correlation, nor a null test. Please add, e.g., a Spearman rank correlation coefficient with uncertainty, and a perturbation test in which a constant or Teff-dependent offset is added to the UV color excess and the R_V fit is repeated. If the anti-correlation is robust to such perturbations, the conclusion is supported; if it disappears, it is likely a calibration artifact. In addition, report the E(B-V) and distance distributions of the cross-matched samples used for Figure 17 to rule out selection effects from the photometric-depth differences between UV and IR/optical surveys.
- [Section 3.3 and Figures 4-5] The PARSEC comparison shows a systematic Teff-dependent trend in all UV bands, with PARSEC being noticeably redder for cooler stars (larger C0) and with the largest discrepancy in the FUV band. Because the R_V analysis in Section 5.2 is binned by Teff and uses color-excess ratios, a Teff-dependent zero-point error will map into a spatial pattern of R_V whenever the stellar population or the extinction distribution varies spatially. The manuscript reports dispersions but does not quantify how these residuals propagate into the derived CERs and R_V maps. Please either apply a Teff-dependent correction to the intrinsic colors based on the PARSEC comparison, or model the propagation of these residuals into the R_V values and show that the Section 5.2 anti-correlation remains significant after this propagation.
minor comments (6)
- [Figure 2 caption] The label 'wum2' in the middle-right panel should be 'uvm2'.
- [Figure 17 caption] The caption refers to 'ZG24' but the paper cites Zhang & Green (2025) as ZG25; please correct the citation to avoid confusion.
- [Section 5.1] The term 'CECE diagram' is undefined; please write 'color excess–color excess diagram' on first use.
- [Section 2.3 and Section 4.1] Please clarify why the final selected combined catalogs have 93,230,392 sources in the GBP/GRP band (Section 2.3) while Section 4.1 reports 92,142,820 values of EGBP,GRP; the difference is not explained.
- [Acknowledgements] The acknowledgements thank the referee, which is unconventional in a submitted manuscript; this sentence should be removed.
- [Abstract] The phrase 'tenfold increase from previous results' refers to Sun et al. (2021a); please name the baseline explicitly in the abstract for clarity.
Circularity Check
No significant circularity: the blue-edge zero point is an explicit calibration anchor, and the R_V anti-correlation is a falsifiable empirical comparison.
full rationale
The paper's derivation chain is transparent. Section 3.1 defines the intrinsic UV color for each Teff/[Fe/H]/log g bin as the median color of the bluest 5% of stars selected by optical GBP-GRP after 3-sigma clipping. Color excesses are then computed as observed minus this model (Section 4.1). This is an explicit zero-point assumption common to blue-edge reddening measurements, not a hidden identity or a fitted parameter renamed as a prediction: the catalog does not 'predict' the zero point from the excesses, and the excesses are not used to define the intrinsic colors. The paper checks the intrinsic-color model against independent PARSEC synthetic colors and the optical excesses against G19 reddening (Sections 3.3 and 4.3), and the agreement with S21 is a consistency check rather than the argument's load-bearing premise. In Section 5.2, the UV-based R_V map is obtained by forward-fitting observed UV/optical color-excess ratios to an F99 grid and then compared with the independent ZYC23 and ZG25 maps; the second-panel IR/optical control map from the same stars shows that the UV discrepancy is not a trivial artifact of sample selection. Thus the central claims do not reduce by construction to their inputs. Remaining worries about the blue-edge anchor, such as the 0.33 mag FUV residual, are calibration-validation concerns rather than circularity.
Assumptions & free parameters
free parameters (5)
- Blue-edge percentile =
5% bluest stars after 3-sigma clipping
- Parameter bin widths =
100 K, 0.1 dex, 0.5 dex
- Teff selection cuts =
>4500 K for NUV and UVOT bands; >7000 K for FUV
- Photometric and confidence cuts =
UV errors < 0.30 mag; Gaia GBP/GRP < 0.02 mag; Z23 confidence > 0.5; NUV > 13.85 mag; FUV > 13.73 mag
- R_V fitting grid and E(B-V) threshold =
F99 extinction curve on an R_V grid; E(B-V) > 0.1 mag
assumptions (5)
- domain assumption Blue-edge axiom: the bluest 5% of stars in each Teff-[Fe/H]-logg bin are truly zero or low extinction.
- domain assumption Optical-selected blue-edge stars are also unreddened in the ultraviolet bands.
- domain assumption Random forest regression on per-bin median intrinsic colors recovers the true intrinsic-color relation.
- domain assumption The F99 extinction law with an R_V grid and effective-wavelength correction adequately models ultraviolet and optical color-excess ratios.
- domain assumption PARSEC synthetic colors are accurate enough to validate intrinsic ultraviolet colors.
Cite this review
Pith. "Pith review of Massive Acquisition of Ultraviolet Color Excess Information from GALEX and UVOT Bands." pith.science (2026). https://pith.science/paper/ZSTXBTE6
@misc{pith2026250503549,
  author       = {Pith},
  title        = {Pith review of: Massive Acquisition of Ultraviolet Color Excess Information from GALEX and UVOT Bands},
  year         = {2026},
  howpublished = {\url{https://pith.science/paper/ZSTXBTE6}},
  note         = {Machine review of arXiv:2505.03549}
}
abstract
This study employs stellar parameters from spectroscopic surveys and Zhang et al. based on Gaia XP spectra, along with photometric data from GALEX, UVOT, and Gaia, to obtain extensive ultraviolet color excess information for the relevant bands of GALEX and UVOT. By considering the impact of stellar parameters (\teff, \feh, and \logg) on intrinsic color indices, and utilizing the blue-edge method combined with a random forest algorithm, an empirical relationship between stellar parameters and intrinsic ultraviolet color indices is established. By combining observed color indices, the study derives color excesses for 11,624,802 and 65,531 stars in the GALEX/near-UV and far-UV bands, and 336,633, 137,739, and 253,271 stars in the UVOT/\uvwa, \uvmb, and \uvwb\ bands, constructing corresponding ultraviolet extinction maps. Notably, the color excess data for the GALEX/near-UV band shows a tenfold increase from previous results, with the extinction map covering approximately two-thirds of the sky at a resolution of 0.4$^{\circ}$. The typical uncertainties in the ultraviolet color excesses are 0.21 mag, 0.30 mag, 0.19 mag, 0.24 mag, and 0.21 mag for \enb, \efb, \ewab, \embb, and \ewbb, respectively. By comparing the spatial distributions of \rv\ derived from ultraviolet and Gaia optical band measurements with those obtained from infrared and optical data in previous works, it is evident that the \rv\ distributions based on the ultraviolet data show noticeable differences, with some regions even exhibiting opposite trends. This suggests that a single-parameter \rv\ extinction law may not be sufficient to simultaneously characterize the extinction behavior across infrared, optical, and ultraviolet bands.
Figures


Figures from the paper (15 more)




Reference graph
Works this paper leans on
-
[1]
_> &ORvz ݽ' @ 4 Ou
thebibliography [1] 20pt to REFERENCES 6pt =0pt -12pt 10pt plus 3pt =0pt =0pt =1pt plus 1pt =0pt =0pt -12pt =13pt plus 1pt =20pt =13pt plus 1pt \@M =10000 =-1.0em =0pt =0pt 0pt =0pt =1.0em @enumiv\@empty 10000 10000 `\.\@m \@noitemerr \@latex@warning Empty `thebibliography' environment \@ifnextchar \@reference \@latexerr Missing key on reference command E...
2021
-
[2]
2022, , 259, 35, 10.3847/1538-4365/ac4414
Abdurro'uf , Accetta , K., Aerts , C., et al. 2022, , 259, 35, 10.3847/1538-4365/ac4414
-
[3]
2014, , 354, 103, 10.1007/s10509-014-1935-6
Bianchi , L. 2014, , 354, 103, 10.1007/s10509-014-1935-6
-
[4]
Bianchi, L. 2020, GALEX UV Unique Source Catalogs (``GUVcat'') and Cross-Matches With Gaia and SDSS (``GUVmatch''), STScI/MAST, 10.17909/T9-PYXY-KG53
-
[5]
2017, , 230, 24, 10.3847/1538-4365/aa7053
Bianchi , L., Shiao , B., & Thilker , D. 2017, , 230, 24, 10.3847/1538-4365/aa7053
-
[6]
2012, , 427, 127, 10.1111/j.1365-2966.2012.21948.x
Bressan , A., Marigo , P., Girardi , L., et al. 2012, , 427, 127, 10.1111/j.1365-2966.2012.21948.x
arXiv 2012
-
[7]
2021, , 506, 150, 10.1093/mnras/stab1242
Buder , S., Sharma , S., Kos , J., et al. 2021, , 506, 150, 10.1093/mnras/stab1242
-
[8]
1978, , 225, 40, 10.1086/156466
Burstein , D., & Heiles , C. 1978, , 225, 40, 10.1086/156466
doi:10.1086/156466 1978
Show all 46 references
- [9]
-
[10]
A., Clayton , G
Cardelli , J. A., Clayton , G. C., & Mathis , J. S. 1989, , 345, 245, 10.1086/167900
1989 doi
-
[11]
Q., Liu , X
Chen , B. Q., Liu , X. W., Yuan , H. B., et al. 2014, , 443, 1192, 10.1093/mnras/stu1192
2014 doi
-
[12]
Draine , B. T. 2003, , 598, 1017, 10.1086/379118
2003 doi
-
[13]
R., Bevilacqua , C
Ducati , J. R., Bevilacqua , C. M., Rembold , S. B., & Ribeiro , D. 2001, , 558, 309, 10.1086/322439
2001 doi
-
[14]
Fitzpatrick , E. L. 1999, , 111, 63, 10.1086/316293
1999 doi
-
[15]
2022, VizieR Online Data Catalog: Gaia DR3 Part 1
Gaia Collaboration . 2022, VizieR Online Data Catalog: Gaia DR3 Part 1. Main source (Gaia Collaboration, 2022) , VizieR On-line Data Catalog: I/355. Originally published in: Astron. Astrophys., in prep. (2022), 10.26093/cds/vizier.1355
2022 doi
-
[16]
Gaia Collaboration , Brown , A. G. A., Vallenari , A., et al. 2016, , 595, A2, 10.1051/0004-6361/201629512
2016 doi
-
[17]
2004, , 611, 1005, 10.1086/422091
Gehrels , N., Chincarini , G., Giommi , P., et al. 2004, , 611, 1005, 10.1086/422091
2004 doi
-
[18]
M., Hivon , E., Banday , A
G \'o rski , K. M., Hivon , E., Banday , A. J., et al. 2005, , 622, 759, 10.1086/427976
2005 doi
-
[19]
M., Schlafly , E., Zucker , C., Speagle , J
Green , G. M., Schlafly , E., Zucker , C., Speagle , J. S., & Finkbeiner , D. 2019, , 887, 93, 10.3847/1538-4357/ab5362
2019 doi
-
[20]
M., Schlafly , E
Green , G. M., Schlafly , E. F., Finkbeiner , D. P., et al. 2015, , 810, 25, 10.1088/0004-637X/810/1/25
2015 doi
-
[21]
L., Chen , B
Guo , H. L., Chen , B. Q., Yuan , H. B., et al. 2021, , 906, 47, 10.3847/1538-4357/abc68a
2021 doi
-
[22]
2017, , 153, 5, 10.3847/1538-3881/153/1/5
Jian , M., Gao , S., Zhao , H., & Jiang , B. 2017, , 153, 5, 10.3847/1538-3881/153/1/5
2017 doi
- [23]
-
[24]
2023, , 956, 26, 10.3847/1538-4357/aced8a
Li , L., Wang , S., Chen , X., & Jiang , Q. 2023, , 956, 26, 10.3847/1538-4357/aced8a
2023 doi
-
[25]
L., Zhao , Y.-H., Zhao , G., et al
Luo , A. L., Zhao , Y.-H., Zhao , G., et al. 2015, Research in Astronomy and Astrophysics, 15, 1095, 10.1088/1674-4527/15/8/002
2015 doi
-
[26]
Mathis , J. S. 1990, , 28, 37, 10.1146/annurev.aa.28.090190.000345
1990
-
[27]
O'Donnell , J. E. 1994, , 422, 158, 10.1086/173713
1994 doi
- [28]
-
[29]
Peek , J. E. G., & Graves , G. J. 2010, , 719, 415, 10.1088/0004-637X/719/1/415
2010 doi
-
[30]
Peek , J. E. G., & Schiminovich , D. 2013, , 771, 68, 10.1088/0004-637X/771/1/68
2013 doi
-
[31]
Roming , P. W. A., Kennedy , T. E., Mason , K. O., et al. 2005, , 120, 95, 10.1007/s11214-005-5095-4
2005 doi
-
[32]
F., Meisner , A
Schlafly , E. F., Meisner , A. M., Stutz , A. M., et al. 2016, , 821, 78, 10.3847/0004-637X/821/2/78
2016 doi
-
[33]
J., Finkbeiner , D
Schlegel , D. J., Finkbeiner , D. P., & Davis , M. 1998, , 500, 525, 10.1086/305772
1998 doi
-
[34]
1978, Physical processes in the interstellar medium , 10.1002/9783527617722
Spitzer , L. 1978, Physical processes in the interstellar medium , 10.1002/9783527617722
1978 doi
- [35]
-
[36]
2021 a , , 254, 38, 10.3847/1538-4365/abf929
Sun , M., Jiang , B., Yuan , H., & Li , J. 2021 a , , 254, 38, 10.3847/1538-4365/abf929
2021 doi
-
[37]
2021 b , , 256, 46, 10.3847/1538-4365/ac1601
Sun , M., Jiang , B., Zhao , H., & Ren , Y. 2021 b , , 256, 46, 10.3847/1538-4365/ac1601
2021 doi
-
[38]
W., Zhao , H., et al
Sun , M., Jiang , B. W., Zhao , H., et al. 2018, , 861, 153, 10.3847/1538-4357/aac776
2018 doi
-
[39]
2019, , 877, 116, 10.3847/1538-4357/ab1c61
Wang , S., & Chen , X. 2019, , 877, 116, 10.3847/1538-4357/ab1c61
2019 doi
-
[40]
Yershov , V. N. 2015, VizieR Online Data Catalog, II/339
2015
-
[41]
2023, , 525, 2701, 10.1093/mnras/stad2463
Yi , F., Haibo , Y., Ruoyi , Z., Jian , G., & Shuai , X. 2023, , 525, 2701, 10.1093/mnras/stad2463
2023 doi
-
[42]
2023a, , 264, 14, 10.3847/1538-4365/ac9dfa
Zhang , R., & Yuan , H. 2023a, , 264, 14, 10.3847/1538-4365/ac9dfa
-
[43]
2023b, , 269, 6, 10.3847/1538-4365/acf764
Zhang , R., Yuan , H., & Chen , B. 2023b, , 269, 6, 10.3847/1538-4365/acf764
-
[44]
Zhang , X., & Green , G. M. 2025, Science, 387, 1209, 10.1126/science.ado9787
2025 doi
-
[45]
M., & Rix , H.-W
Zhang , X., Green , G. M., & Rix , H.-W. 2023, , 524, 1855, 10.1093/mnras/stad1941
2023 doi
-
[46]
2012, Research in Astronomy and Astrophysics, 12, 723, 10.1088/1674-4527/12/7/002
Zhao , G., Zhao , Y.-H., Chu , Y.-Q., Jing , Y.-P., & Deng , L.-C. 2012, Research in Astronomy and Astrophysics, 12, 723, 10.1088/1674-4527/12/7/002
2012 doi
Reviewed August 15, 2026 · model on record in the stance chip above.
Discussion (0). Continue with ORCID to comment.