REVIEW 3 major objections 3 minor 71 references
Scalable Class-Centric Visual Interactive Labeling
T0 review · 3 major / 3 minor · reviewed 2026-08-15 · deepseek-v4-flash
Pith's one-line read This paper claims that data labeling becomes faster, more accurate, and more scalable when the task is inverted: instead of assigning one of many classes to each instance, the user focuses on a single class at a time and labels whole…
desk verdict A serious class-centric labeling workflow with a significant accuracy win in a small study, but the scalability proof and interface confound mean the efficiency claims get ahead of the evidence. read the letter →
The pith
A machine-rendered reading of the paper's core claim, the machinery that carries it, and where it could break.
The reading
What carries the argument
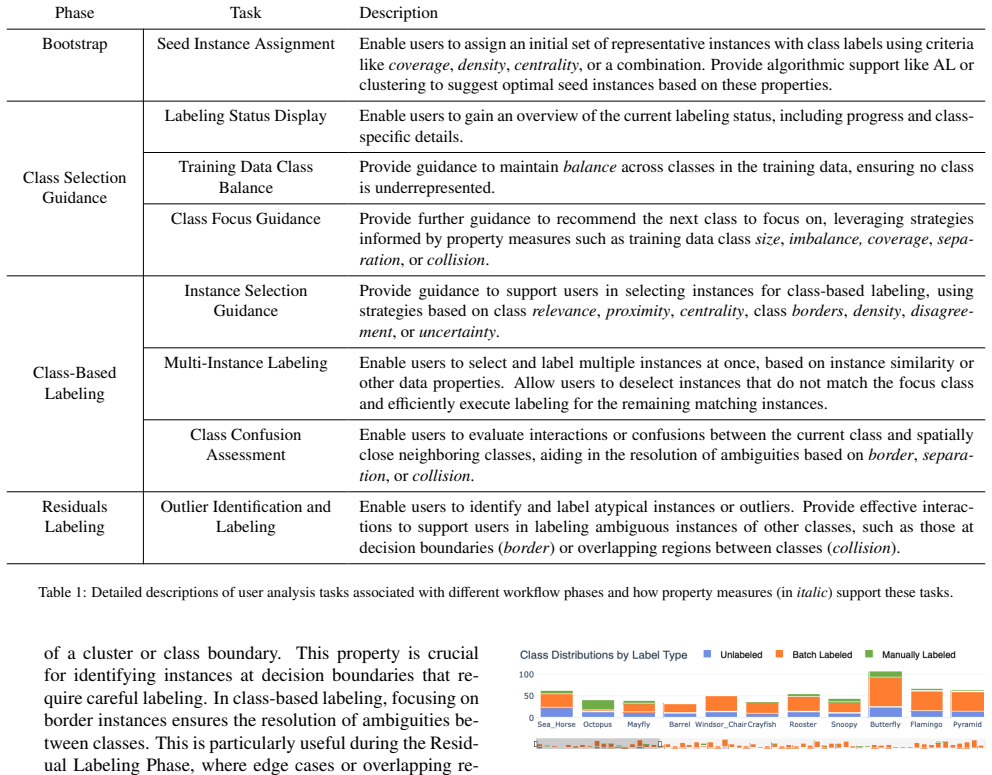
The central mechanism is the class-centric inversion of the labeling problem, turning a many-way class assignment into a binary membership decision per focus class. The argument is carried by the cVIL workflow: a Bootstrap phase seeds each class with at least one label; Class Selection Guidance uses property measures—quantities such as class size, imbalance, separation, collision, and uncertainty—to choose the next class to focus on; Class-Based Labeling lets users select a subset of instances predicted for that class and either confirm them all with a single click or remove false positives; and Residual Labeling switches back to instance-centric handling for outliers. The prototype interface makes this concrete through four linked views: a stacked class-label bar chart, a kernel density plot of a property measure for the focus class, a similarity scatterplot with adjustable class-rank cutoffs, and an instance labeling panel supporting batch, drag-and-drop, and per-instance actions.
What would settle it
Run a controlled comparison on a dataset with many classes (for example, 20 or more) using a deliberately weak classifier that produces poor predictions for most classes, and measure both final accuracy and the actual size of the batches users manage to confirm per class. If the median batchable fraction per class is far below 10% for a representative dataset, or if cVIL's accuracy advantage disappears in a many-class setting, the average-case O(n) claim would be falsified.
Extended reading notes
Core claim
On its own terms, the central discovery is that the labeling decision itself is the bottleneck, and it can be restructured: when users operate class-by-class, each labeling step is a binary check ('does this batch belong to the focus class?') instead of a multi-class choice, so effort depends on the number of instances per class rather than the product of instances and classes. The paper formalizes this as the cVIL workflow, whose core phases are Class Selection Guidance (which class to focus on next, informed by property measures such as class size, imbalance, collision, and uncertainty) and Class-Based Labeling (where users select and batch-label subsets of the instances predicted for the focus class, using a kernel density plot of a property measure to find prototypical samples and a similarity scatterplot to handle borderline cases). The interface replaces categorical color encoding—which fails above about a dozen classes—with a class bar chart that scales to hundreds of classes, and supports both batch and individual labeling in the same view. Evidence comes from a user study on two binary CelebA tasks, where all 15 analyzed participants achieved higher accuracy with cVIL (median 98.4% vs 96.05%), completion time and workload did not differ significantly, and 13 of 16 preferred cVIL; a walk-through on 100 Caltech-101 classes (6,198 instances) illustrates the multi-class scenario, with manual labels at 97% accuracy and batch labels at 96.1% after labeling nearly 90% of the data.
Load-bearing premise
The claimed efficiency gain assumes that for most classes the classifier's predictions are good enough that a user can select and confirm a large subset (the paper's example is 10% of a class) in a single batch, while an instance-centric user must re-examine a fixed fraction of the full dataset for every class; if per-class prediction quality is low, the advantage shrinks toward the same worst case as instance-centric labeling.
Editorial extensions
If this is right
- If cVIL's average-case complexity argument holds, labeling effort scales with the number of instances per class rather than the product of instances and classes, making datasets with dozens to hundreds of classes practical to label interactively.
- Higher label accuracy at equal or lower effort implies that downstream models trained on cVIL-labeled data should be more reliable, or require less human time to reach the same accuracy.
- Batch labeling shifts the human role from scrutinizing individual instances to verifying class-level predictions, which could change how annotation work is organized and how quality is audited.
- Class selection guidance based on imbalance and uncertainty could be combined with active learning strategies to focus human effort on the classes that most improve the model.
Reading between the lines
- An immediate testable extension: measure the 'batchable fraction'—the median share of a class's instances that a user can confirm in a single selection—for a given dataset and classifier; the paper's O(n) claim predicts this fraction is large, so a dataset where it is small for most classes would narrow cVIL's advantage.
- The binary decision structure suggests cVIL should generalize beyond images to text, audio, or tabular data as long as a class-level summary and a property ranking can be visualized; the paper only demonstrates the mechanism on images.
- The class-centric framing may also change model-training dynamics: because batch labels are confirmed in groups, the label noise structure differs from per-instance labeling, which could be exploited or accounted for in loss weighting—the paper already down-weights batch labels by a factor of 0.1, an implicit acknowledgment of this.
- A controlled comparison with many classes (not just binary) would test whether the accuracy advantage persists when class selection guidance becomes a real decision, since the study's quantitative evidence is limited to two classes per task.
Signed reviews
Editorial analysis
A structured set of objections, weighed in public.
Referee Report
Summary. The paper proposes a class-centric visual interactive labeling (cVIL) workflow, in which the user focuses on one class at a time and assigns instances to that class, contrasting with traditional instance-centric VIL (iVIL). The authors formalize the workflow, present a visual analytics interface with four linked views (Class Label View, Instance Property View, Instance Similarity View, Instance Labeling View), and evaluate it in two complementary settings: a within-subjects user study on binary CelebA classification with 15 participants, and a qualitative usage scenario on the Caltech-101 dataset with 100 classes. The user study reports a statistically significant improvement in final accuracy for cVIL (median 98.4% vs. 96.05%, t(14)=5.784, p<.001) and a preference by 13 of 16 participants, while completion time and workload differences were not significant. The paper claims that class-centric labeling reduces labeling effort and scales better than instance-centric labeling for large numbers of instances and classes.
Significance. If the claims are supported, the class-centric paradigm is a genuinely useful addition to visual interactive labeling: it converts the labeling decision from a multi-class choice to a binary membership decision and enables natural batch operations, which can reduce cognitive load and improve accuracy. The user study is a real, randomized within-subjects comparison and shows a large and statistically significant accuracy effect, with most participants preferring the cVIL interface. The qualitative walkthrough provides anecdotal evidence that the approach can be applied to a 100-class dataset. However, the theoretical scalability argument in Section 3.1 is not a derivation but an assumption-laden comparison, and the empirical evidence for many-class scalability is absent: the user study uses only two classes and the walkthrough reports no time or effort measurements. The paper's central claim of scalability for large class counts is therefore currently supported more by design narrative than by evidence, though the underlying idea and the reported single-task result remain promising.
major comments (3)
- [Section 3.1, average-case complexity] The O(n) vs. O(nm) average-case comparison is not derived from the class-centric model; it builds in the conclusion it claims to prove. Specifically, it assumes that a cVIL user can, for each focus class, examine O(nc) instances and batch-confirm 10% of the class in one action, while it assumes an iVIL user must re-scan 10% of the full dataset for each of the m classes. Both premises are arbitrary: an iVIL user can select spatially coherent clusters and label multiple classes in one interaction, and the walkthrough in Section 5.2 shows classes (Gerenuk, Butterfly) where cVIL collapses to instance labeling, which the analysis does not model. Because the user study uses only m=2 and the walkthrough reports no time or effort data, the many-class scalability claim is unsupported by both theory and measurement. Please either present the analysis as explicitly conditional on stated assumptions or remove the formal O() claims.
- [Section 5.1.1, participant exclusion] The post-hoc exclusion of one participant who 'mistakenly selected the wrong focus class for batch labeling' is not justified by a pre-registered or principled outlier criterion. This error is a realistic failure mode of the interface, and the argument that it 'cannot easily happen when following the full cVIL workflow' is contradicted by the fact that the interface in the study made it possible. Excluding this participant inflates the reported accuracy effect. Please report the statistical analysis with and without this participant, or justify the exclusion with an explicit, pre-defined rule for excluding user errors.
- [Section 5.1, interface confound] The cVIL and iVIL interfaces differ in several design dimensions simultaneously: cVIL uses a KDE plot with a min-margin property measure and class bars, while iVIL uses a t-SNE scatter plot with color-coded predicted classes. The observed accuracy difference and user preference could therefore be caused by the visualization idioms or the uncertainty guidance rather than by the class-centric paradigm itself. To support the paradigm-level claim, the study should compare cVIL with an instance-centric interface that shares the same property-view idiom, or the conclusions should be explicitly restricted to the concrete interface comparison. As written, the paper over-generalizes from a comparison of two specific interfaces.
minor comments (3)
- [Section 5.1.2, preference count] The text says 15 of 16 participants completed the study, but later reports '13 out of 16 participants expressed a preference for cVIL'; since one participant was excluded, this should be 13 of 15, or the discrepancy should be clarified.
- [Section 3.1, notation] The arrow notation n→S m is not defined precisely enough: the subscript S is used both as the selection set and as part of the arrow subscript, which makes the formalization hard to follow. Please use clearer notation for the sets that the user works with at each step.
- [Section 5.1.2, statistical reporting] The paper does not state which tests were used for the accuracy and time comparisons (paired t-test is implied but not named), and no effect sizes or confidence intervals are reported. Adding these would improve reproducibility and allow readers to judge the practical size of the accuracy benefit.
Circularity Check
The average-case complexity argument in §3.1 builds the cVIL scalability advantage into its assumptions; the many-class scalability claim is therefore partially circular, although the binary user study is independent.
-
self definitional
[Section 3.1, average-case complexity paragraph]
"Within each of the m classes, the user only has to consider a subset of the nc instances. This requires O(mnc). Since n = ncm this results in O(n) steps. In contrast, iVIL requires more effort in this scenario. It is reasonable to assume that the user needs to examine a small subset of the data (consider 10% of the full dataset or n/10 instances) ... This process must be repeated for each of the m classes, resulting in a total effort of O(m n/10) or O(n*m) to label the same 10% of the total number of samples."
The O(n) versus O(nm) comparison is not derived from measurements or from independently established search costs; it is built into the premises. The cVIL bound assumes the user's search is confined to each predicted class subset, so the total cost is sum_c n_c = n, while the iVIL bound assumes the user must rescan a fixed 10% of the full dataset for every one of the m classes, giving cost m*n. These two assumptions are exactly the search-scope reduction and per-class batch-selection advantage that the paper claims to establish. The conclusion that cVIL can increase labeling efficiency is therefore a restatement of the asymmetric model, not a derivation.
full rationale
We found one circular step. Section 3.1's 'average case' comparison defines cVIL's cost as O(sum_c n_c) = O(n) by assuming the user works only within predicted class subsets, and defines iVIL's cost as O(m*n) by assuming a full-dataset scan per class. Those assumptions are the very class-centric advantage the paper claims to establish, so the theoretical scalability result is self-definitional rather than derived. The paper is otherwise not circular: the user study is a genuine within-subjects comparison of cVIL and iVIL on a binary task, with independent accuracy, time, workload, and preference measurements; the accuracy improvement (median 98.4% vs 96.05%, p < .001) does not reduce to a fitted parameter or to the authors' prior work. The walkthrough with 100 classes is qualitative and explicitly notes cases where class-based batch labeling breaks down, which supports the conclusion that the class-number scalability claim rests mainly on the Section 3.1 model. Self-citations to [11] and [1] are contextual (prior prototype, property-measure taxonomy) and are not used as a uniqueness theorem or as a substitute for evidence, so they do not add circularity. Overall: one partial, construction-based circularity, giving a score of 6.
Assumptions & free parameters
free parameters (5)
- average-case per-class selection fraction =
10% (assumed)
- iVIL per-class search fraction =
10% (assumed)
- batch-label sample weight =
0.1
- classifier architecture =
two hidden layers of 50 and 20 neurons
- class-rank cutoff k =
user-configurable (k)
assumptions (5)
- domain assumption The classifier's predicted class partition is accurate enough that within-class subsets are mostly correct or correctable by the user.
- domain assumption A binary in-class / out-of-class decision imposes lower cognitive load than selecting among m classes.
- domain assumption DINO embeddings (and the resulting t-SNE projections) preserve enough instance similarity for users to select correct instances.
- domain assumption Users can reliably judge class membership from thumbnails in the Instance Labeling View.
- standard math Standard big-O arithmetic and the instance/class notation in Section 3.1 are valid for modeling labeling effort.
invented entities (2)
-
cVIL workflow
-
Class-rank cutoff interaction
Cite this review
Pith. "Pith review of Scalable Class-Centric Visual Interactive Labeling." pith.science (2026). https://pith.science/paper/RBOGGLCU
@misc{pith2026250503618,
  author       = {Pith},
  title        = {Pith review of: Scalable Class-Centric Visual Interactive Labeling},
  year         = {2026},
  howpublished = {\url{https://pith.science/paper/RBOGGLCU}},
  note         = {Machine review of arXiv:2505.03618}
}
read the original abstract
Large unlabeled datasets demand efficient and scalable data labeling solutions, in particular when the number of instances and classes is large. This leads to significant visual scalability challenges and imposes a high cognitive load on the users. Traditional instance-centric labeling methods, where (single) instances are labeled in each iteration struggle to scale effectively in these scenarios. To address these challenges, we introduce cVIL, a Class-Centric Visual Interactive Labeling methodology designed for interactive visual data labeling. By shifting the paradigm from assigning-classes-to-instances to assigning-instances-to-classes, cVIL reduces labeling effort and enhances efficiency for annotators working with large, complex and class-rich datasets. We propose a novel visual analytics labeling interface built on top of the conceptual cVIL workflow, enabling improved scalability over traditional visual labeling. In a user study, we demonstrate that cVIL can improve labeling efficiency and user satisfaction over instance-centric interfaces. The effectiveness of cVIL is further demonstrated through a usage scenario, showcasing its potential to alleviate cognitive load and support experts in managing extensive labeling tasks efficiently.
Figures


Figures from the paper (17 more)


Reference graph
Works this paper leans on
-
[1]
J. Bernard, M. Hutter, M. Sedlmair, M. Zeppelzauer, T. Munzner, A Taxonomy of Property Measures to Unify Active Learning and Human- centered Approaches to Data Labeling, ACM Trans. Interact. Intell. Syst. 11 (3–4) (Sep. 2021). doi:10.1145/3439333. URL https://doi.org/10.1145/3439333
doi:10.1145/3439333 2021
-
[2]
A. Abdelrazek, Y . Eid, E. Gawish, W. Medhat, A. Hassan, Topic modeling algorithms and applications: A survey, Information Systems 112 (2023) 102131. doi:https://doi.org/10.1016/j.is.2022.102131. URL https://www.sciencedirect.com/science/article/pii/ S0306437922001090
arXiv 2023
-
[3]
S. Kahl, T. Denton, H. Klinck, H. Reers, F. Cherutich, H. Glotin, H. Go ¨eau, W.-P. Vellinga, R. Planqu ´e, A. Joly, Overview of BirdCLEF 2023: Automated Bird Species Identification in Eastern Africa., in: CLEF (Working Notes), 2023, pp. 1934–1942
work page 2023
-
[4]
Settles, Active learning literature survey, Tech
B. Settles, Active learning literature survey, Tech. rep., University of Wisconsin-Madison Department of Computer Sciences (2009)
work page 2009
-
[5]
Y . Fu, X. Zhu, B. Li, A survey on instance selection for active learning, Knowledge and Information Systems 35 (2) (2013) 249–283. doi:10. 1007/s10115-012-0507-8 . URL https://doi.org/10.1007/s10115-012-0507-8
-
[6]
S. Amershi, M. Cakmak, W. B. Knox, T. Kulesza, Power to the People: The Role of Humans in Interactive Machine Learning, AI Magazine 35 (4) (2014) 105–120. doi:10.1609/aimag.v35i4.2513. URL https://ojs.aaai.org/aimagazine/index.php/ aimagazine/article/view/2513
-
[7]
J. Bernard, M. Hutter, M. Zeppelzauer, D. Fellner, M. Sedlmair, Com- paring Visual-Interactive Labeling with Active Learning: An Experimen- tal Study, IEEE Transactions on Visualization and Computer Graphics (TVCG) 24 (1) (2018) 298–308. doi:10.1109/TVCG.2017.2744818
arXiv 2018
-
[8]
Ware, Chapter Four - Color, in: C
C. Ware, Chapter Four - Color, in: C. Ware (Ed.), Information Visualiza- tion: Perception for Design (Third Edition), third edition Edition, Interac- tive Technologies, Morgan Kaufmann, Boston, 2013, pp. 95–138. doi: 14 https://doi.org/10.1016/B978-0-12-381464-7.00004-1 . URL https://www.sciencedirect.com/science/article/pii/ B9780123814647000041
Show all 71 references
-
[9]
Harrower, C
M. Harrower, C. A. B. and, ColorBrewer.org: An Online Tool for Select- ing Colour Schemes for Maps, The Cartographic Journal 40 (1) (2003) 27–37. arXiv:https://www.tandfonline.com/doi/pdf/10. 1179/000870403235002042, doi:10.1179/000870403235002042. URL https://www.tandfonline....
2003 doi
-
[10]
Caron, H
M. Caron, H. Touvron, I. Misra, H. Jegou, J. Mairal, P. Bojanowski, A. Joulin, Emerging Properties in Self-Supervised Vision Transformers, 2021 IEEE/CVF International Conference on Computer Vision (ICCV) (2021) 9630–9640doi:10.1109/ICCV48922.2021.00951
2021
-
[11]
M. Matt, M. Zeppelzauer, M. Waldner, cVIL: Class-Centric Visual In- teractive Labeling, in: EuroVis Workshop on Visual Analytics (Eu- roV A), The Eurographics Association, 2024. doi:10.2312/eurova. 20241113
2024 doi
-
[12]
Olsson, A literature survey of active machine learning in the context of natural language processing, Tech
F. Olsson, A literature survey of active machine learning in the context of natural language processing, Tech. rep., Swedish Institute of Computer Science (2009)
2009
-
[13]
D. Tuia, M. V olpi, L. Copa, M. Kanevski, J. Munoz-Mari, A Survey of Active Learning Algorithms for Supervised Remote Sensing Image Clas- sification, IEEE Journal of Selected Topics in Signal Processing 5 (3) (2011) 606–617. doi:10.1109/JSTSP.2011.2139193
2011
-
[14]
Wang, X.-S
M. Wang, X.-S. Hua, Active learning in multimedia annotation and re- trieval: A survey, ACM Trans. Intell. Syst. Technol. 2 (2) (Feb. 2011). doi:10.1145/1899412.1899414. URL https://doi.org/10.1145/1899412.1899414
2011
-
[15]
S. K. Card, J. D. Mackinlay, B. Shneiderman, Chapter 1: Information Visualization, in: S. K. Card, J. D. Mackinlay, B. Shneiderman (Eds.), Readings in Information Visualization: Using Vision to Think, Morgan Kaufmann, San Francisco, CA, USA, 1999, Ch. 10, pp. 1–34
1999
-
[16]
J. J. van Wijk, The value of visualization, in: VIS 05. IEEE Visualization, 2005., 2005, pp. 79–86. doi:10.1109/VISUAL.2005.1532781
2005
-
[17]
D. Keim, G. Andrienko, J.-D. Fekete, C. G ¨org, J. Kohlhammer, G. Melanc ¸on, Visual Analytics: Definition, Process, and Challenges, Springer Berlin Heidelberg, 2008, pp. 154–175. doi:10.1007/978- 3-540-70956-5\_7
2008 doi
-
[18]
M. Chen, A. Golan, What May Visualization Processes Optimize?, IEEE Transactions on Visualization and Computer Graphics (TVCG) 22 (12) (2016) 2619–2632. doi:10.1109/TVCG.2015.2513410
2016
-
[19]
Sacha, A
D. Sacha, A. Sto ffel, F. Sto ffel, B. C. Kwon, G. P. Ellis, D. A. Keim, Knowledge Generation Model for Visual Analytics, IEEE Transactions on Visualization and Computer Graphics (TVCG) 20 (12) (2014) 1604–
2014
-
[20]
H ¨oferlin, R
B. H ¨oferlin, R. Netzel, M. H ¨oferlin, D. Weiskopf, G. Heidemann, Inter- Active Learning of Ad-Hoc Classifiers for Video Visual Analytics, in: IEEE Visual Analytics Science and Technology (V AST), IEEE, 2012, pp. 23–32. doi:10.1109/VAST.2012.6400492
2012
-
[21]
Bernard, D
J. Bernard, D. Sessler, A. Bannach, T. May, J. Kohlhammer, A visual ac- tive learning system for the assessment of patient well-being in prostate cancer research, in: Proceedings of the 2015 Workshop on Visual Ana- lytics in Healthcare, V AHC ’15, Association for Computing Mac...
2015
-
[22]
Bernard, D
J. Bernard, D. Sessler, T. Ruppert, J. Davey, A. Kuijper, J. Kohlham- mer, User-Based Visual-Interactive Similarity Definition for Mixed Data Objects-Concept and First Implementation, Journal of WSCG 22 (2014) 329–338
2014
-
[23]
G. M. H. Mamani, F. M. Fatore, L. G. Nonato, F. V . Paulovich, User- driven Feature Space Transformation, Computer Graphics Forum (CGF) 32 (3) (2013) 291–299. doi:10.1111/cgf.12116
2013 doi
-
[24]
Bernard, M
J. Bernard, M. Zeppelzauer, M. Sedlmair, W. Aigner, VIAL: a uni- fied process for visual interactive labeling, Vis. Comput. 34 (9) (2018) 1189–1207. doi:10.1007/s00371-018-1500-3 . URL https://doi.org/10.1007/s00371-018-1500-3
2018 doi
-
[25]
Seifert, M
C. Seifert, M. Granitzer, User-Based Active Learning, 2010 IEEE Inter- national Conference on Data Mining Workshops (2010) 418–425 doi: 10.1109/ICDMW.2010.181
2010 doi
-
[26]
Grimmeisen, M
B. Grimmeisen, M. Chegini, A. Theissler, VisGIL: machine learning- based visual guidance for interactive labeling, The Visual Computer 39 (10) (2023) 5097–5119. doi:10.1007/s00371-022-02648-2 . URL https://doi.org/10.1007/s00371-022-02648-2
2023 doi
-
[27]
B. C. Benato, J. F. Gomes, A. C. Telea, A. X. Falc˜ao, Semi-automatic data annotation guided by feature space projection, Pattern Recognition 109 (2021) 107612. doi:https://doi.org/10.1016/j.patcog.2020. 107612. URL https://www.sciencedirect.com/science/article/pii/ S0031320320304155
2021 doi
-
[28]
Chegini, J
M. Chegini, J. Bernard, P. Berger, A. Sourin, K. Andrews, T. Schreck, Interactive Labelling of a Multivariate Dataset for Supervised Machine Learning Using Linked Visualisations, Clustering, and Active Learning, Visual Informatics 3 (1) (2019) 9 – 17, proceedings of PacificV A...
2019 doi
-
[29]
F. L. Dennig, T. Polk, Z. Lin, T. Schreck, H. Pfister, M. Behrisch, FDive: Learning Relevance Models Using Pattern-based Similarity Measures , 2019 IEEE Conference on Visual Analytics Science and Technology (V AST) (2019) 69–80doi:10.1109/VAST47406.2019.8986940. URL https://do...
2019
-
[30]
D. Beil, A. Theissler, Cluster-clean-label: an interactive machine learn- ing approach for labeling high-dimensional data, Proceedings of the 13th International Symposium on Visual Information Communication and In- teraction (2020). doi:10.1145/3430036.3430060. URL https://doi...
2020
-
[31]
Song, Personalized Image Classification by Semantic Embedding and Active Learning, Entropy 22 (11) (2020)
M. Song, Personalized Image Classification by Semantic Embedding and Active Learning, Entropy 22 (11) (2020). doi:10.3390/e22111314. URL https://www.mdpi.com/1099-4300/22/11/1314
2020 doi
-
[32]
Schr ¨oder, R
S.-M. Schr ¨oder, R. Kiko, R. Koch, MorphoCluster: E fficient Annota- tion of Plankton Images by Clustering, Sensors 20 (11) (2020). doi: 10.3390/s20113060. URL https://www.mdpi.com/1424-8220/20/11/3060
2020 doi
-
[33]
Santini, R
S. Santini, R. Jain, Similarity measures, IEEE Transactions on Pat- tern Analysis and Machine Intelligence 21 (9) (1999) 871–883. doi: 10.1109/34.790428
1999 doi
-
[34]
J. Han, J. Pei, M. Kamber, Cluster analysis: Basic concepts and methods, in: Data Mining: Concepts and Techniques, Elsevier, 2012, Ch. 10, pp. 443–495. doi:https://doi.org/10.1016/C2009-0-61819-5
2012 doi
-
[35]
Kullback, R
S. Kullback, R. A. Leibler, On Information and Su fficiency, The Annals of Mathematical Statistics 22 (1) (1951) 79–86. URL http://www.jstor.org/stable/2236703
1951
-
[36]
Kolmogorov, Sulla determinazione empirica di una legge di dis- tribuzione, G
A. Kolmogorov, Sulla determinazione empirica di una legge di dis- tribuzione, G. Ist. Ital. Attuari 4 (1933) 83–91
1933
-
[37]
Smirnov, Table for Estimating the Goodness of Fit of Empirical Dis- tributions, The Annals of Mathematical Statistics 19 (2) (1948) 279–281
N. Smirnov, Table for Estimating the Goodness of Fit of Empirical Dis- tributions, The Annals of Mathematical Statistics 19 (2) (1948) 279–281. URL http://www.jstor.org/stable/2236278
1948
-
[38]
J. L. W. V . Jensen, Sur les fonctions convexes et les in ´egalit´es entre les valeurs moyennes, Acta Mathematica 30 (none) (1906) 175 – 193. doi: 10.1007/BF02418571. URL https://doi.org/10.1007/BF02418571
1906 doi
-
[39]
A. K. Jain, Data clustering: 50 years beyond K-means, Pattern Recogni- tion Letters 31 (8) (2010) 651–666, award winning papers from the 19th International Conference on Pattern Recognition (ICPR). doi:https: //doi.org/10.1016/j.patrec.2009.09.011. URL https://www.sciencedirec...
2010 doi
-
[40]
J. C. Dunn, Well-separated clusters and optimal fuzzy partitions, Journal of Cybernetics 4 (1) (1974) 95–104. arXiv:https://doi.org/10. 1080/01969727408546059, doi:10.1080/01969727408546059. URL https://doi.org/10.1080/01969727408546059
1974 doi
-
[41]
P. J. Rousseeuw, Silhouettes: A graphical aid to the interpretation and val- idation of cluster analysis, Journal of Computational and Applied Math- ematics 20 (1987) 53 – 65. doi:https://doi.org/10.1016/0377- 0427(87)90125-7
1987 doi
-
[42]
D. L. Davies, D. W. Bouldin, A Cluster Separation Measure, IEEE Trans- actions on Pattern Analysis and Machine Intelligence PAMI-1 (2) (1979) 224–227. doi:10.1109/TPAMI.1979.4766909
1979
-
[43]
J. H. Ward, Hierarchical Grouping to Optimize an Objective Function, Journal of the American Statistical Association 58 (301) (1963) 236–244. URL http://www.jstor.org/stable/2282967
1963
-
[44]
Halkidi, Y
M. Halkidi, Y . Batistakis, M. Vazirgiannis, Clustering Validity Checking Methods: Part II, SIGMOD Rec. 31 (3) (2002) 19–27. doi:10.1145/ 15 601858.601862
2002
-
[45]
Bonacich, Power and Centrality: A Family of Measures, American Journal of Sociology 92 (5) (1987) 1170–1182
P. Bonacich, Power and Centrality: A Family of Measures, American Journal of Sociology 92 (5) (1987) 1170–1182. arXiv:https://doi. org/10.1086/228631, doi:10.1086/228631. URL https://doi.org/10.1086/228631
1987 doi
-
[46]
N. A. Court, Notes on the centroid, The Mathematics Teacher 53 (1) (1960) 33–35. URL http://www.jstor.org/stable/27956057
1960
-
[47]
Wilkinson, A
L. Wilkinson, A. Anand, R. L. Grossman, Graph-Theoretic Scagnostics., in: IEEE Symposium on Information Visualization (InfoVis), 2005, pp. 157–164. doi:10.1109/INFOVIS.2005.14
2005 doi
-
[48]
T. N. Dang, L. Wilkinson, Transforming scagnostics to reveal hid- den features, IEEE Transactions on Visualization and Computer Graph- ics (TVCG) 20 (12) (2014) 1624–1632. doi:10.1109/TVCG.2014. 2346572
2014 doi
-
[49]
Matute, A
J. Matute, A. C. Telea, L. Linsen, Skeleton-based scagnostics, IEEE Transactions on Visualization and Computer Graphics (TVCG) 24 (1) (2018) 542–552
2018
-
[50]
Y . Wang, Z. Wang, T. Liu, M. Correll, Z. Cheng, O. Deussen, M. Sedl- mair, Improving the Robustness of Scagnostics, IEEE Transactions on Visualization and Computer Graphics 26 (1) (2020) 759–769. doi: 10.1109/TVCG.2019.2934796
2020
-
[51]
Behrisch, B
M. Behrisch, B. Bach, M. Hund, M. Delz, L. V on R ¨uden, J. Fekete, T. Schreck, Magnostics: Image-Based Search of Interesting Matrix Views for Guided Network Exploration, IEEE Transactions on Visualization and Computer Graphics (TVCG) 23 (1) (2017) 31–40.doi:10.1109/TVCG. 2016.2598467
2017
-
[52]
T. N. Dang, A. Anand, L. Wilkinson, Timeseer: Scagnostics for high- dimensional time series, IEEE Transactions on Visualization and Com- puter Graphics (TVCG) 19 (3) (2013) 470–483. doi:10.1109/TVCG. 2012.128
2013 doi
-
[53]
Dasgupta, R
A. Dasgupta, R. Kosara, Pargnostics: Screen-space metrics for parallel coordinates, IEEE Transactions on Visualization and Computer Graphics (TVCG) 16 (6) (2010) 1017–1026. doi:10.1109/TVCG.2010.184
2010 doi
-
[54]
D. J. Lehmann, F. Kemmler, T. Zhyhalava, M. Kirschke, H. Theisel, Vi- sualnostics: Visual Guidance Pictograms for Analyzing Projections of High-dimensional Data, Computer Graphics Forum (CGF) 34 (3) (2015) 291–300. doi:10.1111/cgf.12641
2015 doi
-
[55]
Schneidewind, M
J. Schneidewind, M. Sips, D. A. Keim, Pixnostics: Towards measuring the value of visualization, in: IEEE Visual Analytics Science and Tech- nology (V AST), 2006, pp. 199–206
2006
-
[56]
M. Sips, B. Neubert, J. P. Lewis, P. Hanrahan, Selecting good views of high-dimensional data using class consistency, Computer Graphics Fo- rum (CGF) 28 (3) (2009) 831–838
2009
-
[57]
A. Tatu, G. Albuquerque, M. Eisemann, P. Bak, H. Theisel, M. Magnor, D. Keim, Automated Analytical Methods to Support Visual Exploration of High-Dimensional Data, IEEE Transactions on Visualization and Com- puter Graphics 17 (5) (2011) 584–597. doi:10.1109/TVCG.2010.242
2011 doi
-
[58]
Rensink, G
R. Rensink, G. Baldridge, The Perception of Correlation in Scatterplots, Computer Graphics Forum (CGF) 29 (3) (2010) 1203–1210
2010
-
[59]
M. M. Abbas, M. Aupetit, M. Sedlmair, H. Bensmail, ClustMe: A Visual Quality Measure for Ranking Monochrome Scatterplots based on Cluster Patterns, Computer Graphics Forum (CGF) 38 (3) (2019) 225–236. doi: 10.1111/cgf.13684
2019 doi
-
[60]
Aupetit, M
M. Aupetit, M. Sedlmair, SepMe: 2002 New visual separation measures, in: IEEE Pacific Visualization Symposium (PacificVis), 2016, pp. 1–8. doi:10.1109/PACIFICVIS.2016.7465244
2002
-
[61]
Sedlmair, M
M. Sedlmair, M. Aupetit, Data-driven Evaluation of Visual Quality Mea- sures, Computer Graphics Forum (CGF) 34 (3) (2015) 201–210. doi: 10.1111/cgf.12632
2015 doi
-
[62]
Bernard, M
J. Bernard, M. Zeppelzauer, M. Lehmann, M. M ¨uller, M. Sedlmair, To- wards User-Centered Active Learning Algorithms, Computer Graphics Forum (CGF) (2018) 121–132
2018
-
[63]
Bernard, M
J. Bernard, M. Hutter, M. Lehmann, M. M ¨uller, M. Zeppelzauer, M. Sedl- mair, Learning from the best: visual analysis of a quasi-optimal data la- beling strategy, in: Proceedings of the Eurographics/IEEE VGTC Confer- ence on Visualization: Short Papers, EuroVis ’18, Eurograph...
2018
-
[64]
Chegini, J
M. Chegini, J. Bernard, J. Cui, F. Chegini, A. Sourin, K. Andrews, T. Schreck, Interactive Visual Labelling versus Active Learning: An Ex- perimental Comparison, Frontiers of Information Technology & Elec- tronic Engineering (FITEE) 21 (4) (2020) 524–535. doi:10.1631/ FITEE.1900549
2020
-
[65]
Kottke, G
D. Kottke, G. Krempl, M. Stecklina, C. S. von Rekowski, T. Sabsch, T. P. Minh, M. Deliano, M. Spiliopoulou, B. Sick, Probabilistic Ac- tive Learning for Active Class Selection, CoRR abs /2108.03891 (2021). arXiv:2108.03891. URL https://arxiv.org/abs/2108.03891
2021 arXiv
-
[66]
J. Deng, W. Dong, R. Socher, L.-J. Li, K. Li, L. Fei-Fei, ImageNet: A large-scale hierarchical image database, 2009 IEEE Conference on Com- puter Vision and Pattern Recognition (2009) 248–255 doi:10.1109/ CVPR.2009.5206848
2009
-
[67]
Rubio, E
S. Rubio, E. D ´ıaz, J. Mart ´ın, J. M. Puente, Evaluation of Sub- jective Mental Workload: A Comparison of SW AT, NASA-TLX, and Workload Profile Methods, Applied Psychology 53 (1) (2004) 61–86. arXiv:https://iaap-journals.onlinelibrary.wiley. com/doi/pdf/10.1111/j.1464-0597.2...
2004
-
[68]
van der Maaten, G
L. van der Maaten, G. Hinton, Visualizing Data using t-SNE, Journal of Machine Learning Research 9 (86) (2008) 2579–2605. URL http://jmlr.org/papers/v9/vandermaaten08a.html
2008
-
[69]
Z. Liu, P. Luo, X. Wang, X. Tang, Deep Learning Face Attributes in the Wild, in: Proceedings of the 2015 IEEE International Conference on Computer Vision (ICCV), ICCV ’15, IEEE Computer Society, USA, 2015, p. 3730–3738. doi:10.1109/ICCV.2015.425. URL https://doi.org/10.1109/IC...
2015 doi
-
[71]
Wild Cat
Usage Scenario - Flip Book with Significant Stages ∗Corresponding Author Email address: matthias.matt@tuwien.ac.at (Matthias Matt ) Preprint submitted to Computers & Graphics May 7, 2025 arXiv:2505.03618v1 [cs.HC] 6 May 2025 Figure 1: First, the user has to initialize the syst...
2025 arXiv
-
[1613]
doi:10.1109/TVCG.2014.2346481
2014
Reviewed August 15, 2026 · model on record in the stance chip above.
Discussion (0). Continue with ORCID to comment.